Abstract
Rice (Oryza sativa L.) germplasms with an amylose content above 30% were identified by screening 9481 accessions from the Rural Development Administration (RDA) gene bank. The total set of accessions came from 65 countries, including Korea, China, Japan, the Philippines, India, Taiwan, the United States, and Russia. High-throughput near infrared reflectance (NIR) spectroscopy equipped with a fiberoptic probe (700~2500 nm) was used to estimate the amylose content. The amylose contents ranged from 5 to 40% based on NIR spectroscopy; divided into 5% increments, the amylose content of 2820 accessions was found to be between 15 and 20%. To select rice accessions high in amylose, 239 accessions with an amylose content of 30% or greater were selected based on NIR spectroscopy data and cultivated in the field for final selection. Among the 239 accessions selected and cultivated, 151 were deemed agronomically satisfactory. Among the 151 accessions, based on laboratory analysis, 14 had an amylose content higher than 30% and 33 had an amylose content between 28 and 30%. The amylose contents of the reference cultivars Hopum-byeo and Sobi-byeo were 20.7% and 19.9%, respectively. Finally, successful selection of accessions with high amylose content from the large RDA gene bank collection was achieved based on a combination of NIR spectroscopy and laboratory data.
-
Key words: Amylose content, Germplasm, NIR, Rice
INTRODUCTION
Rice (
Oryza sativa L.) is a staple food for half of the world’s population, especially in southern Asian countries (
Singh et al. 2005). Rice is usually consumed as cooked rice, but a relatively small amount is also used as raw material for processed food production. The rice grain endosperm is composed of about 90% starch, and the starch granule is composed of 3–9
μm polyhedral amylose and amylopectin (
Juliano 1985). Rice is typically divided into three grades according to their amylose contents: waxy (1~2% amylose), middle (21~25% amylose), and high (>25% amylose) (
Juliano 1979;
Song et al. 2008). The amylose content in non-glutinous rice varieties ranges from 8% to 37%, and is considered an important quality parameter for consumption and processing of milled rice (
Perez and Juliano 1979). Amylose content above 20% influences the palatability of rice, and sensory test results have revealed that the amylose content is negatively correlated with the consistency, plasticity, color, and glitter appearance of starch. Consumers select rice varieties with desirable cooking qualities, and low amylose content rice varieties are moist, sticky, glittery, and are converted to porridge through boiling. In the cooking process, rice varieties with high amylose contents become dried, non-sticky, and hardened, whereas the middle level amylose rice varieties are more sticky compared to high amylose content rice and consistently tender. The Koreans and Japanese prefer to eat rice that is tender and soft.
Rice consumption in Korea has decreased as Koreans have become westernized and diversified in their food consumption habits. The population of Korea represents an increasingly large percentage of the populations of southern and Southeast Asia. Rice flour has become increasingly attractive as a raw material for processed food production and as a substitute for wheat (
Triticum aestivum L.) flour (
Demirkesen et al. 2013) and the Korean government has been trying to promote rice flour consumption in processed foods. To facilitate the market for processed rice foods, identifying high amylose content rice that produces high-quality rice flour is essential. Typically, the
japonica rice varieties cultivated in temperate climates have a reduced amylose content, while the amylose content of
indica rice varieties is dependent on where they are grown and the preferences of the local consumers. The rice varieties from the Philippines, Malaysia, Indonesia, and Latin America have moderate amylose content, whereas the varieties from Vietnam, Thailand, Laos, and India are typically high in amylose content.
The rice amylose content is usually affected by the environment, including temperature. The amylose content of a given rice variety can vary by more than 7%, depending on the temperature and time of cultivation. Many gene banks, including that of the Rural Development Administration (RDA), conserve rice germplasms collected from different countries at different times, which provides inclusion of variations in seed conditions. Given the size of the rice germplasm collection, propagating all the accessions in the gene bank under the same environmental conditions would be difficult. To facilitate assessing a large number of accessions, high-throughput technology involving DNA markers, near infrared reflectance (NIR) spectroscopy, and bioassay protocols are absolutely essential.
The near infrared wavelength (700~2500 nm) is between that of visible and mid infrared. It is classified as a combination band (1950~2500 nm) and overtone band (700~1950 nm), according to the vibrated molecular functional groups such as -CH, -NH, and -OH. To investigate specific traits using NIR spectroscopy, improved transmission and reflection methods have been adopted. Sometimes a specific wavelength is required for a given trait (
Abrams et al. 1987;
Clarke et al. 1992). Spectroscopic analysis using near infrared is widely adapted to quantitative and qualitative analysis of food, medicine, and other chemicals. This type of analysis is also used for integrated assessment, such as nondestructive appetite testing of cooked rice (
Kwon et al. 2006;
Song et al. 2006). Our experiment was conducted to identify accessions with high amylose from a large collection of rice accessions, and NIR spectroscopy was used to identify rice germplasms with amylose contents above 30%, which was confirmed by laboratory analyses.
MATERIALS AND METHODS
Material preparation for NIR scanning
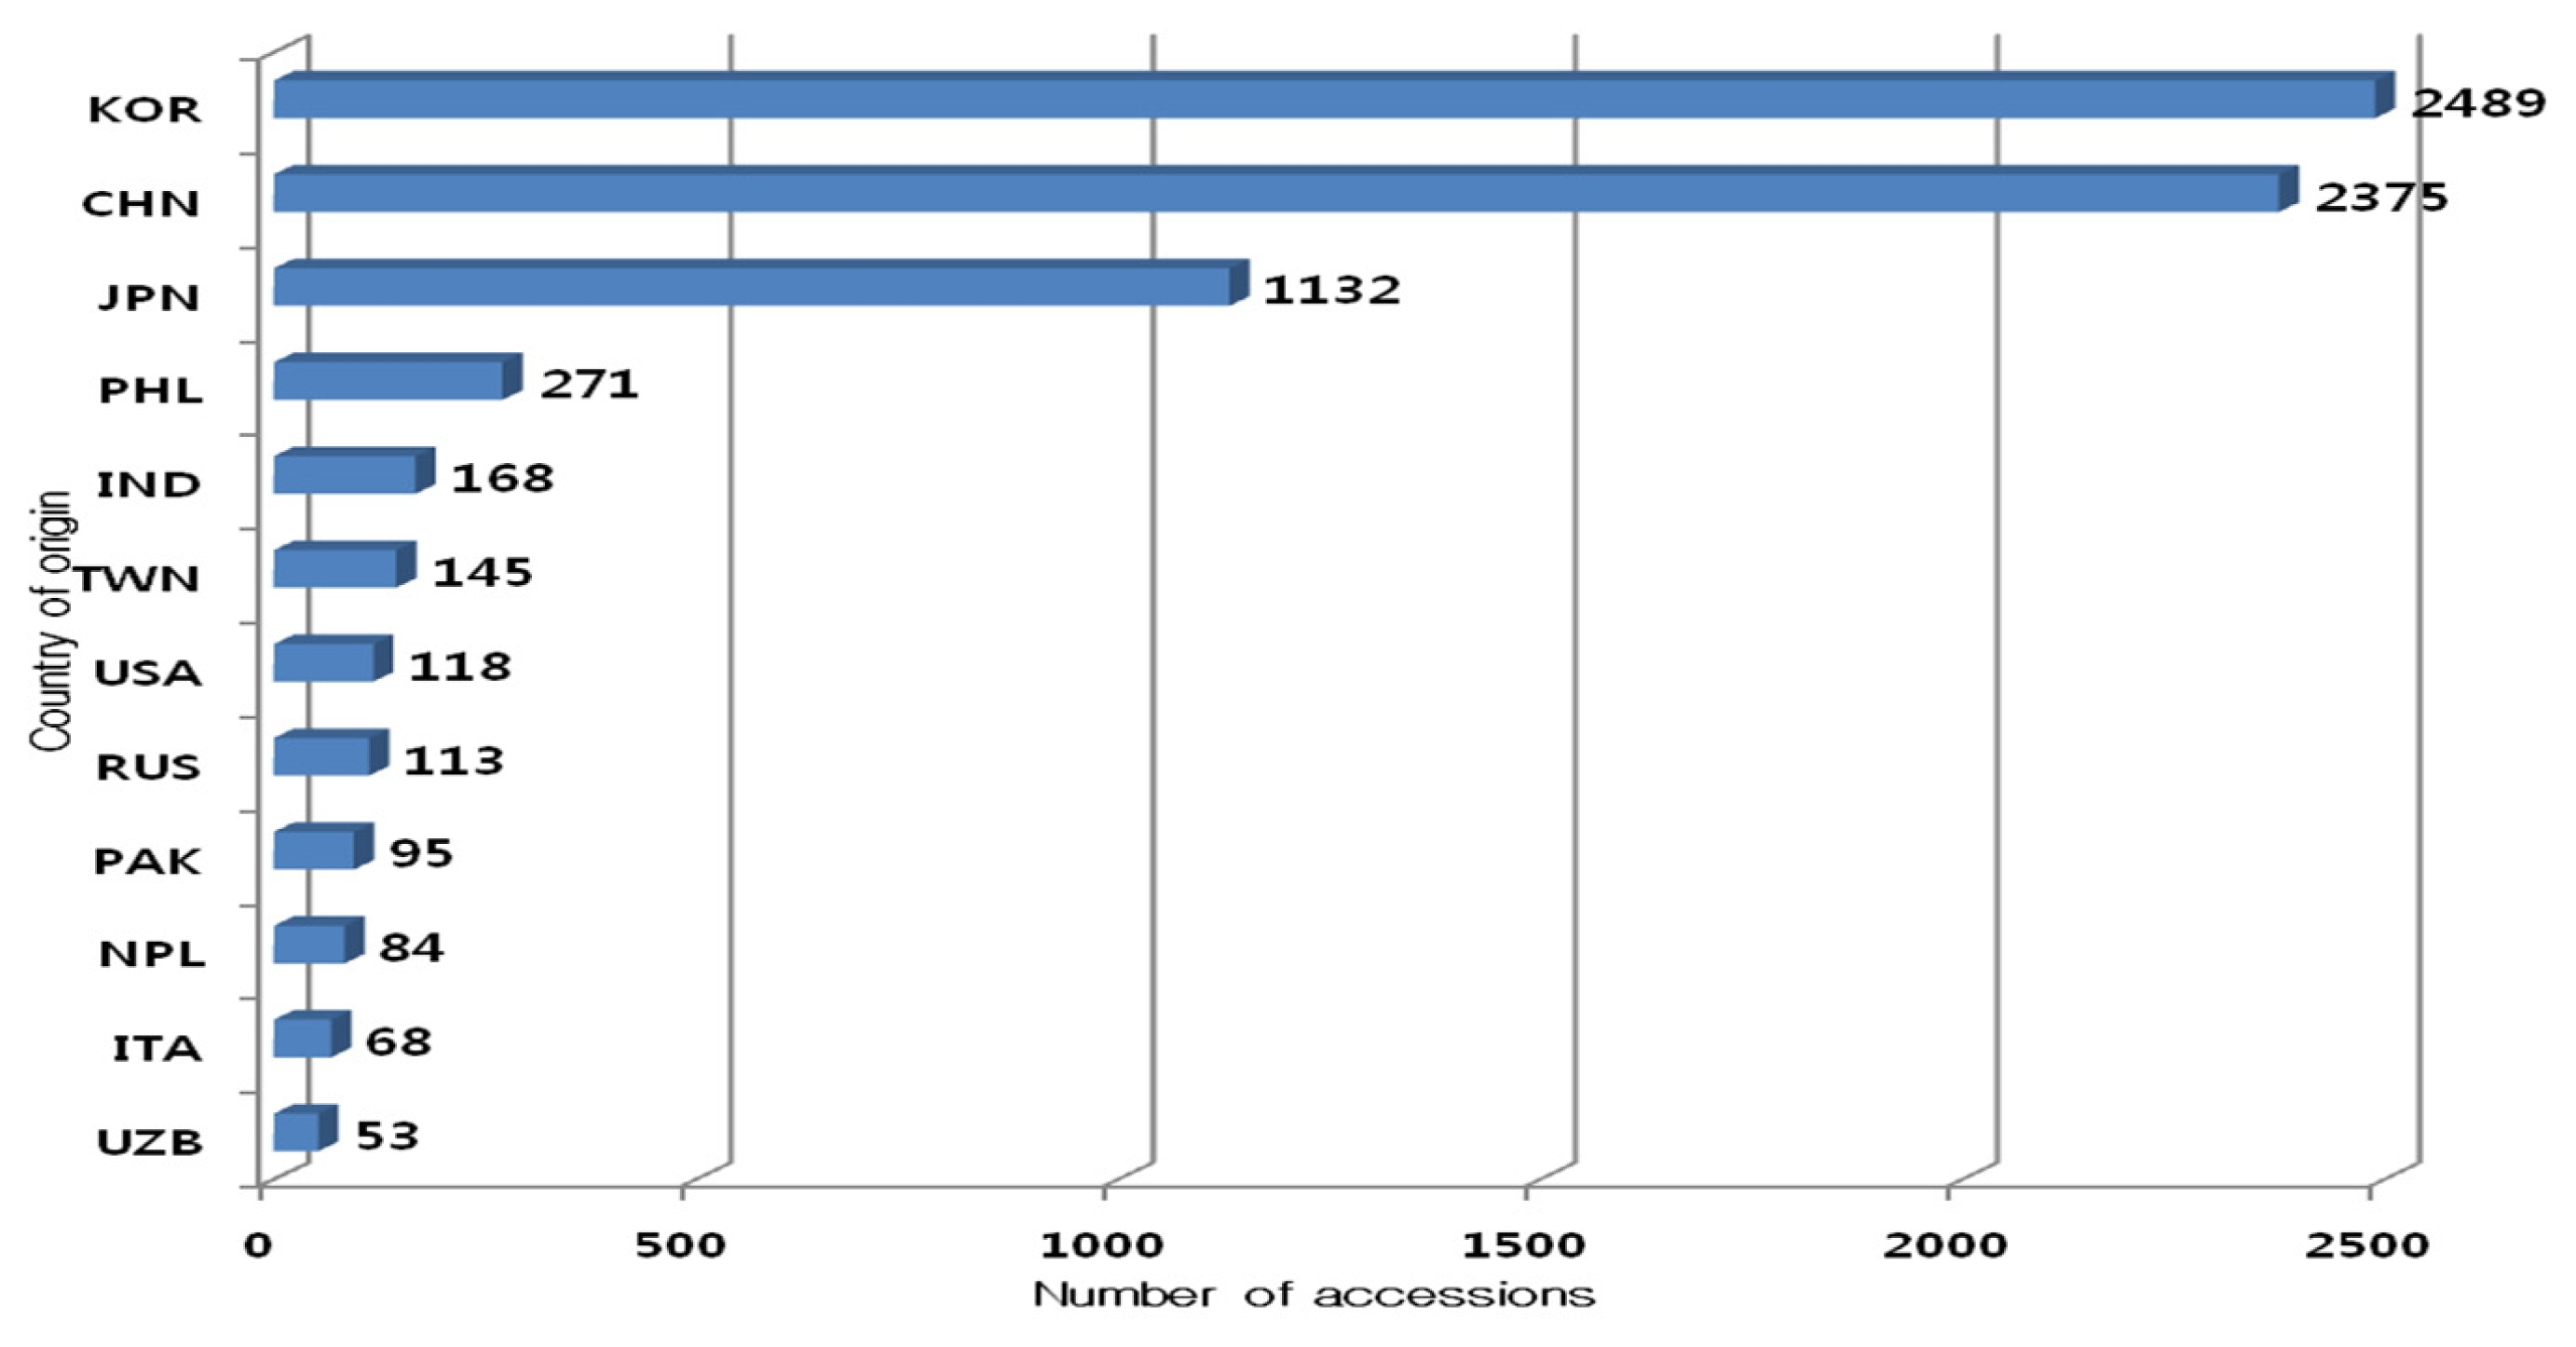
The raw materials used in this study were collected from the RDA gene bank. In total, 9481 accessions with a germination rate greater than 80% were scanned using NIR spectroscopy. Prior to NIR scanning, the accessions were husked using a laboratory husker (SY88-TH; Ssangyong, Incheon, Republic of Korea). The accessions originated from 65 countries, including Korea (2489), China (2375), Japan (1131), the Philippines (271), India (168), Taiwan (145), the United States (118), Russia (113), Pakistan (95), Nepal (84), Italy (68), and Uzbekistan (53) (
Fig. 1).
Scanning was conducted using a 6500 NIR system (Foss NIRSystems, Inc., Silver Spring, MD, USA). The profiles were retrieved in 4-nm intervals between 400~2500 nm, then filed and processed first through differentiation to avoid overlap and interference between the profiles.
Amylose content simulation and selected candidate collection
The amylose content was simulated using an NIR spectrum and a standard curve developed by
Kim (2008). Simulation was based on 134 accessions of freshly harvested rice samples that were diverse in origin and amylose content. The
R2 of the standard curve was 0.865. To adjust this standard curve, 239 high amylose rice accessions with a predicted amylose content greater than 35% were selected for further assessment.
In total, 239 accessions were planted in 2008 at Yesan, Chungcheongnam-do, and managed with standard cultivation methods. Data were collected on basic agronomic traits, including the heading date, panicle length, culm length, number of tillers, and grain shape, according to the RDA investigation manual.
Laboratory analysis of amylose content
The amylose content was analyzed using the method described by
Juliano (1971), with minor modifications. 100 mg of rice powder was placed in a 100-mL volumetric flask, then 1 mL of 95% ethanol and 9 mL of 1 N NaOH were added before boiled for 10 min in a water bath for gelatinization, then fill up 100-mL with distilled water. Then took 5 mL of this 100mL solution and added 1 mL acetic acid and 2 mL I
2 – KI and diluted this to 100 mL. For color formation, the solution was incubated at 30°C for 20 min. Colorimetric estimation was conducted at 620 nm using a UV/Vis spectrophotometer (UV-2450; Shimadzu, Otsu, Japan). The amylose content was adjusted with a standard curve based on potato (
Solanum tuberosum L.) starch.
RESULTS
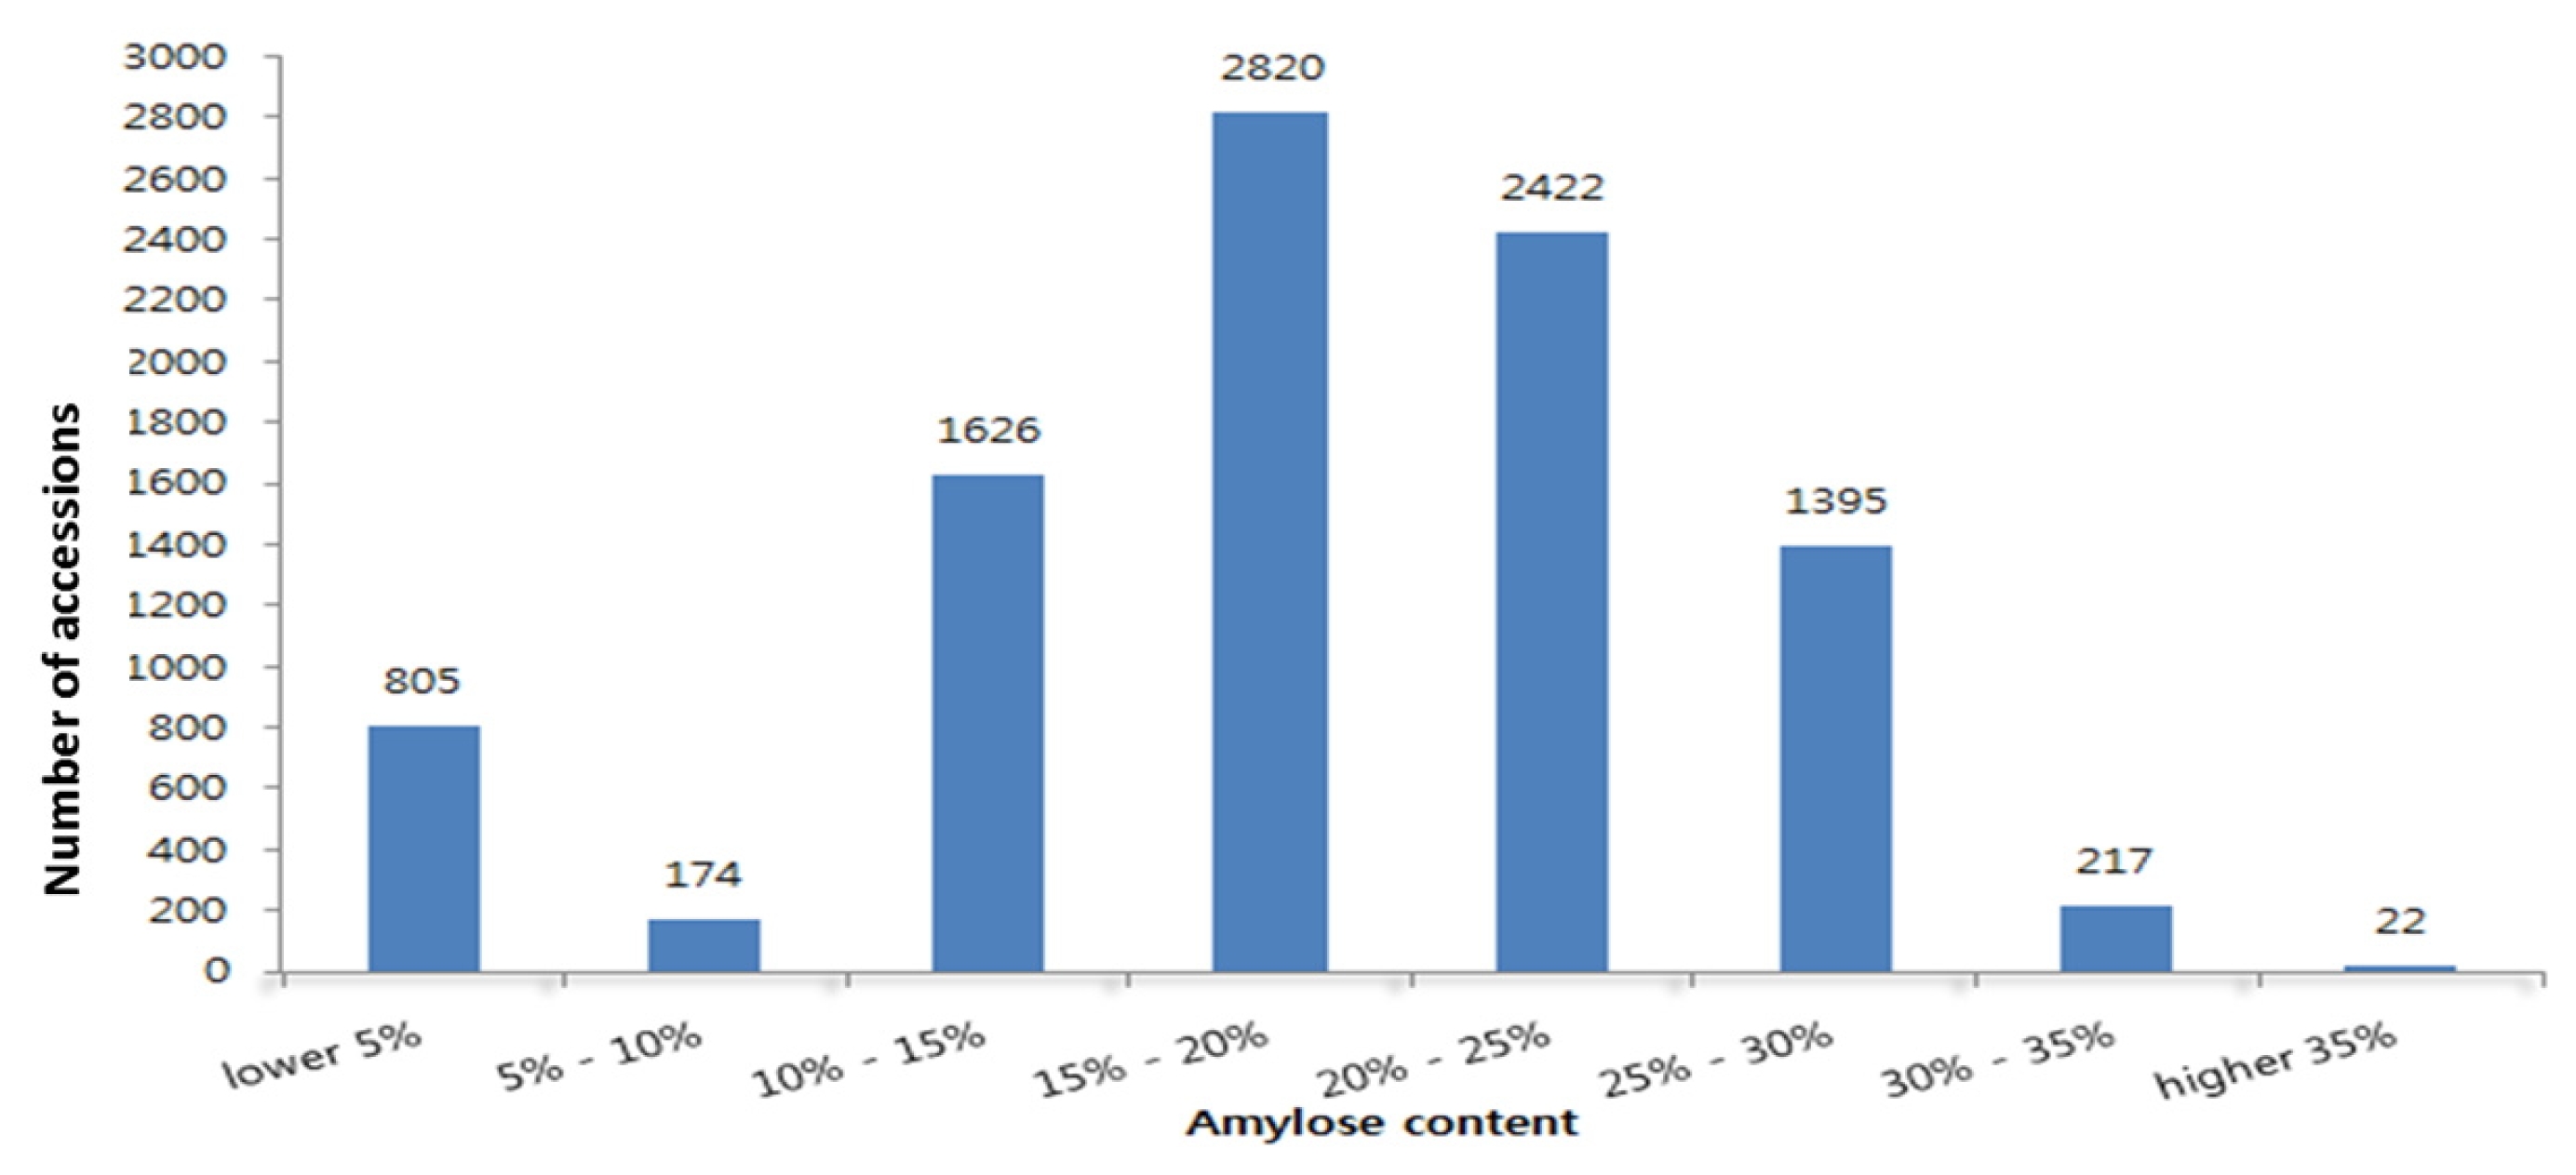
Figure 2 shows the distribution of 9481 rice accessions based on simulated amylose content, combining the NIR profile of brown rice through stepwise analyses. According to the simulated values of amylose content of the 9481 gene bank conserved rice accessions, 8263 had 10–30% amylose content, which represented about 87% of the total accessions. In total, 2820 accessions were within the simulated amylose content range of 15–20%, representing about 30% of the accessions, and 239 accessions had a simulated amylose content exceeding 30%.
The simulated and actual amylose contents can vary due to factors such as sample freshness and shape. Due to an inherent error of the simulation curve, we used laboratory analyses to confirm the accessions with high (>30%) amylose. These 239 high amylose accessions were from China, the Philippines, Korea, India, Taiwan, and Pakistan (
Table 1). Of these 239 accessions, only 151 had sufficient grain for an amylose analysis.
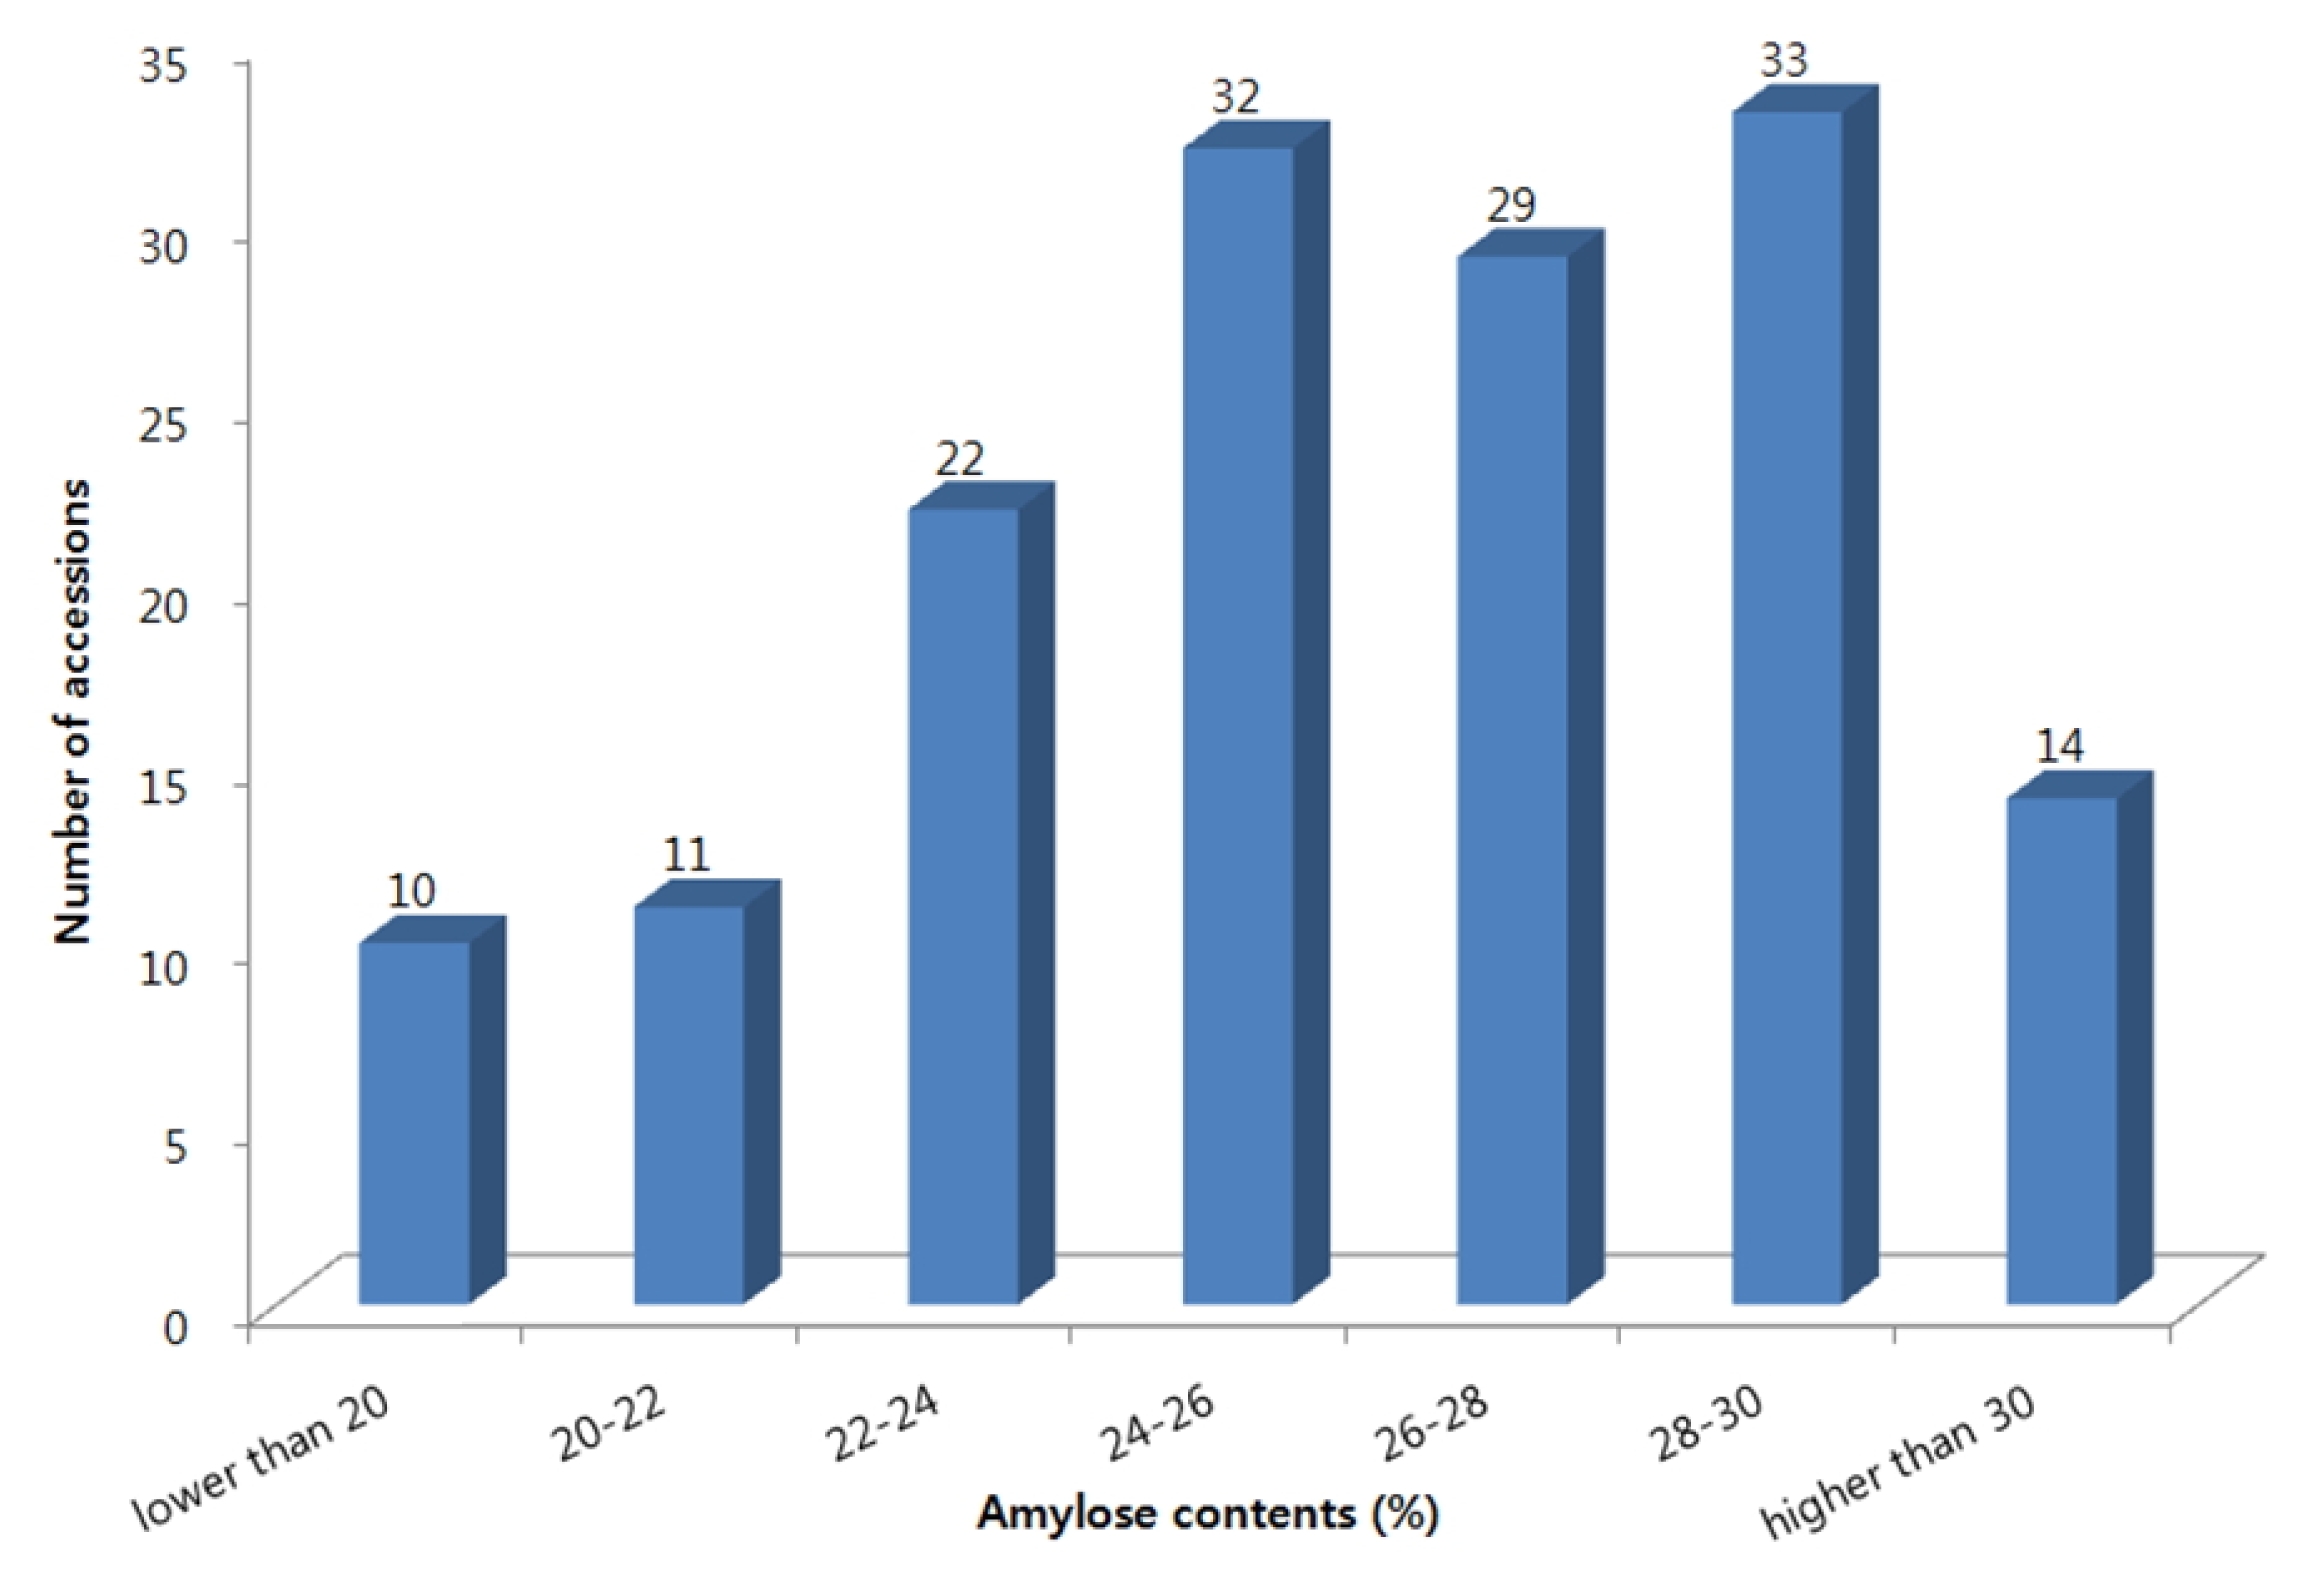
Figure 3 shows the distribution of the 151 accessions analyzed for amylose content. The samples were taken from plots cultivated uniformly in 2008 to avoid bias from growing conditions and sample processing. Only 47 accessions had an amylose content higher than 28%, and 14 accessions had an amylose content above 30%. The amylose contents of the reference varieties Hopum-byeo and Sobi-byeo were 20.7% and 19.9%, respectively, and the standard deviation of both cultivars was 0.73%.
Among the 14 selected rice accessions, six originated from the Philippines, three were from Pakistan, three were from Taiwan, and two were from China. Most of the accessions had a slender grain shape, whereas six accessions from Pakistan, the Philippines, and Taiwan had a round grain shape. The heading date of the 14 accessions ranged from 1 August to 30 August. The culm length ranged from 69 to 125 cm, the panicle length ranged from 20 to 31 cm, and the number of panicles per hull ranged from 7 to 14. All grains were of medium size, and the pericarp color was either transparent or brown (
Table 2).
DISCUSSION
We failed to identify the exact reason why 21 rice accessions had less than 22% amylose based on a laboratory analysis, despite being selected as high amylose accessions from NIR data. We hypothesize that variation between the simulated and laboratory amylose data could be due to freshness, ecotype, cultivation location, grain size, or pericarp color. The amylose content of common Korean rice varieties is usually less than 20%, but 130 of 151 accessions harvested, or 86% of the population, were identified as having an amylose content greater than 22%. In total, 108 accessions, or 71% of the 151 accessions, had an amylose content above 24%.
Although the simulated values of amylose content from NIR scanning only provided rough estimates, the data were useful in selecting 239 accessions with high amylose contents from a total of 9481 accessions. Chemical analysis confirmed the NIR data. Combining NIR scanning and chemical analysis is a very efficient way to make selections from a large population. NIR spectroscopy for high-throughput screening and chemical analysis for confirmation were effective in selecting high amylose rice germplasms. Composition data, combined with information on key agronomic traits, can guide selection.
None of the high amylose germplasms originated from Korea, but data on heading date indicated that the selections could be adapted to Korea or used in local rice breeding programs. These results will be useful in identifying diverse rice germplasms with high amylose contents for rice breeding in Korea. The next step will be to test the accessions for their combining abilities.
ACKNOWLEDGMENTS
This study was carried out with the support of the “Research Program for Agricultural Science & Technology Development (Project No. PJ008625),” National Academy of Agricultural Science, Rural Development Administration, Republic of Korea.
Fig. 1Twelve most common countries of origin of 9481 rice accessions used in the NIR spectroscopy analysis. (KOR-Korea, CHN-China, JPN-Japan, PHL-Philippines, IND-India, TWN-Taiwan, USA-United States of America, RUS-Russia, PAK-Pakistan, NPL-Nepal, ITA-Italia, UZB-Uzbekistan)
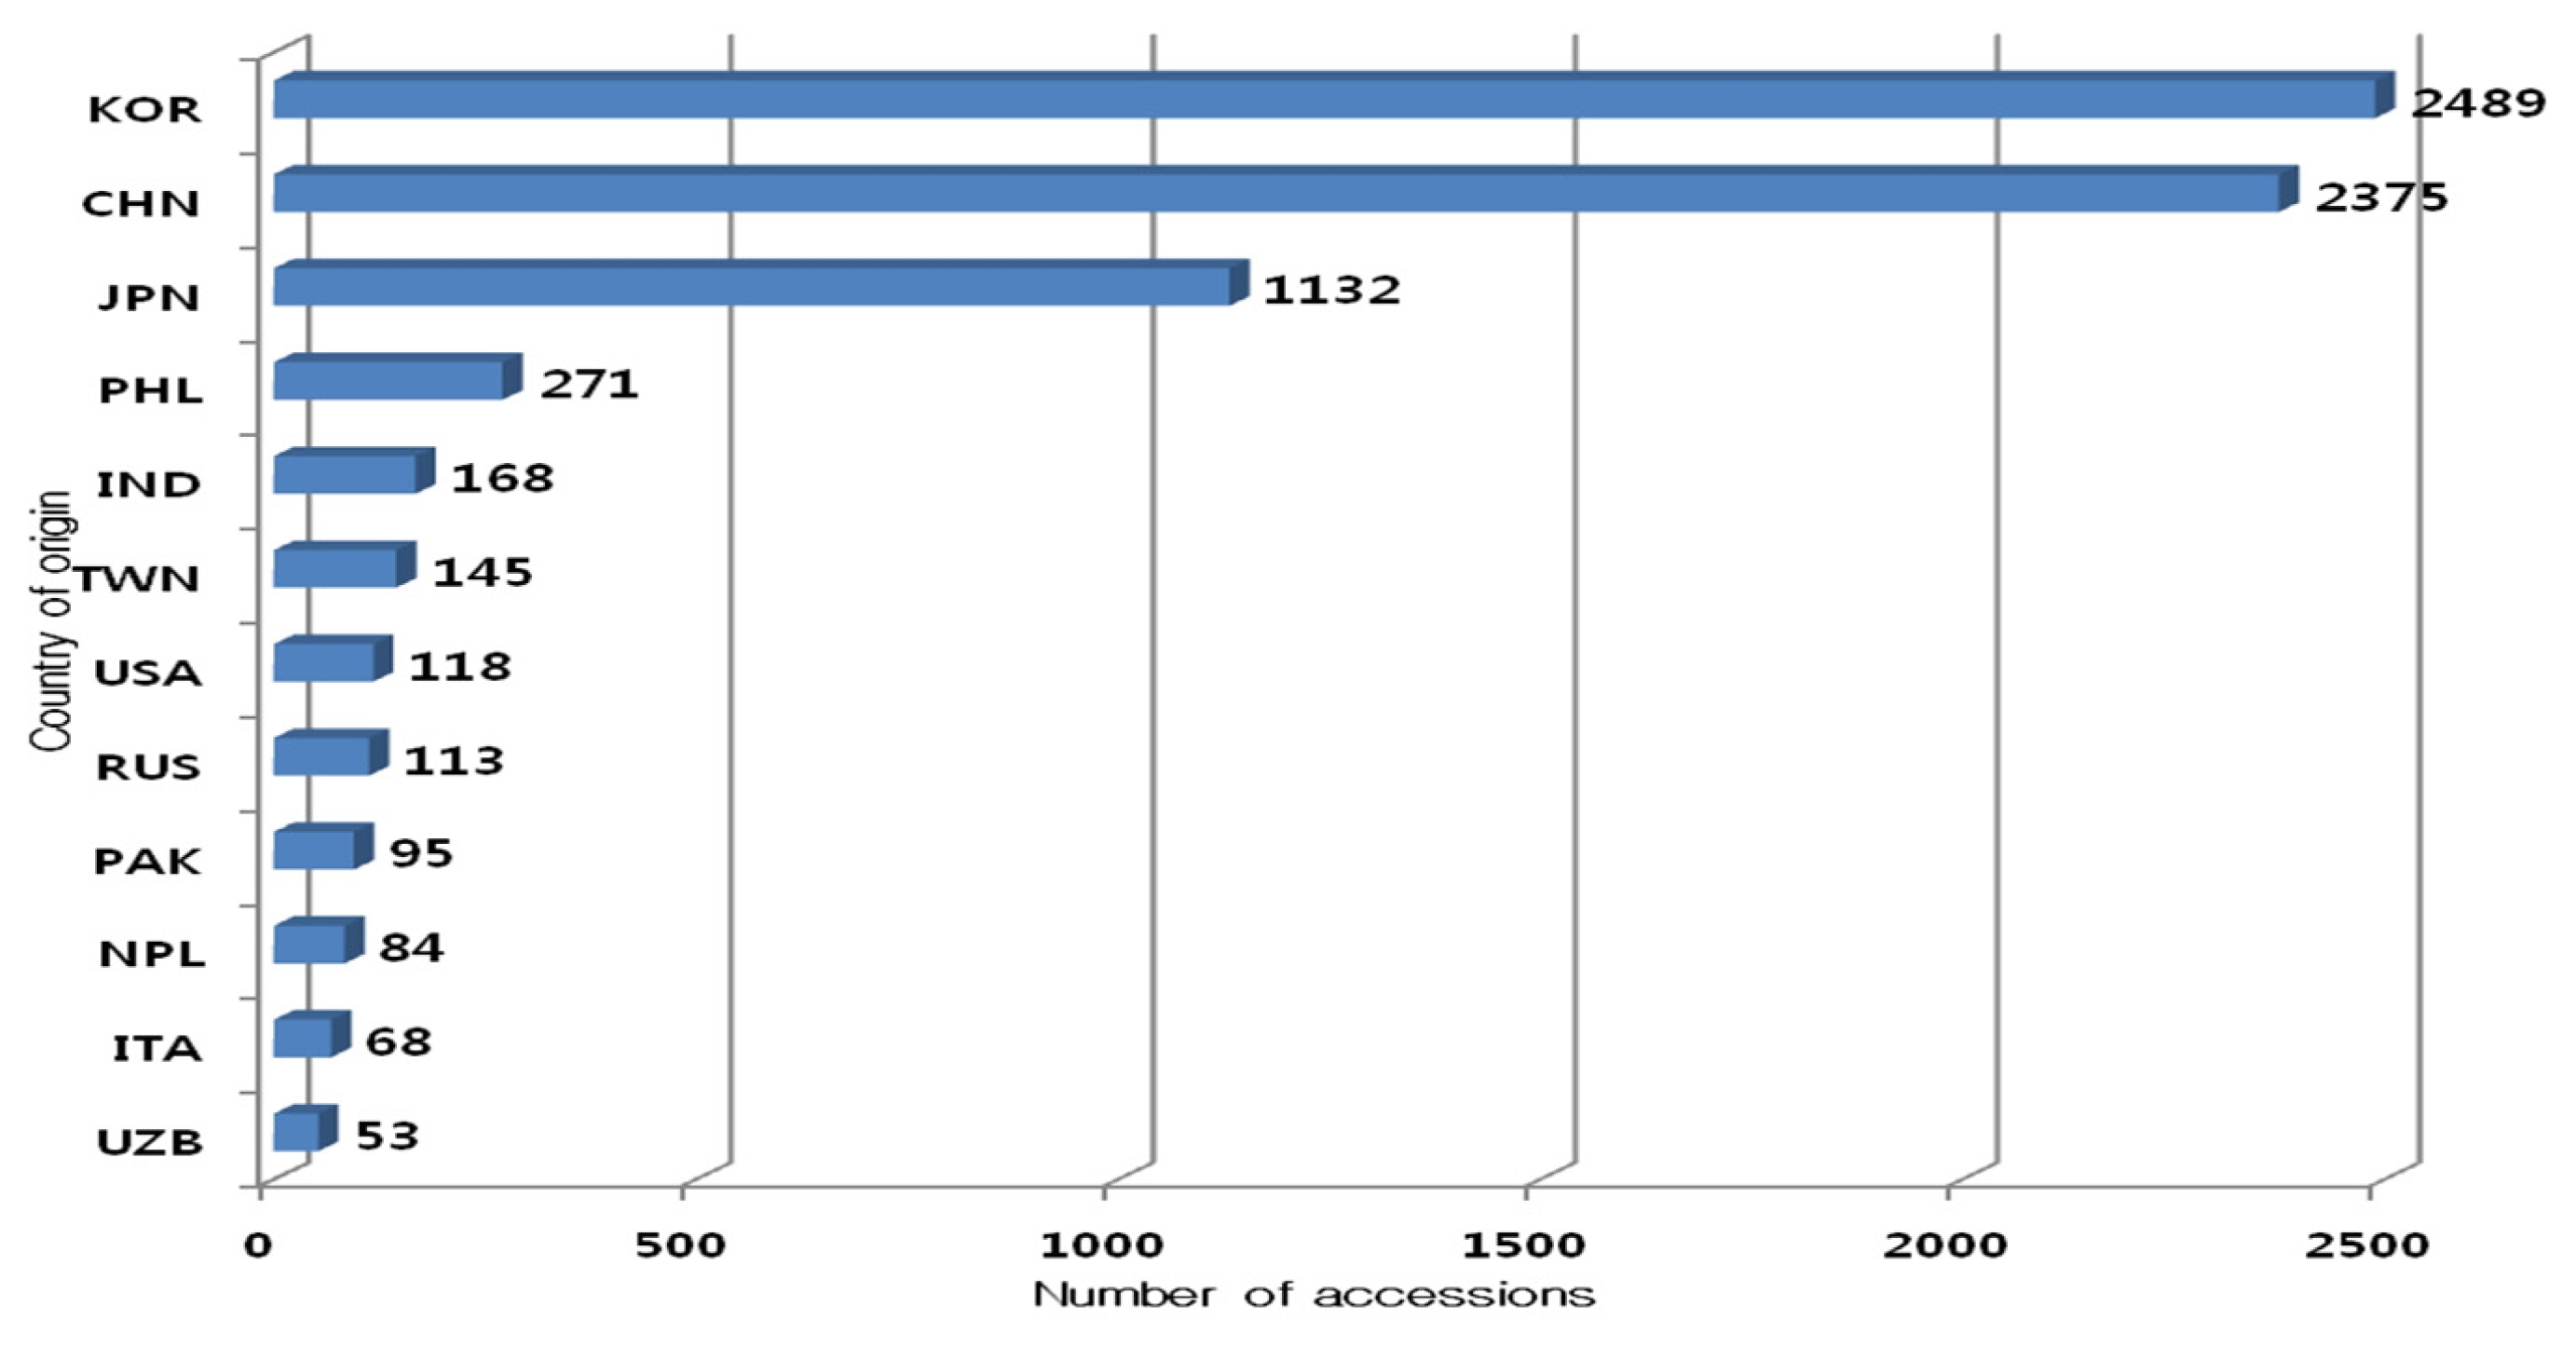
Fig. 2Distribution of amylose content simulated from 9481 accessions of rice germplasm from the RDA gene bank.
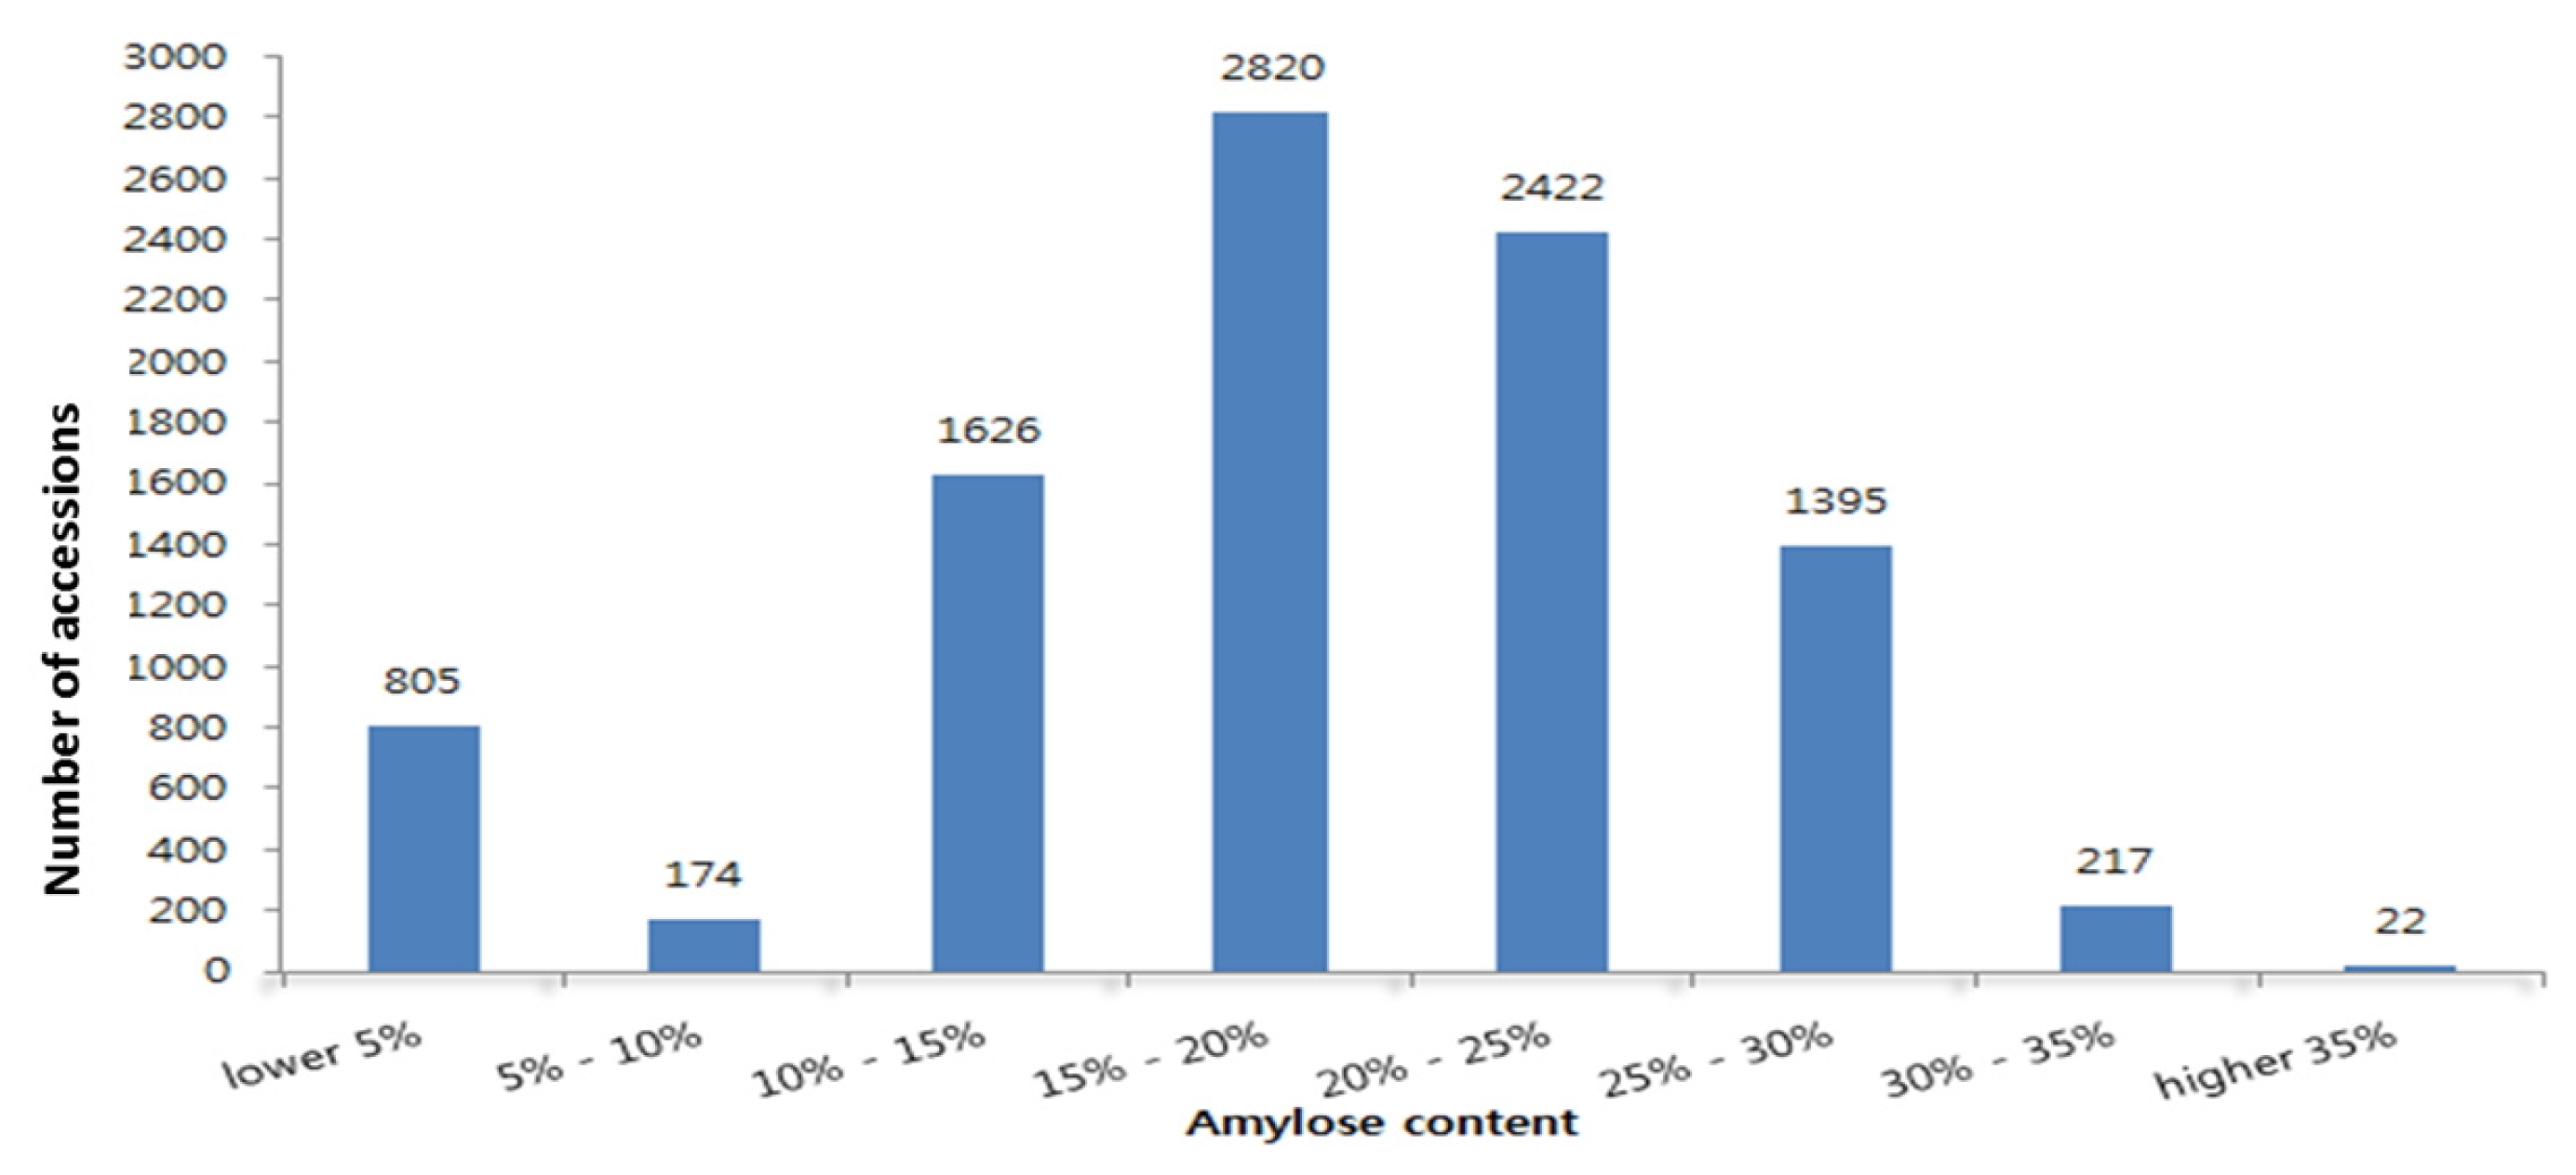
Fig. 3Distribution of laboratory analyzed amylose content on 151 of the 9,481 accessions of rice germplasm identified with amylose content above 30% according to NIR spectroscopy and simulation.
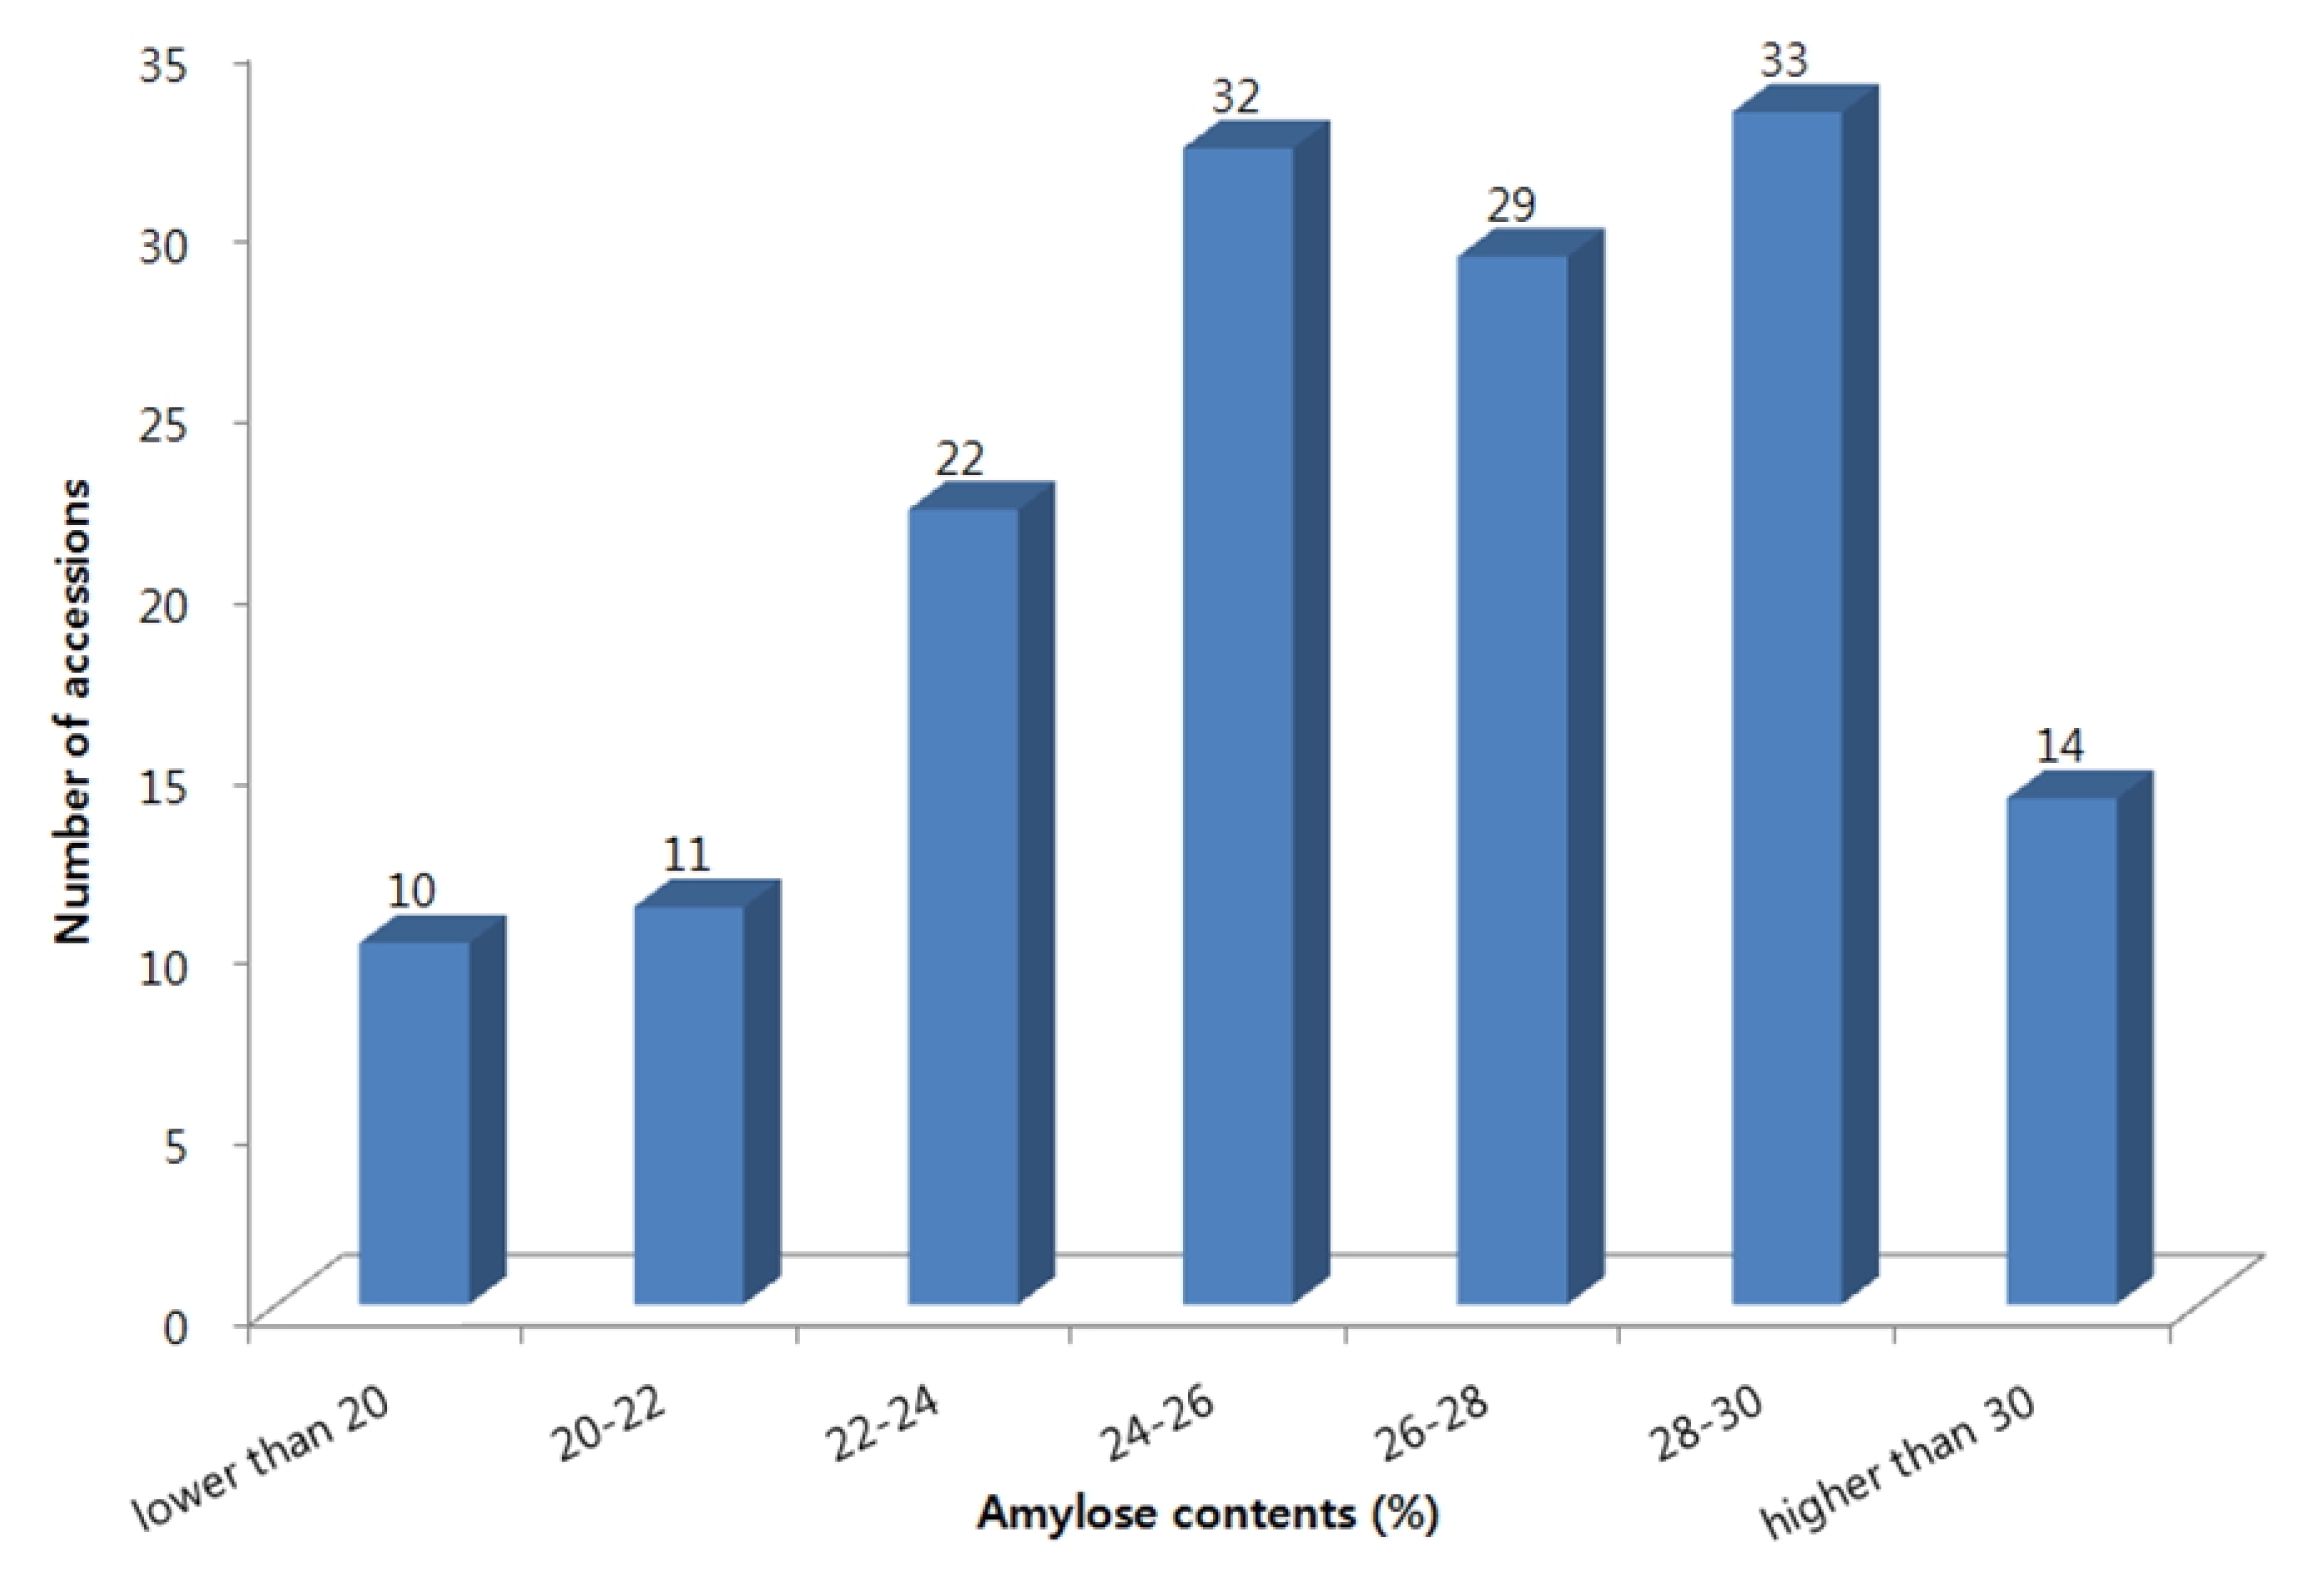
Table 1Country of origin of 239 candidate rice accessions selected for amylose content higher than 30% using an NIR spectrum and a standard curve.
Table 1
|
Country of origin |
No. of accessions |
Country of origin |
No. of accessions |
|
China |
67 |
Italy, Indonesia, Japan, Vietnam |
4 |
|
Philippines |
23 |
Nepal |
3 |
|
Korea |
17 |
Afghanistan, Bangladesh, Guyana, Nigeria |
2 |
|
India |
10 |
Bhutan, Columbia, Sri Lanka, Mexico, North Korea, Russia, Thailand, USA |
1 |
|
Taiwan |
10 |
|
Pakistan |
8 |
Unidentified |
69 |
Table 2Some agronomic traits of 14 selected rice accessions with amylose content above 30% cultivated at Yesan, Chungcheongnam-do and transplanted on 2 June 2008.
Table 2
|
z)IT1
|
Origin2
|
HD3
|
CL4
|
PL5
|
NP6
|
AC7
|
PC8
|
GZ9
|
GS10
|
|
117317 |
CHN |
1 Aug. |
111±5.15 |
19.5±1.52 |
11±2.52 |
35.6±1.27 |
Transparent |
Medium |
Round |
|
112407 |
PHL |
15 Aug. |
84±4.35 |
31.0±2.02 |
17±3.25 |
34.7±0.73 |
Transparent |
Medium |
Slender |
|
112394 |
PHL |
20 Aug. |
70±4.22 |
23.8±1.75 |
14±2.50 |
32.6±1.27 |
Brown |
Medium |
Slender |
|
001189 |
PAK |
4 Aug. |
108±5.10 |
22.3±1.70 |
7±1.75 |
31.3±0.73 |
Brown |
Medium |
Round |
|
001133 |
PAK |
2 Aug. |
124±6.45 |
25.0±1.95 |
11±2.04 |
30.9±0.73 |
Brown |
Medium |
Round |
|
207615 |
PHL |
16 Aug. |
103±4.55 |
25.5±1.96 |
9±2.05 |
30.9±0.73 |
Transparent |
Medium |
Slender |
|
006083 |
TWN |
5 Aug. |
97±4.55 |
26.0±1.85 |
10±2.10 |
30.9±0.73 |
Brown |
Medium |
Slender |
|
006734 |
TWN |
12 Aug |
126±5.65 |
24.5±1.74 |
12±2.25 |
30.9±1.27 |
Transparent |
Medium |
Round |
|
007735 |
TWN |
30 Aug. |
73±4.56 |
25.0±1.75 |
9±1.75 |
30.9±1.27 |
Transparent |
Medium |
Slender |
|
001134 |
PAK |
4 Aug. |
109±5.46 |
24.3±1.82 |
9±2.05 |
30.5±0.73 |
Brown |
Medium |
Round |
|
173402 |
PHL |
11 Aug. |
69±3.26 |
24.0±1.90 |
17±3.24 |
30.5±0.73 |
Transparent |
Medium |
Slender |
|
001878 |
PHL |
18 Aug. |
64±3.75 |
24.0±1.85 |
12±2.20 |
30.1±1.27 |
Transparent |
Medium |
Round |
|
001910 |
PHL |
18 Aug. |
64±4.25 |
29.5±2.04 |
13±2.25 |
30.1±0.73 |
Transparent |
Medium |
Slender |
|
114783 |
CHN |
20 Aug. |
100±5.55 |
28.5±2.05 |
7±1.80 |
30.1±0.73 |
Brown |
Medium |
Slender |
References
- Abrams SM, Shenk JS, Westerhaus MO, Barton FE. 1987. Determination of forage quality by near infrared reflectance spectroscopy: efficiency of broad-based calibration equations. J Diary Sci. 70: 806-813.
- Clarke MA, Arias ER, McDonald-Lewis C. 1992. Near Infra-red Analysis in the Sugarcane Factory. Sugar y Azucar Press at Ruspam Communications Inc.. Cresskill, NJ, USA.
- Demirkesen I, Sumnu G, Sahin S. 2013. Image analysis of gluten-free breads prepared with chestnut and rice flour and baked in different ovens. Food Bioprocess Technol. 6: 1749-1758.
- Juliano BO. 1971. A simplified assay for milled-rice amylose. Cereal Sci Today. 16: 334-340.
- Juliano BO. 1985. Criteria and Tests for Rice Grain Qualities: Chemistry and Technology. American Association of Cereal Chemists. Eagen, MN, USA: pp. 443-524.
- Juliano BO, et al. 1979. Proceedings of the Workshop on Chemical Aspects of Rice Grain Quality. IRRI. Los Banos, Laguna, Philippines: pp. 69-90.
- Kim JS, Cho YH, Gwag JG, Ma KH, Choi YM, Kim JB, Lee JH, Kim TS, Cho JK, Lee SY. 2008. Quantitative analysis of amylose and protein content of rice germplasm in RDA-Gene bank by near infrared reflectance spectroscopy. Korean J Crop Sci. 53(2): 217-223.
- Kwon YR, Cho SH, Song YE, Lee JH, Cho CH. 2006. Nondestructive measurement of chemical compositions in polished rice and brown rice using NIR spectra of hulled rice acquired in transmittance and reflectance modes. Korean J Crop Sci. 51(5): 451-457.
- Perez CM, Juliano BO. 1979. Indicators of eating quality for non-waxy rices. Food Chem. 4: 185-195.
- Singh N, Kaur L, Sodhi NS, Sekhon KS. 2005. Physico-chemical, cooking and textural properties of milled rice from different Indian rice cultivars. Food Chem. 89: 253-259.
- Song YC, Lim SJ, Lee JS, Kim HY, Yeo US, Park NB, Kwak DY, Kang JR, Yang SJ, Hwang HG, Oh BG, Moon HP, Lim MS. 2008. A new high amylose rice variety “Goamibyeo”. Korean J Breed Sci. 40(4): 447-451.
- Song YJ, Song YE, Oh NK, Choi YG, Cho KC. 2006. Relationship between near infrared reflectance spectra and mechanical sensory score of commercial brand rice produced in Jeonbuk. Korean J Crop Sci. 51(5): 42-46.