INTRODUCTION
Sesame (
Sesamum indicum L.) is an oilseed crop. It is cultivated on a small scale compared to open field crops due to its low net revenue. Mechanical harvesting is difficult so harvests are generally done by hand. The level of self-sufficiency in Korea is low at approximately 15% (
Kwon et al. 2011). However, sesame is one of the most popular seasonings in Korea and levels of consumption for various uses, such as sesame oil and sesame powder, have increased. Meeting the demand for sesame is dependent upon imports, mostly from China, India, and Ethiopia (
Kwon et al. 2011), but retailers often engage in deceptive labeling of imported products as domestic products. As a consequence, the importance of cultivar discrimination to distinguish imported from domestic sesame products is gaining attention. Although cultivar differentiation is needed to protect the interests of the consumers, it is often difficult due to common genetic characteristics shared by all cultivars.
Various methods of cultivar discrimination are available, and are based on the analysis of ecological, physicochemical, or molecular genetic characteristics. However, analyses based on molecular characteristics have the advantage of being independent of environmental effects or study methods, unlike ecological and physicochemical characteristics. Identification of molecular genetic characteristics between cultivars using DNA markers such as simple sequence repeats (SSR), random amplified polymorphic DNA (RAPD), etc. has been accomplished in major crops such as grape (
Lopes et al. 2006), ginseng (
Bang et al. 2011), rice (
Kwon et al. 2003;
Sun et al. 2009), sunflower (
Zhang et al. 2005), cucumber (
Bernet et al. 2003), and wheat (
Noli et al. 2008). Distinction between domestic and imported sesame germplasm was attempted using physicochemical characteristics of proteins and fatty acids in sesame (
Lee et al. 2005;
Shim et al. 2010). The use of infrared spectroscopy analysis to distinguish between sesame of Korean and Chinese origin was also studied (
Kwon et al. 1998), but no results on the use of SSR markers have been published. This study was undertaken to explore the potential utility of SSR markers in differentiating sesame cultivars originating from Korea and China.
MATERIALS AND METHODS
Plant materials
Seventy sesame accessions, including 27 accessions from China and 43 accessions from Korea, were selected for this study (Supplemental
table 1). All accessions and information on the accession were obtained from the National Agrobiodiversity Center of the Rural Development Administration (RDA) (
http://www.genebank.go.kr/), Korea.
Genomic DNA was extracted from all accessions using a QIAGEN DNA extraction kit (QIAGEN, Seoul, Republic of Korea). The relative purity and concentration of extracted DNA was estimated using a NanoDrop ND-1000 spectrophotometer (Dupont Agricultural Genomics Laboratory, NanoDrop Technologies, Wilmington, Delaware, USA). The final DNA concentration was adjusted to 20 ng/μL. Fourteen polymorphic SSR markers, including seven markers from
Dixit et al. (2005) and seven from
Jin et al. (2009), were selected (
Table 1). The sizes of the PCR products were measured using the M13-tailed PCR method of
Schuelke (2000). Amplification reactions were carried out in a total volume of 20 μL, containing 200 ng template DNA, 1× PCR buffer, 0.2 mM each dNTP, 1 U Taq DNA polymerase, 8 pmol each of reverse and fluorescent-labeled M13 (−21) primer, and 2 pmol forward primer with the M13 (−21) tail at its 5′ end. PCR amplification was conducted by heating at 94°C for 3 min, and then completing 30 cycles at 94°C for 30 s, 55°C for 45 s, and 72°C for 1 min, followed by 10 cycles at 94°C for 30 s, 53°C for 45 s, and 72°C for 1 min, and a final extension at 72°C for 10 min. SSR alleles were resolved on a ABI 3130xl Genetic Analyzer (Applied Biosystems, Foster City, CA, USA) using GeneScan 3.7 software (Applied Biosystems, Foster City, CA, USA) and sized precisely using GeneScan 500 ROX internal size standards. The individual fragments were assigned as alleles of the appropriate microsatellite loci with GeneMapper 4.0 software (Applied Biosystems, Foster City, CA, USA).
Basic statistics were calculated using PowerMarker V3.23 software (
Liu and Muse 2005) for diversity measurements at each microsatellite locus, including the total number of alleles (N
A), observed and expected heterozygosity (H
O and H
E), and polymorphism information content (PIC). The specific alleles for each marker were determined using GenAlEx 6.5 software (
Peakall and Smouse 2012). Genetic distances between each pair of accessions were measured by calculating the shared allele frequencies using PowerMarker V3.23. The unweighted pair group method with an arithmetic mean (UPGMA) tree was constructed using the MEGA 4.0 program, which is embedded in PowerMarker, with the unweighted pair group method and the arithmetic averages (UPGMA) algorithm (
Tamura et al. 2007).
RESULTS
This study focused on discriminating between sesame cultivars originating from Korea and China. The genetic diversity of 70 accessions from Korea and China was presented in
Table 2. Eighty-eight alleles were identified. The number of alleles (N
A) per marker ranged from 2 (GBssr-sa-083) to 13 (GBssr-sa-182), with an average of 6.3. The smallest variation in alleles was 2 bp for the GBssr-sa-083 marker and the largest variation was 106 bp for the GBssr-sa-058 marker. The major allele frequency (M
AF) for different markers ranged from 0.35 (GBssr-sa-108) to 0.84 (GBssr-sa-083), with an average of 0.57. Heterozygosity (H
O) values ranged from 0 (GBssr-sa-083) to 0.25 (GBssr-sa-108), with an average of 0.1 and expected heterozygosity (H
E) values ranged from 0.26 (GBssr-sa-083) to 0.79 (GBssr-sa-108), with an average of 0.56. Polymorphic information content (PIC), which represents the genetic diversity of the markers used for analysis, ranged from 0.23 (GBssr-sa-083) to 0.77 (GBssr-sa-108), with an average of 0.51 (
Table 2).
Alleles specific for each country of origin were analyzed. Twenty-eight Korea-specific alleles were detected for ten SSR markers. The number of specific alleles per marker ranged from one (GBssr-sa-164) to nine (GBssr-sa-182), with an average of 2.8. Fifteen China-specific alleles were detected for seven SSR markers. The number of specific alleles per marker ranged from one (GBssr-sa-135) to four (GBssr-sa-123), with an average of 2.1. For the accessions originating from Korea, the N
A per locus was widely variable among the markers ranging from two (GBssr-sa-034 and GBssr-sa-083) to 13 (GBssr-sa-182), with an average N
A per locus of 5.1. H
O values ranged from zero (GBssr-sa-034, GBssr-sa-083, and GBssr-sa-123) to 0.26 (GBssr-sa-108), with an average of 0.1. H
E values ranged from 0.09 (GBssr-sa-034) to 0.86 (GBssr-sa-182), with an average of 0.51. PIC values ranged from 0.09 (GBssr-sa-034) to 0.85 (GBssr-sa-182), with an average of 0.47. For the accessions originating from China, the N
A per locus varied widely among the markers ranging from two (GBssr-sa-034, GBssr-sa-164 and GBssr-sa-178) to eight (GBssr-sa-108), with an average of 4.3. H
O values ranged from 0 (GBssr-sa-083, GBssr-sa-164, and GBssr-sa-178) to 0.27 (GBssr-sa-135 and GBssr-sa-184), with an average of 0.12. H
E values ranged from 0.34 (GBssr-sa-182) to 0.80 (GBssr-sa-108), with an average of 0.54. PIC values ranged from 0.32 (GBssr-sa-182) to 0.77 (GBssr-sa-108), with an average of 0.48 (
Table 3).
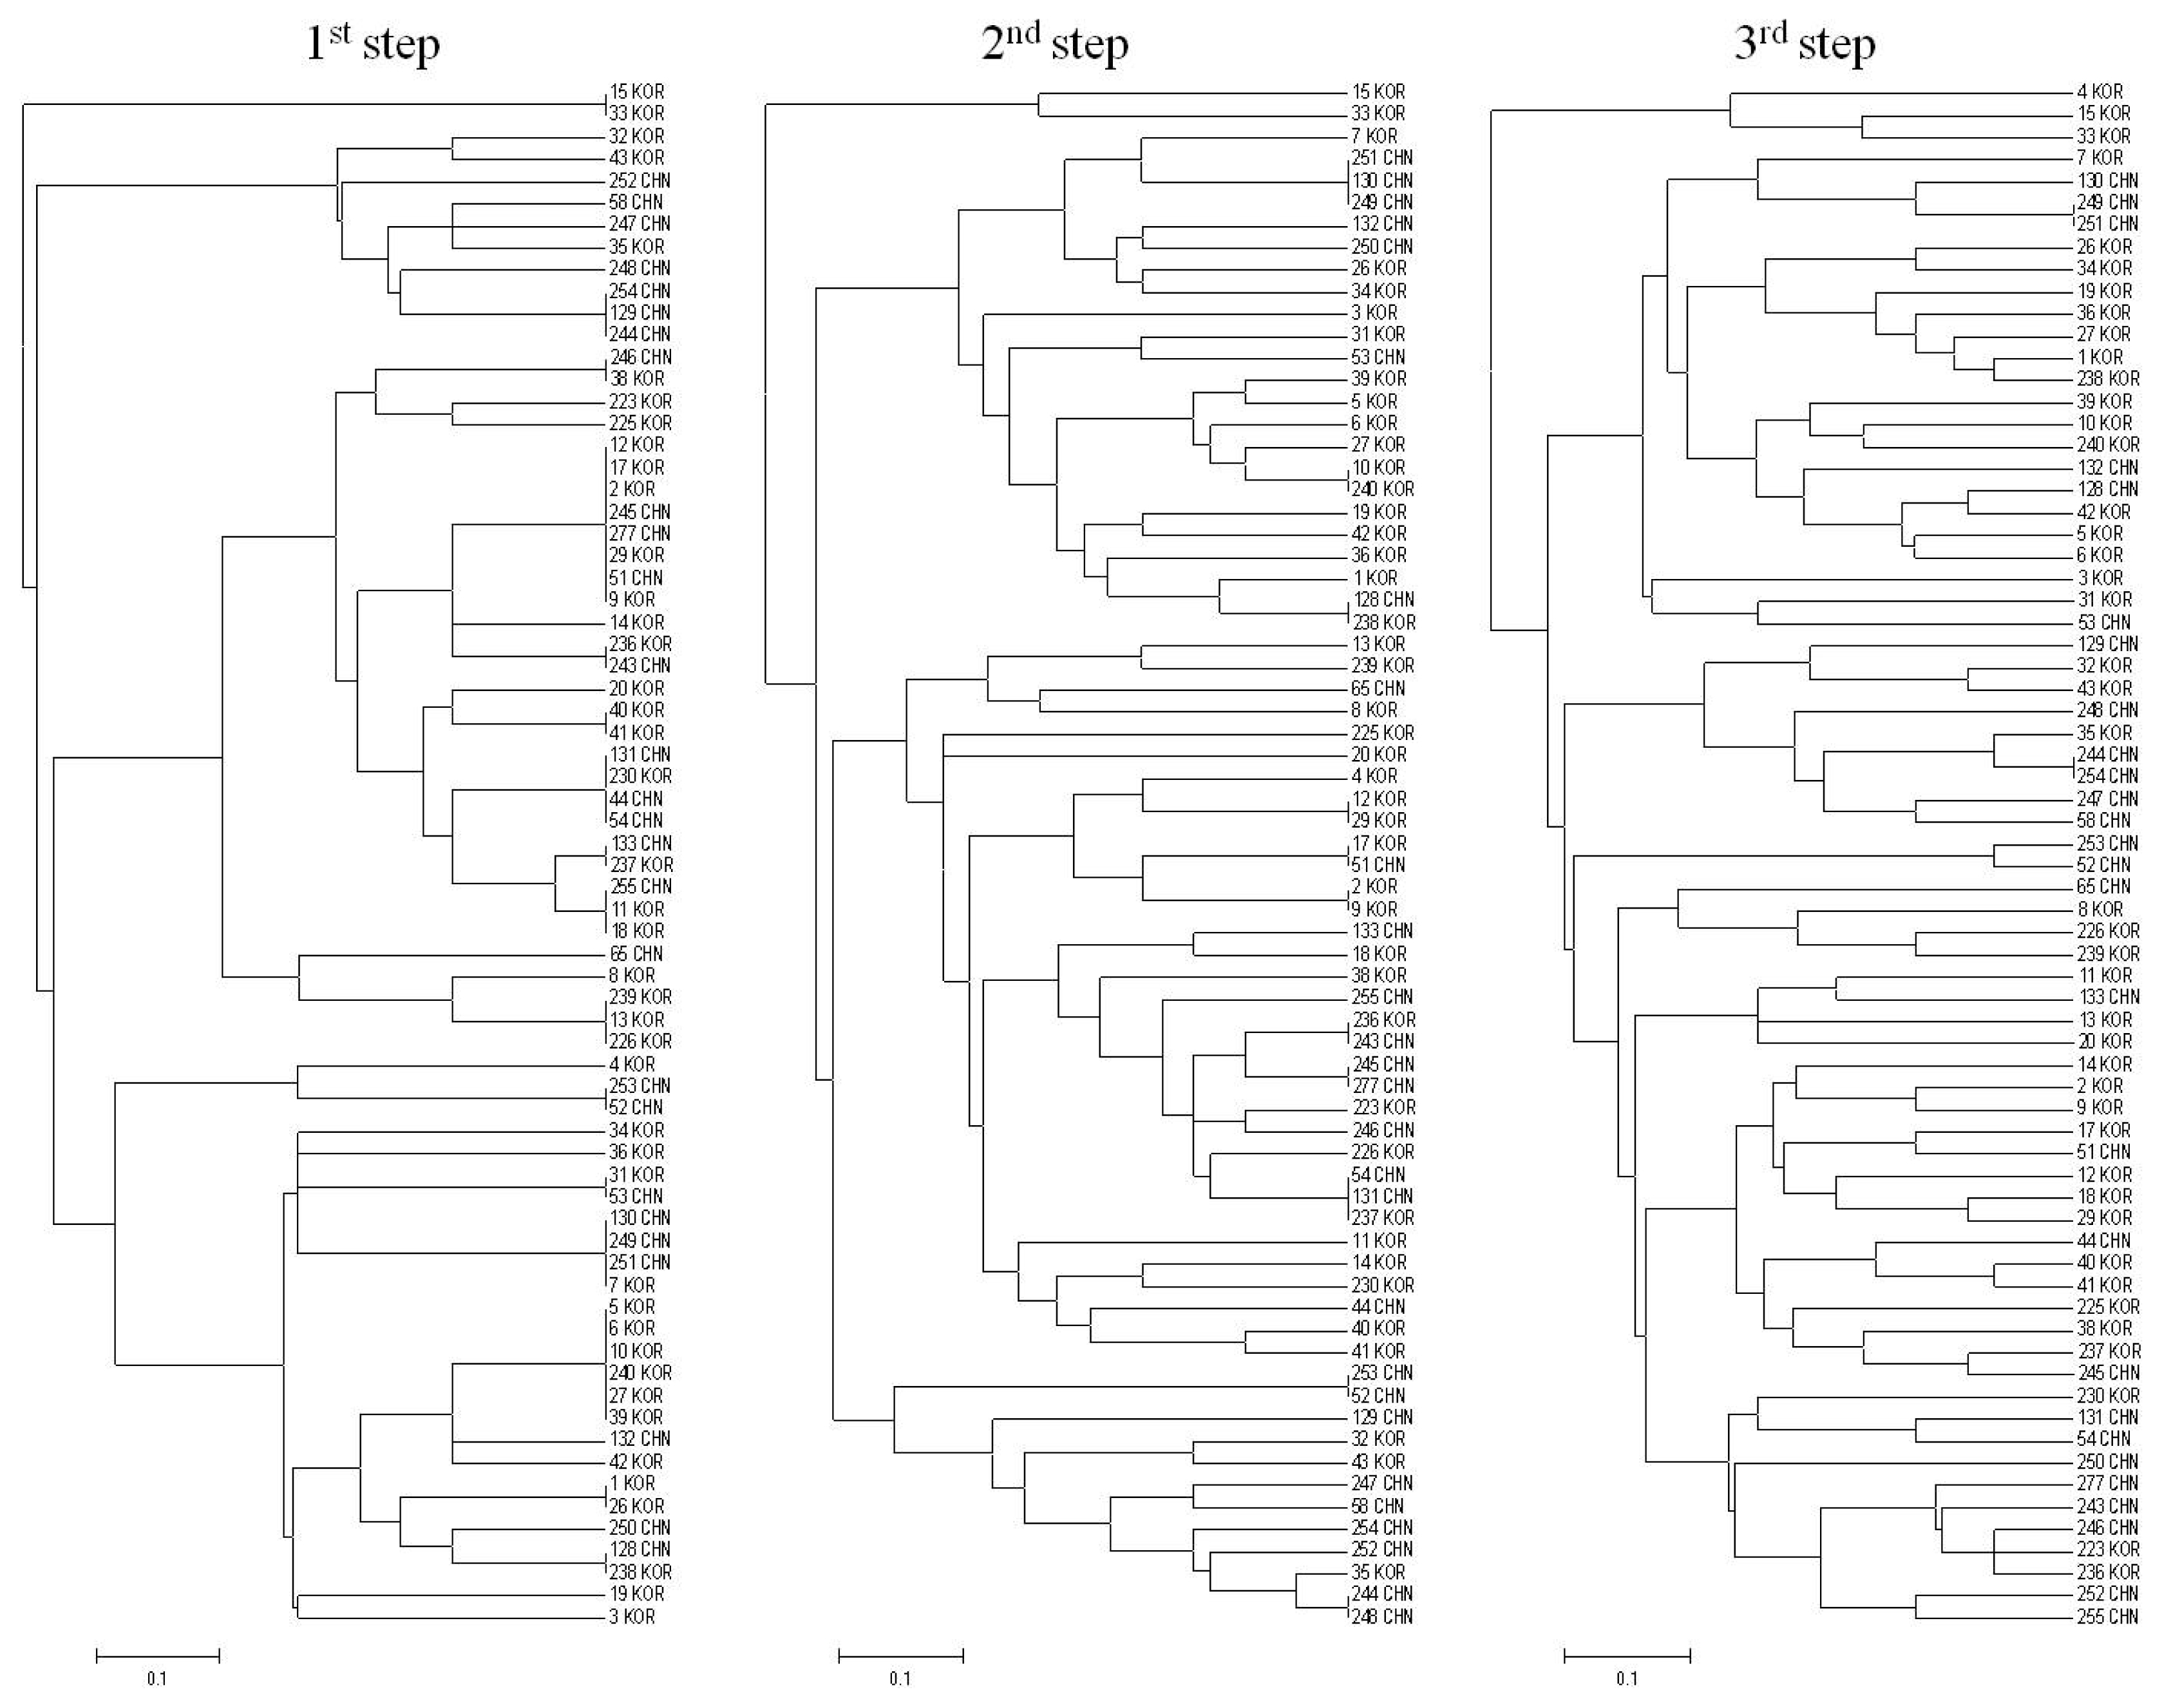
To establish a method to discriminate between Korean and Chinese accessions, four SSR markers, GBssr-sa-5, GBssr-sa-182, GBssr-sa-108, and GBssr-sa-184, were selected as candidate markers. A series of three dendrograms was generated by sequential addition of the markers to the analysis. The sequential addition of markers progressively resolved ambiguities in the dendrograms generated in the previous steps of the analysis (
Fig. 1).
In the first step of analysis, we used the GBssr-sa-5 and GBssr-sa-182 markers in combination. Twenty-one distinct accessions were identified, of which 14 accessions were from Korea and seven accessions were from China (
Table 4). The remaining 49 accessions grouped into 12 classes based on their genotypes (
Fig. 1, left). Addition of the GBssr-sa-108 marker in the second step of analysis identified an additional 25 distinct accessions, of which 19 were from Korea and six were from China (
Fig. 1, middle). Addition of the GBssr-sa-184 marker in the third step of analysis identified 20 additional distinct accessions, ten of which were from Korea and nine were from China (
Fig. 1, right). The remaining four Chinese accessions (‘254’, ‘244’, ‘249’ and ‘251’) could not be differentiated from each other using the same set of markers (
Table 4).
DISCUSSION
In this study, we assessed the diversity of 70 accessions of Korean and Chinese origin using 14 SSR markers. A total of 88 alleles were observed and the NA for accessions ranged from 2 to 13 with an average of 6.3 alleles. The major allele frequency per locus, PIC values, HO values, and HE values were relatively high.
Similarly,
Park et al. (2013) reported that the allelic richness per locus varied widely among markers with 3 to 25 alleles per marker and an average 11.3 alleles per marker. The M
AF per locus and PIC, H
O, and H
E values were relatively high, indicating a high level of genetic diversity. Although sesame is self-pollinating, some authors have reported levels of outcrossing of about 5–60% (
Yermanos 1980;
Pathirana 1994). Outcrossing plant species tend to account for 10–20% of the genetic variation between populations (
Hamrick and Godt 1989). Hence, outcrossing among neighboring fields may explain the high genetic variation.
In this study, alleles specific for each country were identified. Twenty-eight Korea-specific alleles were detected for ten SSR markers. The number of specific alleles ranged from one to nine with an average of 2.8. Fifteen China-specific alleles were detected for seven SSR markers. The number of specific alleles ranged from one to four with an average of 2.1. Likewise,
Park et al. (2013) reported that 41 genotype-specific alleles were identified for 12 of 14 SSR markers. A maximum of eight specific alleles were detected.
Although our molecular analysis method involved only few number of SSR markers, yet it was found to be highly efficient in differentiating 70 sesame accessions, making it economical and feasible.
Sun et al. (2009) used seven SSR markers to study genetic diversity and discriminate among 67 recently distributed rice accessions and
Lopes et al. (2006) used 11 SSR markers to discriminate among 46 Portuguese grapevine accessions.
In our study, the first step in the analysis distinguished 21 individual accessions using two markers (GBssr-sa-005 and GBssr-sa-182) in combination. The second step identified an additional 25 accessions with the addition of one SSR marker (GBssr-sa-108) to the analysis. The third step identified 20 more accessions with the addition of the GBssr-sa-184 marker. Only four Chinese accessions (‘254’ and ‘244’, ‘249’ and ‘251’) remained that were not discriminated from each other. Forty-three accessions from Korea and 23 accessions from China were successfully distinguished from each other using just four of 14 SSR markers, providing a simple approach for discriminating between Korean and Chinese sesame accessions.
Piña-Escutia et al. (2010) used 10-, 15-, or 20-base primers to discriminate between nine varieties of
Tigridia pavonia (L.f.) DC in Mexico. The authors found that a long primer (20 bases) generated a similar dendrogram to those constructed using shorter primers, with the exception of a single variety whose placement shifted as a result of using a longer primer. Thus, a longer primer was able to show greater differentiation of the varieties evaluated, as also reported by
Solouki et al. (2007 2008). This previous study also demonstrates the power of discrimination based on molecular characteristics rather than phenotypes. An approach based on morphological identification was also applied to nine varieties of
T.
pavonia (
Vázquez-García et al. 2001), but this method was not reliable due to environmental effects on phenotypes. A biochemical characterization of the same nine varieties was performed using isozymes, however, this approach failed to discriminate two pairs of similar varieties. The low discriminating power of isozymes may be due to inadequate genome coverage. In addition, such markers can be influenced by environmental factors and differences in levels of expression can confuse the interpretation of results. In contrast to these phenotypic approaches, RAPD markers provide a rapid screening method with more precise discriminatory power that is independent of environmental factors (
Solouki et al. 2008).
In conclusion, the method we developed using four SSR markers can be used to discriminate accessions by origin such as those from Korea and China, to verify seed purity, and to protect intellectual property rights. Furthermore, the four SSR markers used in this study could possibly be used to discriminate imported and domestic sesame accessions.
ACKNOWLEDGMENT
This study was carried out with the support of the ‘Research Program for Agricultural Science & Technology Development (Project No. PJ008623)’, National Academy of Agricultural Science, RDA, Republic of Korea.
Fig. 1Diagrammatic representation of cultivar discrimination by phylogenetic trees for 70 sesame accessions at each round of analysis using four SSR markers.

Table 1Fourteen SSR markers used in this study.
Table 1
|
Marker |
Sequence (5′–3′) |
GenBank Acc. No. |
TM (°C) |
|
GBssr-sa-005 |
F: TCATATATATAAAAGGAGCCCAAC
R: GAAGAAGAGAGAAGCGATGAC |
AY838904 |
55 |
|
GBssr-sa-008 |
F: GGAGAAATTTTCAGAGAGAAAAA
R: ATTGCTCTGCCTACAAATAAAA |
AY838905 |
57 |
|
GBssr-sa-034 |
F: CAATTCCACGTCAGTGCT
R: GGAAGCCGGTCATAATCTA |
AY838910 |
57 |
|
GBssr-sa-040 |
F: AAAGCCATGGAAAACGGT
R: GACCCGTTAACTCCGACC |
AY838911 |
57 |
|
GBssr-sa-058 |
F: CCGTGTTCAACTCGTGTTTT
R: ATCAGGCTGCCTCTTTCG |
AY838912 |
57 |
|
GBssr-sa-072 |
F: GCAGCAGTTCCGTTCTTG
R: AGTGCTGAATTTAGTCTGCATAG |
AY838913 |
57 |
|
GBssr-sa-083 |
F: AAGAAACGCCATGGACAG
R: AGCCCACTTTCCCTCCTT |
AY838914 |
57 |
|
GBssr-sa-108 |
F: CCACTCAAAATTTTCACTAAGAA
R: TCGTCTTCCTCTCTCCCC |
AY838915 |
61 |
|
GBssr-sa-123 |
F: GCAAACACATGCATCCCT
R: GCCCTGATGATAAAGCCA |
AY838916 |
61 |
|
GBssr-sa-135 |
F: GCTGAGGAGTCTTGAAGCAG
R: CGATATCACCATCACCCC |
AY838917 |
57 |
|
GBssr-sa-164 |
F: GGATCCCAATCCTCCATTTA
R: TGAGATATTGGCTCCCAGAG |
AY838918 |
57 |
|
GBssr-sa-178 |
F: TCCACAAAGGACCACACC
R: TGGCCTTGAAACCTCTTCT |
AY838920 |
57 |
|
GBssr-sa-182 |
F: CCATTGAAAACTGCACACAA
R: TCCACACACAGAGAGCCC |
AY838921 |
55 |
|
GBssr-sa-184 |
F: TCTTGCAATGGGGATCAG
R: CGAACTATAGATAATCACTTGGAA |
AY838922 |
55 |
Table 2Summary of statistics for 14 SSR markers in 70 sesame accessions.
Table 2
|
Marker |
SA
|
MAF
|
NA
|
HO
|
HE
|
PIC |
|
GBssr-sa-005 |
142–160 |
0.44 |
7 |
0.06 |
0.69 |
0.64 |
|
GBssr-sa-008 |
124–150 |
0.40 |
10 |
0.11 |
0.69 |
0.64 |
|
GBssr-sa-034 |
280–290 |
0.83 |
2 |
0.07 |
0.28 |
0.24 |
|
GBssr-sa-040 |
182–190 |
0.62 |
5 |
0.05 |
0.57 |
0.53 |
|
GBssr-sa-058 |
221–327 |
0.55 |
5 |
0.19 |
0.57 |
0.49 |
|
GBssr-sa-072 |
272–332 |
0.79 |
6 |
0.09 |
0.35 |
0.32 |
|
GBssr-sa-083 |
299–301 |
0.84 |
2 |
0.00 |
0.26 |
0.23 |
|
GBssr-sa-108 |
172–208 |
0.35 |
10 |
0.25 |
0.79 |
0.77 |
|
GBssr-sa-123 |
250–276 |
0.46 |
9 |
0.07 |
0.66 |
0.60 |
|
GBssr-sa-135 |
200–226 |
0.68 |
4 |
0.22 |
0.48 |
0.43 |
|
GBssr-sa-164 |
255–261 |
0.66 |
3 |
0.03 |
0.46 |
0.37 |
|
GBssr-sa-178 |
207–223 |
0.60 |
4 |
0.02 |
0.50 |
0.39 |
|
GBssr-sa-182 |
205–253 |
0.43 |
13 |
0.18 |
0.76 |
0.74 |
|
GBssr-sa-184 |
124–178 |
0.37 |
8 |
0.14 |
0.76 |
0.72 |
|
|
Mean |
|
0.57 |
6.3 |
0.1 |
0.56 |
0.51 |
Table 3Summary of statistics for 14 SSR markers for accessions from Korea (KOR) and China (CHN).
Table 3
|
Marker |
NA
|
HO
|
HE
|
PIC |
NSA
|
|
|
|
|
|
|
KOR |
CHN |
KOR |
CHN |
KOR |
CHN |
KOR |
CHN |
KOR |
CHN |
|
GBssr-sa-005 |
5 |
5 |
0.07 |
0.04 |
0.64 |
0.72 |
0.58 |
0.67 |
2 (142, 144) |
2 (158, 160) |
|
GBssr-sa-008 |
9 |
5 |
0.13 |
0.09 |
0.71 |
0.43 |
0.68 |
0.40 |
5 (124, 140, 144, 148, 150) |
1 (136) |
|
GBssr-sa-034 |
2 |
2 |
0.00 |
0.19 |
0.09 |
0.46 |
0.09 |
0.36 |
|
|
|
GBssr-sa-040 |
4 |
5 |
0.06 |
0.04 |
0.28 |
0.68 |
0.27 |
0.62 |
|
|
|
GBssr-sa-058 |
5 |
3 |
0.19 |
0.18 |
0.58 |
0.53 |
0.51 |
0.43 |
2 (225, 327) |
|
|
GBssr-sa-072 |
4 |
4 |
0.11 |
0.05 |
0.34 |
0.37 |
0.30 |
0.35 |
2 (312, 332) |
2 (284, 288) |
|
GBssr-sa-083 |
2 |
2 |
0.00 |
0.00 |
0.13 |
0.42 |
0.12 |
0.33 |
|
|
|
GBssr-sa-108 |
8 |
8 |
0.26 |
0.23 |
0.77 |
0.80 |
0.74 |
0.77 |
2 (194, 200) |
2 (172, 208) |
|
GBssr-sa-123 |
5 |
7 |
0.00 |
0.19 |
0.64 |
0.60 |
0.58 |
0.57 |
2 (260, 268) |
4 (250, 270, 272, 276) |
|
GBssr-sa-135 |
3 |
4 |
0.19 |
0.27 |
0.48 |
0.49 |
0.42 |
0.45 |
|
1 (202) |
|
GBssr-sa-164 |
3 |
2 |
0.05 |
0.00 |
0.43 |
0.49 |
0.35 |
0.37 |
1 (261) |
|
|
GBssr-sa-178 |
4 |
2 |
0.02 |
0.00 |
0.46 |
0.50 |
0.39 |
0.37 |
2 (211, 223) |
|
|
GBssr-sa-182 |
13 |
4 |
0.24 |
0.08 |
0.86 |
0.34 |
0.85 |
0.32 |
9 (207, 213, 231, 241, 243, 245, 247, 251, 253) |
|
|
GBssr-sa-184 |
5 |
7 |
0.07 |
0.27 |
0.70 |
0.79 |
0.66 |
0.75 |
1 (124) |
3 (154, 168, 172) |
|
|
Mean |
5.1 |
4.3 |
0.10 |
0.12 |
0.51 |
0.54 |
0.47 |
0.48 |
2.8 |
2.1 |
Table 4Sequential discrimination using four SSR markers.
Table 4
|
Step |
Marker combination |
No. of accessions |
Code |
|
1 |
GBssr-sa-005, GBssr-sa-182 |
21 |
58_CHN, 65_CHN, 132_CHN,247_CHN, 248_CHN, 250_CHN, 252_CHN, 3_KOR, 4_KOR, 8_KOR, 14_KOR, 19_KOR,20_KOR, 32_KOR, 34_KOR, 35_KOR, 36_KOR, 42_KOR, 43_KOR,223_KOR, 225_KOR |
|
2 |
GBssr-sa-005, GBssr-sa-182, GBssr-sa-108 |
25 |
44_CHN, 53_CHN, 129_CHN, 133_CHN, 246_CHN, 255_CHN, 1_KOR, 5_KOR, 6_KOR, 7_KOR, 11_KOR, 13_KOR, 15_KOR, 18_KOR, 26_KOR, 27_KOR, 31_KOR, 33_KOR, 38_KOR, 39_KOR, 40_KOR, 41_KOR, 226_KOR, 230_KOR, 239_KOR |
|
3 |
GBssr-sa-005, GBssr-sa-182, GBssr-sa-108, GBssr-sa-184 |
20 |
51_CHN, 52_CHN, 54_CHN, 128_CHN, 130_CHN, 131_CHN, 243_CHN, 245_CHN, 253_CHN, 277_CHN, 2_KOR, 9_KOR, 10_KOR, 12_KOR, 17_KOR, 29_KOR, 236_KOR, 237_KOR, 238_KOR, 240_KOR |
|
Non-discriminated accessions |
4 |
244_CHN, 254_CHN, 249_CHN, 251_CHN |
References
- Bang KH, Jo IH, Chung JW, Kim YC, Lee JW, Seo AY, Park JH, Kim OT, Hyun DY, Kim DH, Cha SW. 2011. Analysis of genetic polymorphism of Korean ginseng cultivars and foreign accessions using SSR markers. Korean J Med Crop Sci. 19: 347-353.
- Bernet GP, Bramardi S, Calvache D, Carbonell EA, Asins MJ. 2003. Applicability of molecular markers in the context of protection of new varieties of cucumber. Plant Breed. 122: 146-152.
- Dixit A, Jin MH, Chung JW, Yu JW, Chung HK, Ma KH, Park YJ, Cho EG. 2005. Development of polymorphic microsatellite markers in sesame (Sesamum indicum L.). Mol Ecol Notes. 5: 736-738.
- Hamrick JL, Godt MJW. 1989. Allozyme diversity in plants. pp. 43-63. Brown AHD, Clegg MT, Kahler AL, Weir BS, editors. Plant population genetics, breeding and germplasm resources. Sunderland, MA: Sinauer.
- Jin MH, Lee JR, Yu JW, Chung JW, Ma KH, Dixit A, Kim DH, Paek NC, Cho EG, Park YJ. 2009. Development and characterization of microsatellite markers for utilization in diversity analysis of sesame (Sesamum indicum L.) germplasm collection. Konkuk J Sci Environ. 31: 1-10.
- Kwon SJ, Ahn SN, Yang CI, Hong HC, Kim YK, Suh JP, Hwang HG, Moon HP, Choi HC. 2003. Genetic diversity in Korean japonica rice cultivars. Korean J Breed Sci. 31: 268-275.
- Kwon SK, Kim TS. 2011. A study on the improvement of domestic distribution and sales system in imported sesame. Korean J Food Nutr. 33-59.
- Kwon YK, Cho RK. 1998. Identification of geographical origin of sesame seeds by near infrared spectroscopy. Agric Chem Biotechnol. 41: 240-246.
- Lee MJ, Kim KH. 2005. The comparison in the physicochemical properties of sesame seeds by producing areas. J Korean Soc App Biol Chem. 48: 128-131.
- Liu KJ, Muse SV. 2005. PowerMarker: an integrated analysis environment for genetic marker analysis. Bioinformatics. 21: 2128-2129.
- Lopes MS, Santos MR, Dias JE, Mendonça D, da Câmara Machado A. 2006. Discrimination of Portuguese grapevines based on microsatellite markers. J Biotechnol. 127: 34-44.
- Noli E, Teriaca MS, Sanguineti MC, Conti S. 2008. Utilization of SSR and AFLP markers for the assessment of distinctness in durum wheat. Mol Breed. 22: 301-313.
- Park JH, Suresh S, Cho GT, Choi NG, Baek HJ, Lee CW, Chung JW. 2013. Assessment of molecular genetic diversity and population structure of sesame (Sesamum indicum L.) core collection accessions using simple sequence repeat markers. Plant Genet Resour Charact Util. 1-8.
- Pathirana R. 1994. Natural cross-pollination in sesame (Sesamum indicum L.). Plant Breed. 112: 167-170.
- Peakall R, Smouse PE. 2012. GenAlEx 6.5: genetic analysis in Excel. Population genetic software for teaching and research - an update. Bioinformatics. 28: 2537-2539.
- Piña-Escutia JL, Vázquez-García LM, Arzate-Fernández AM. 2010. Variety discrimination of Tigridia pavonia (L.f.) DC. assessed by different length RAPD primers. Elect J Biotechnol. 13: 1-7.
- Schuelke M. 2000. An economic method for the fluorescent labeling of PCR fragments. Nature Biotechnol. 18: 233-234.
- Shim KB, Hwang CD, Pae SB, Lee MH, Ha TJ, Park CH, Park KY. 2010. Comparison of physiochemical characters of sesame seeds according to the different producing origin. J Korean Soc Int Agric. 22: 371-375.
- Solouki M, Mehdikhani H, Zeinali H, Emamjomeh AA. 2008. Study of genetic diversity in Chamomile (Matricaria chamomilla) based on morphological traits and molecular markers. Sci Hortic. 117: 281-287.
- Solouki M, Nazhad NR, Vignani R, Siahsar BA, Kamaladini H, Emamjomeh A. 2007. Polymorphism of some native sistan grapes assessed by long and short primers for RAPD markers. Pak J Biol Sci. 15: 1996-2001.
- Sun MM, Choi KJ, Kim HS, Song BH, Woo SH, Lee CW, Jong SK, Cho YG. 2009. Genetic diversity and discrimination of recently distributed rice varieties in Korea by SSR markers. Korean J Breed Sci. 41: 164-125.
- Tamura K, Dudley J, Nei M, Kumar S. 2007. MEGA4: molecular evolutionary genetics analysis (MEGA) software version 4.0. Mol Biol Evol. 24: 1596-1599.
- Vazquez-Garcia L, Przybyla AA, De-La-Cruz-Torres E, Torres-Navarro H, Rodriguez G. 2001. Morphological description of nine botanical varieties of Tigridia pavonia L.F. Ker Gawl J App Bot. 75: 14-19.
- Yermanos DM. 1980. Sesame. Fehr WR, Hadley HH, editors. Hybridization of Crop Plants. pp. 549-563. Madison WI: American Society of Agronomy and Crop Science Society of America.
- Zhang LS, Le Clerc V, Li S, Zhang D. 2005. Establishment of an effective set of simple sequence repeat markers for sunflower variety identification and diversity assessment. Canadian J Bot. 83: 66-72.