Abstract
Drought is one of the most important abiotic factors affecting wheat production and development of tolerant genotypes is limited by the lack of effective selection criteria. A genetic analysis of drought tolerance indices at seedling stage (i.e. root length, shoot length, root/shoot ratio and seedling dry weight) was performed for a seven-parent half diallel cross of bread wheat (Triticum aestivum L.) in Egypt. The parents and their F2 progenies were evaluated in the laboratory under osmotic stress induced by polyethylene glycol (PEG) with five treatments (i.e. 0, 5, 10, 15 and 20% PEG-6000). Grain yield per spike was also evaluated under drought stressed field conditions. The parent P7 had maximum root and shoot lengths under stress conditions, highest root/shoot ratio under 20% PEG and higher grain yield per spike than the other parents suggesting that P7 possessed stress tolerance genes. Grain yield/spike was significantly correlated with root length (r= 0.41, P<0.05) and seedling dry weight (r= 0.46, P<0.05) at 15% PEG. Both additive and non-additive gene effects were involved in the genetic control of all traits. Rather low to moderately narrow-sense heritability was obtained for root length (0.18 and 0.12) and shoot length (0.19 and 0.12) at 15 and 20% PEG, respectively; root/shoot ratio (0.15) and seedling dry weight (0.16) at 15% PEG. Moderate genetic advance was observed for root length (41.24%) and shoot length (29.96%) under stress conditions suggesting that selection could be practiced on both traits for improving drought tolerance in wheat breeding programs.
-
Key words: Bread wheat, Diallel analysis, Drought tolerance, Polyethylene glycol (PEG), Seedling traits
INTRODUCTION
Water deficit more than other abiotic stresses limits the growth and productivity of crop plants including wheat (
Datta et al. 2011;
Saint Pierre et al. 2012). Drought due to insufficient soil water supply frequently occur concurrently with high temperature at the end of wheat growing season in the regions of the world with Mediterranean climate like Egypt. Of specific importance to crop plants is not whether they survive stress, but whether they show good yields under stress conditions (
Bhargava and Sawant 2013). Thus, there is a dire need to select wheat genotypes that can withstand water stress (
Khan et al. 2010).
Breeding for drought tolerance is further complicated since several types of abiotic stresses such as high temperatures, high irradiance, and nutrient toxicities or deficiencies can challenge crop plants simultaneously (
Fleury et al. 2010). Generally, it is agreed that drought tolerance from a breeding viewpoint is a complex trait that shows a high level of genotype × environment interaction (
Cooper et al. 2006).
Plant responses to drought are also influenced by the time, intensity, duration, and frequency of the stress as well as by diverse plant–soil–atmosphere interactions (
Saint Pierre et al. 2012). Moreover, development of tolerant wheat cultivars is hampered by the lack of effective selection criteria (
Sio-Se Mardeh et al. 2006;
Talebi 2011). Thus, a research program for increasing drought tolerance of wheat should tackle the problem in a multi-disciplinary approach, considering interaction between multiple stresses and plant phenology, and integrating the physiological dissection of drought-tolerance traits and the genetic and genomics tools, such as quantitative trait loci (QTL), microarrays, and transgenic crops (
Fleury et al. 2010).
Moderate to high heritability estimates for seedling traits under both normal and stress conditions were reported by
Dhanda et al. (2004) which were, in general, lower under osmotic stress than under normal conditions. High estimates of broad-sense heritability were also obtained in rice for different seedling traits under normal and water stress conditions (
Hosseini et al. 2012). Heritability estimates are useful in indicating the relative merit of selection based on phenotypic expression of different characters. Moreover, heritability values along with estimates of genetic advance are more useful than heritability alone in predicting the effect of selection (
Johnson et al. 1955).
Information on the genetic structure of a set of parents and the mode of gene action controlling highly related traits to drought tolerance makes breeding programs for drought tolerance much more effective and successful (
Badieh et al. 2012).The diallel analyses developed by
Hayman (1954a;
1954b;
1958;
1960),
Jinks (1954),
Mather and Jinks (1971) provide detailed information concerning the genetic systems and gene action involved in the expression of important traits available in breeding materials. Thus, the main objectives of the present study were to analyze the genetic control of drought tolerance indices at seedling stage in bread wheat in order to identify the most effective criteria, and to relate the findings to designing proper breeding strategy for drought stress tolerance in wheat.
MATERIALS AND METHODS
Plant materials and PEG treatments
The plant material used in the present study comprised seven F
8 lines which represented the outcome of three cycles of divergent phenotypic selection for gain yield applied to four populations of bread wheat (
Triticum aestivum L.) grown under drought stress conditions. The four initial F
2 populations were established from crosses between eight landraces chosen from germplasm collected from farmers’ fields in dry remote areas in Upper Egypt in 1993 and maintained since then at the Department of Genetics, Faculty of Agriculture, Assiut University in Egypt where each was characterized by a drought susceptibility index. Names and description of the eight landraces and the four initial crosses from which the four base F
2 populations were derived is given in
Table 1. The seven selected advanced F
8 lines, quite variable in their performance under dry field conditions, were crossed in a diallel pattern without reciprocals to produce the hybrids. F
1 progenies were allowed to self pollinate at the field to produce F
2 populations. The seven parents and their 21 F
2s were used to study the inheritance of drought tolerance indices at seedling stage in a laboratory experiment at the Department of Genetics in 2012. Seeds of each genotype were disinfected by immersion in sodium hypochlorite for 5 min, then washed three times with distilled water and allowed to germinate in aluminum trays of 25 cm wide × 50 cm long × 6 cm deep, which were filled with sterilized sand. Drought stress was simulated by the addition of PEG-6000 at concentrations of 0, 5, 10, 15 and 20% (w/v) to the soil. For the control treatment distilled water was used. The experiment was conducted in a randomized complete block design with three replicates in a growth chamber under dark conditions for the first three days. Seedlings were harvested on the 10
th day and separated from the remaining seeds. Growth parameters at seedling stage, namely root length (cm), shoot length (cm), root/shoot ratio and seedling dry weight (g) were measured on 15 plants for each parent and 30 plants for each F
2 population in each replicate. Seedling dry weight (g) was measured after drying samples at 70°C for 72 h in an oven.
A field experiment was conducted on the diallel cross for the genetic analysis of grain yield per spike under dry field conditions at El-Ghorieb Experimental Station located in the eastern desert 25 km south of Assuit with calcareous soil. The experiment was set up in a randomized complete block design with three replicates. Each replicate consisted of two rows for each parent and three rows for each F2 population by a 10–plant row with rows spaced 50 cm apart and plants within rows set 30 cm from each other. Irrigation was applied each two weeks with a total number of five irrigations throughout the growing season (after the establishment irrigation). At the maturity stage, thirty spikes of each genotype were hand harvested randomly from each replicate. Grain yield per spike (g) was then obtained in order to directly determine the mean performance of a genotype excluding any effect of number of tillers on the yield.
Statistical and biometrical analyses
Significance of differences among means was compared by using Least Significant Difference (LSD) test. To test for the significance of differences among Genotypes, PEG treatments and Treatments × Genotypes items for seedling traits, data of the parents and their F
2s were statistically analyzed using a combined analysis of variance across treatments. Genotypes were partitioned into parents, crosses and parents vs. crosses items. The expected genetic advance (GA) was calculated for each trait by the formula given by
Allard (1960). The diallel analysis was performed only for seedling traits under 15 and 20% PEG and for grain yield per spike by the method developed by
Hayman (1954a;
1954b) and
Mather and Jinks (1971) using computer software “DIAL98” developed by
Ukai (2006). The Hayman analysis of variance was carried out following
Jones (1965) modification for diallel without reciprocal. The validity of assumptions for a diallel analysis was tested by the regression coefficient of Wr (covariance) on Vr (variance). The slop and position of the regression line fitted to the array points within the limiting parabola indicated the degree of dominance and the presence or absence of gene interaction. The genetic and environmental components of variation were calculated as outlined by
Mather and Jinks (1971) and were then used to estimate broad (
h2b) and narrow-sense (
h2n) heritability. Correlation coefficients were estimated only among different seedling traits at 15 and 20% PEG as well as grain yield per spike.
RESULTS
Performance of wheat genotypes
The means of the seven parents and their 21 F
2 progenies for seedling traits and grain yield per spike are presented in
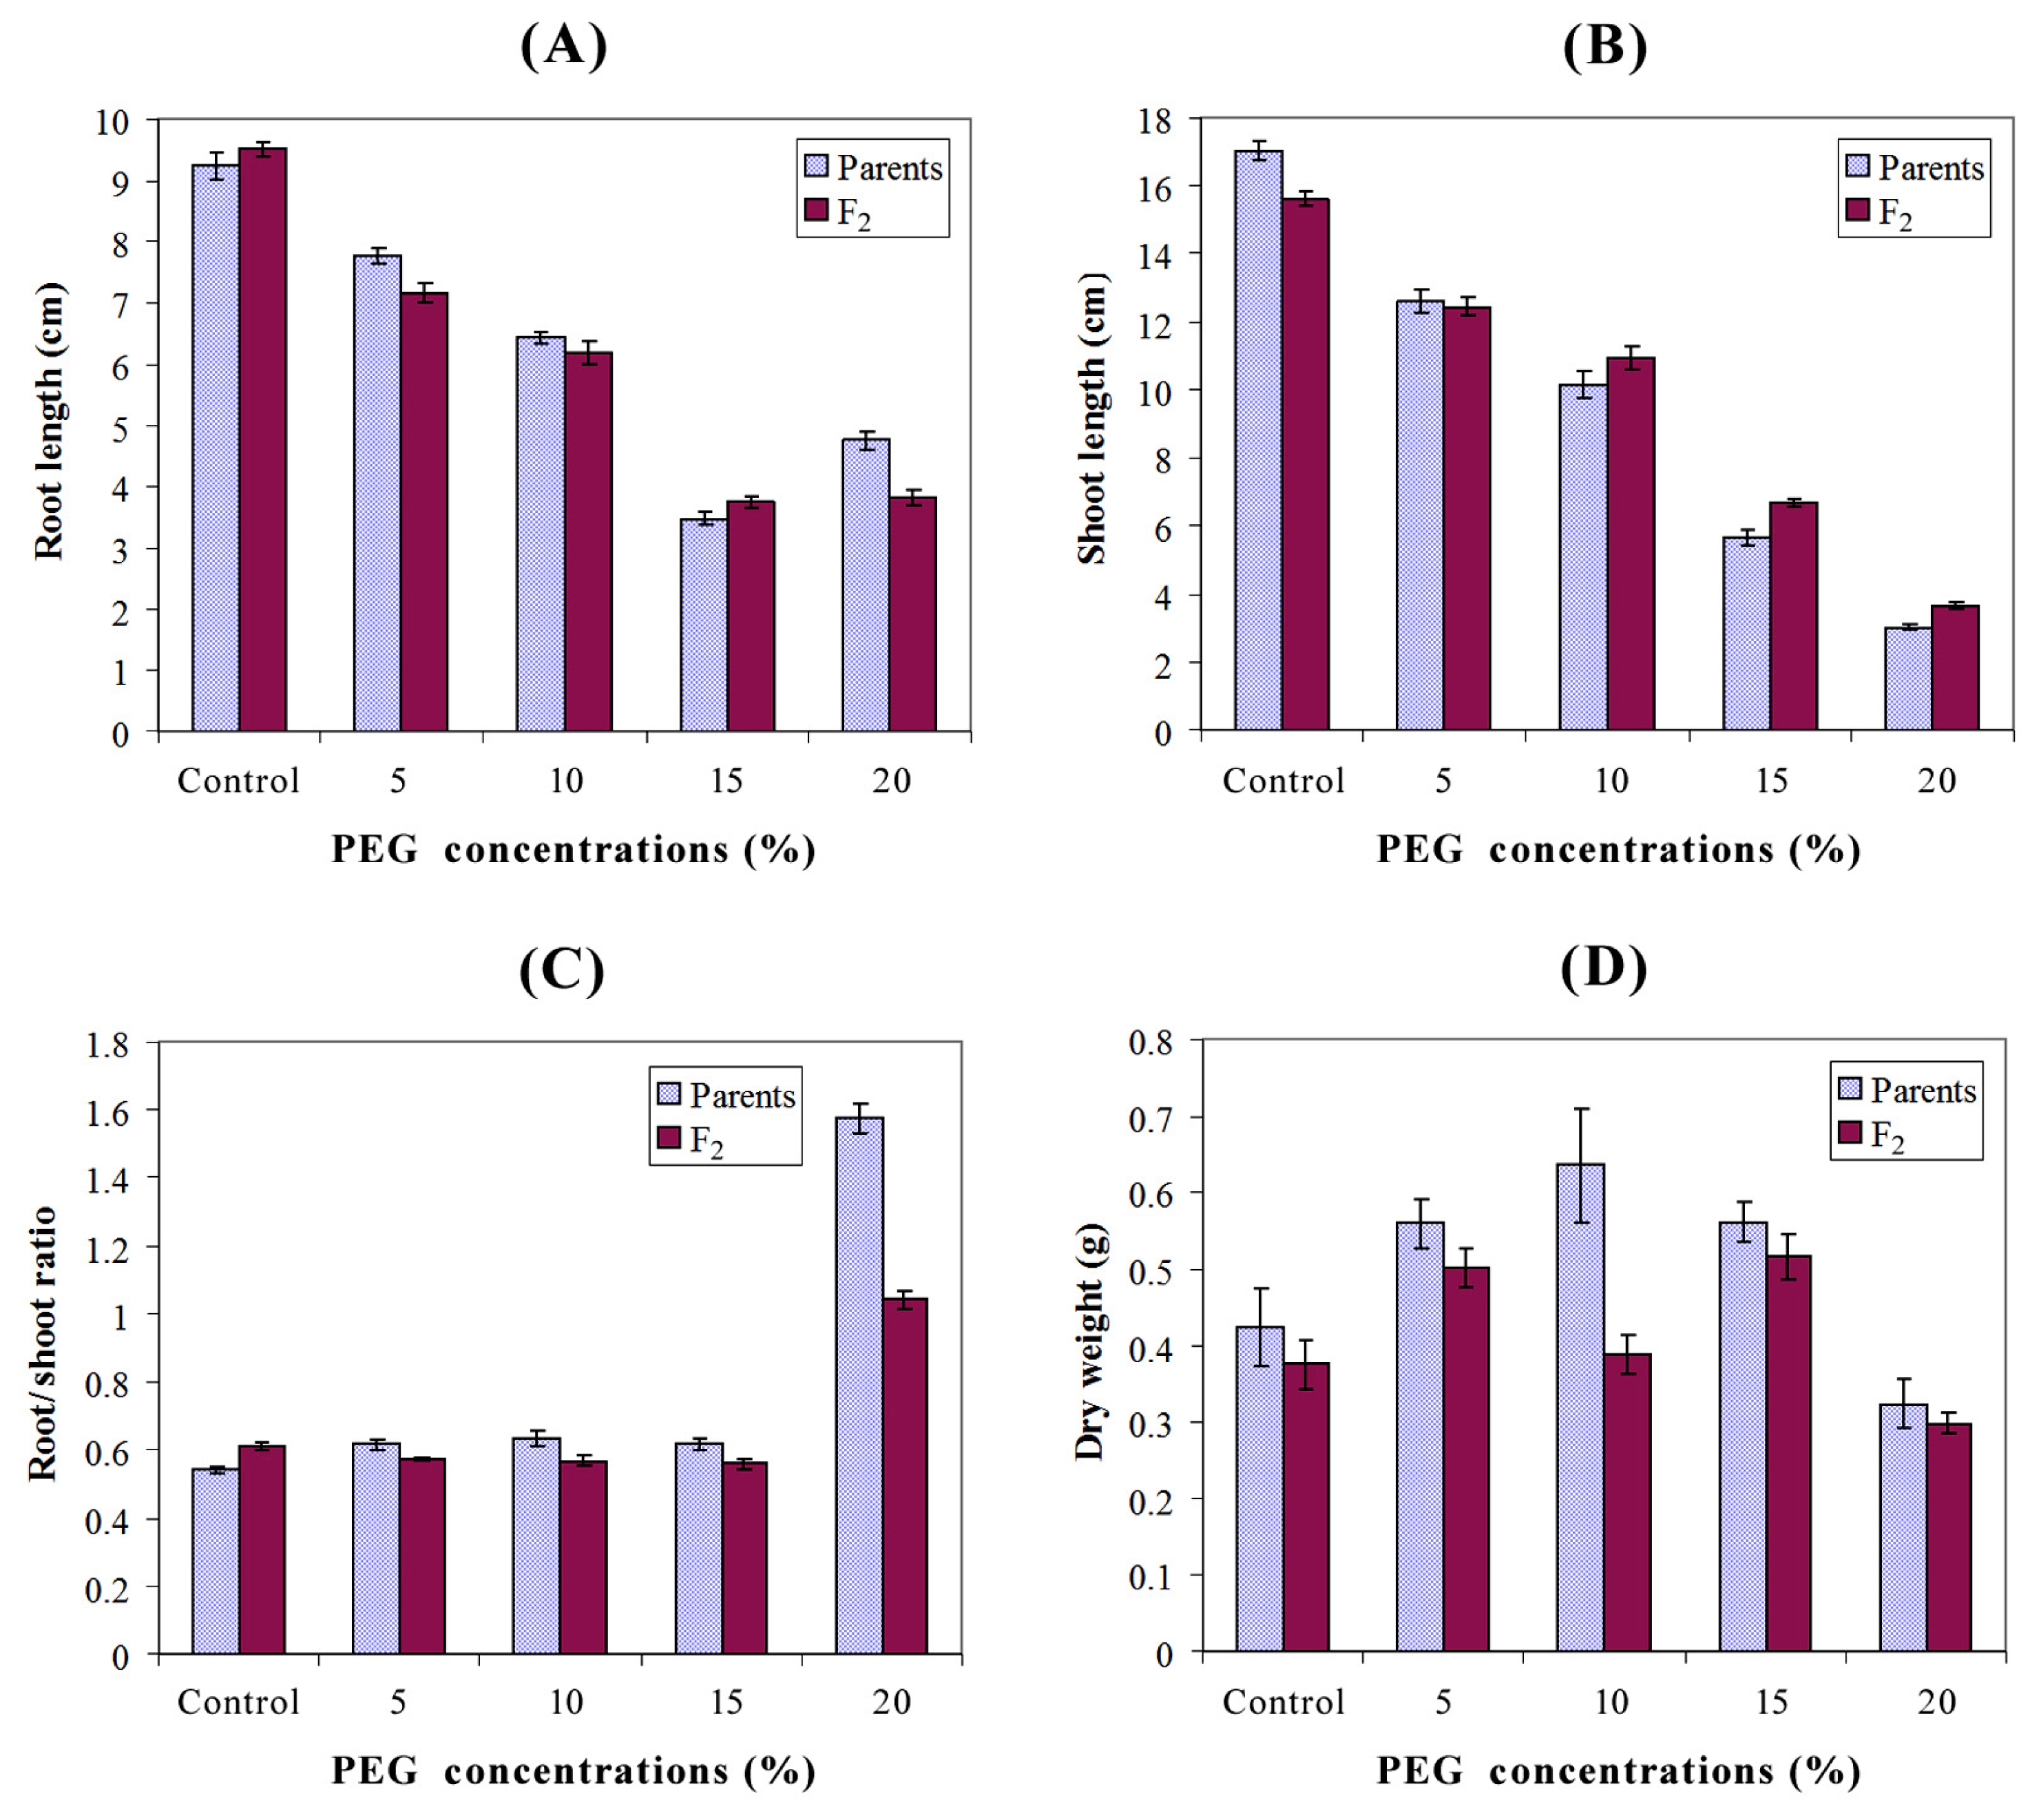
Table 2. Relative to the control, increasing PEG concentration steadily reduced root and shoot length. However, treatment with 20% PEG increased root length relative to the 15% concentration. The highest values of root/shoot ratio were recorded at 20% PEG whereas the lowest ratios were observed under control, 5, 10, and 15% PEG. Different genotypes responded differentially for seedling dry weight under different PEG concentrations (
Fig. 1). The maximum root length (10 cm) and shoot length (18.44 cm) were recorded under control in the parent P
3 whereas the least root length (3.18 cm) and shoot length (2.60 cm) were found in P
4 under 15 and 20% PEG, respectively. The highest dry weight of seedling (0.95 g) was observed in P
5 under 10% PEG, while the minimum dry weight (0.18 g) was found in P
2 in which 20% PEG was applied. Although, the parent P
7 had the shortest root length under control (8.62 cm); it showed maximum root length (8.36, 6.87, 4.05 and 5.24 cm) under stress conditions (5, 10, 15 and 20% PEG, respectively). The parent P
7 also showed maximum values of shoot length (14.14, 11.50 and 6.71 cm) under 5, 10 and 15% PEG, respectively. The highest value of root/shoot ratio (1.74) was observed in P
7 under 20% PEG, and its grain yield per spike (2.71 g) was also higher than the remaining parents. Obviously, the F
2 population of P
6 × P
7 had the maximum root length (10.8 and 8.06 cm) under control and 10% PEG, respectively; and it also showed the highest values of shoot length (4.53 cm), root/shoot ratio (0.74) and seedling dry weight (0.56 g) under 20% PEG, control and 10% PEG, respectively. The highest grain yield per spike (2.51 g) was observed also in P
6 × P
7 population. Mean values of P
6 × P
7 population were higher than its respective parents for root length, shoot length and root/shoot ratio in case of 10, 20% PEG and control, respectively. Similarly, the P
1 × P
7 population showed maximum shoot length (16.82 cm) under control and highest values of dry weight (0.64 and 0.39 g) under control and 20% PEG, respectively (
Table 2).
The combined analysis of variance (
Table 3) revealed highly significant differences (
P<0.01) among genotypes, parents, crosses and parents vs. crosses. This provides evidence for the presence of genetic variability for these traits and this variability could be transmitted to the progeny consequently. Thus, validating genetic analysis of the traits using Hayman’s method for diallel analysis. Mean squares due to PEG concentrations and Treatment × Genotype interaction items were also highly significant (
P<0.01) for all the traits studied.
Hayman analysis of variance (
Table 4) revealed highly significant additive and non-additive (epistasis and/or dominance) effects for root and shoot length under 15 and 20% PEG as indicated by the significance of “a” and “b” variance components. Highly significant “a” and “b” variance components were observed in root/shoot ratio only under 20% PEG whereas at 15% PEG, only the “b” component was found to be highly significant. For seedling dry weight, the “a” and “b” variance components were highly significant only at 15% PEG, while the “b” component of variance only was highly significant at 20% PEG. Highly significant “a” and “b” variance components were also observed in grain yield per spike under dry field conditions. Significant “b
1”, “b
2” and “b
3” variance components were observed in the investigated traits in most cases, indicating that the non-additive effect (b) were predominantly due to a directional dominance (b
1), asymmetrical distribution of genes affecting the trait at loci showing dominance (b
2), and a residual dominance effects (b
3) due to specific combination and/or epistasis.
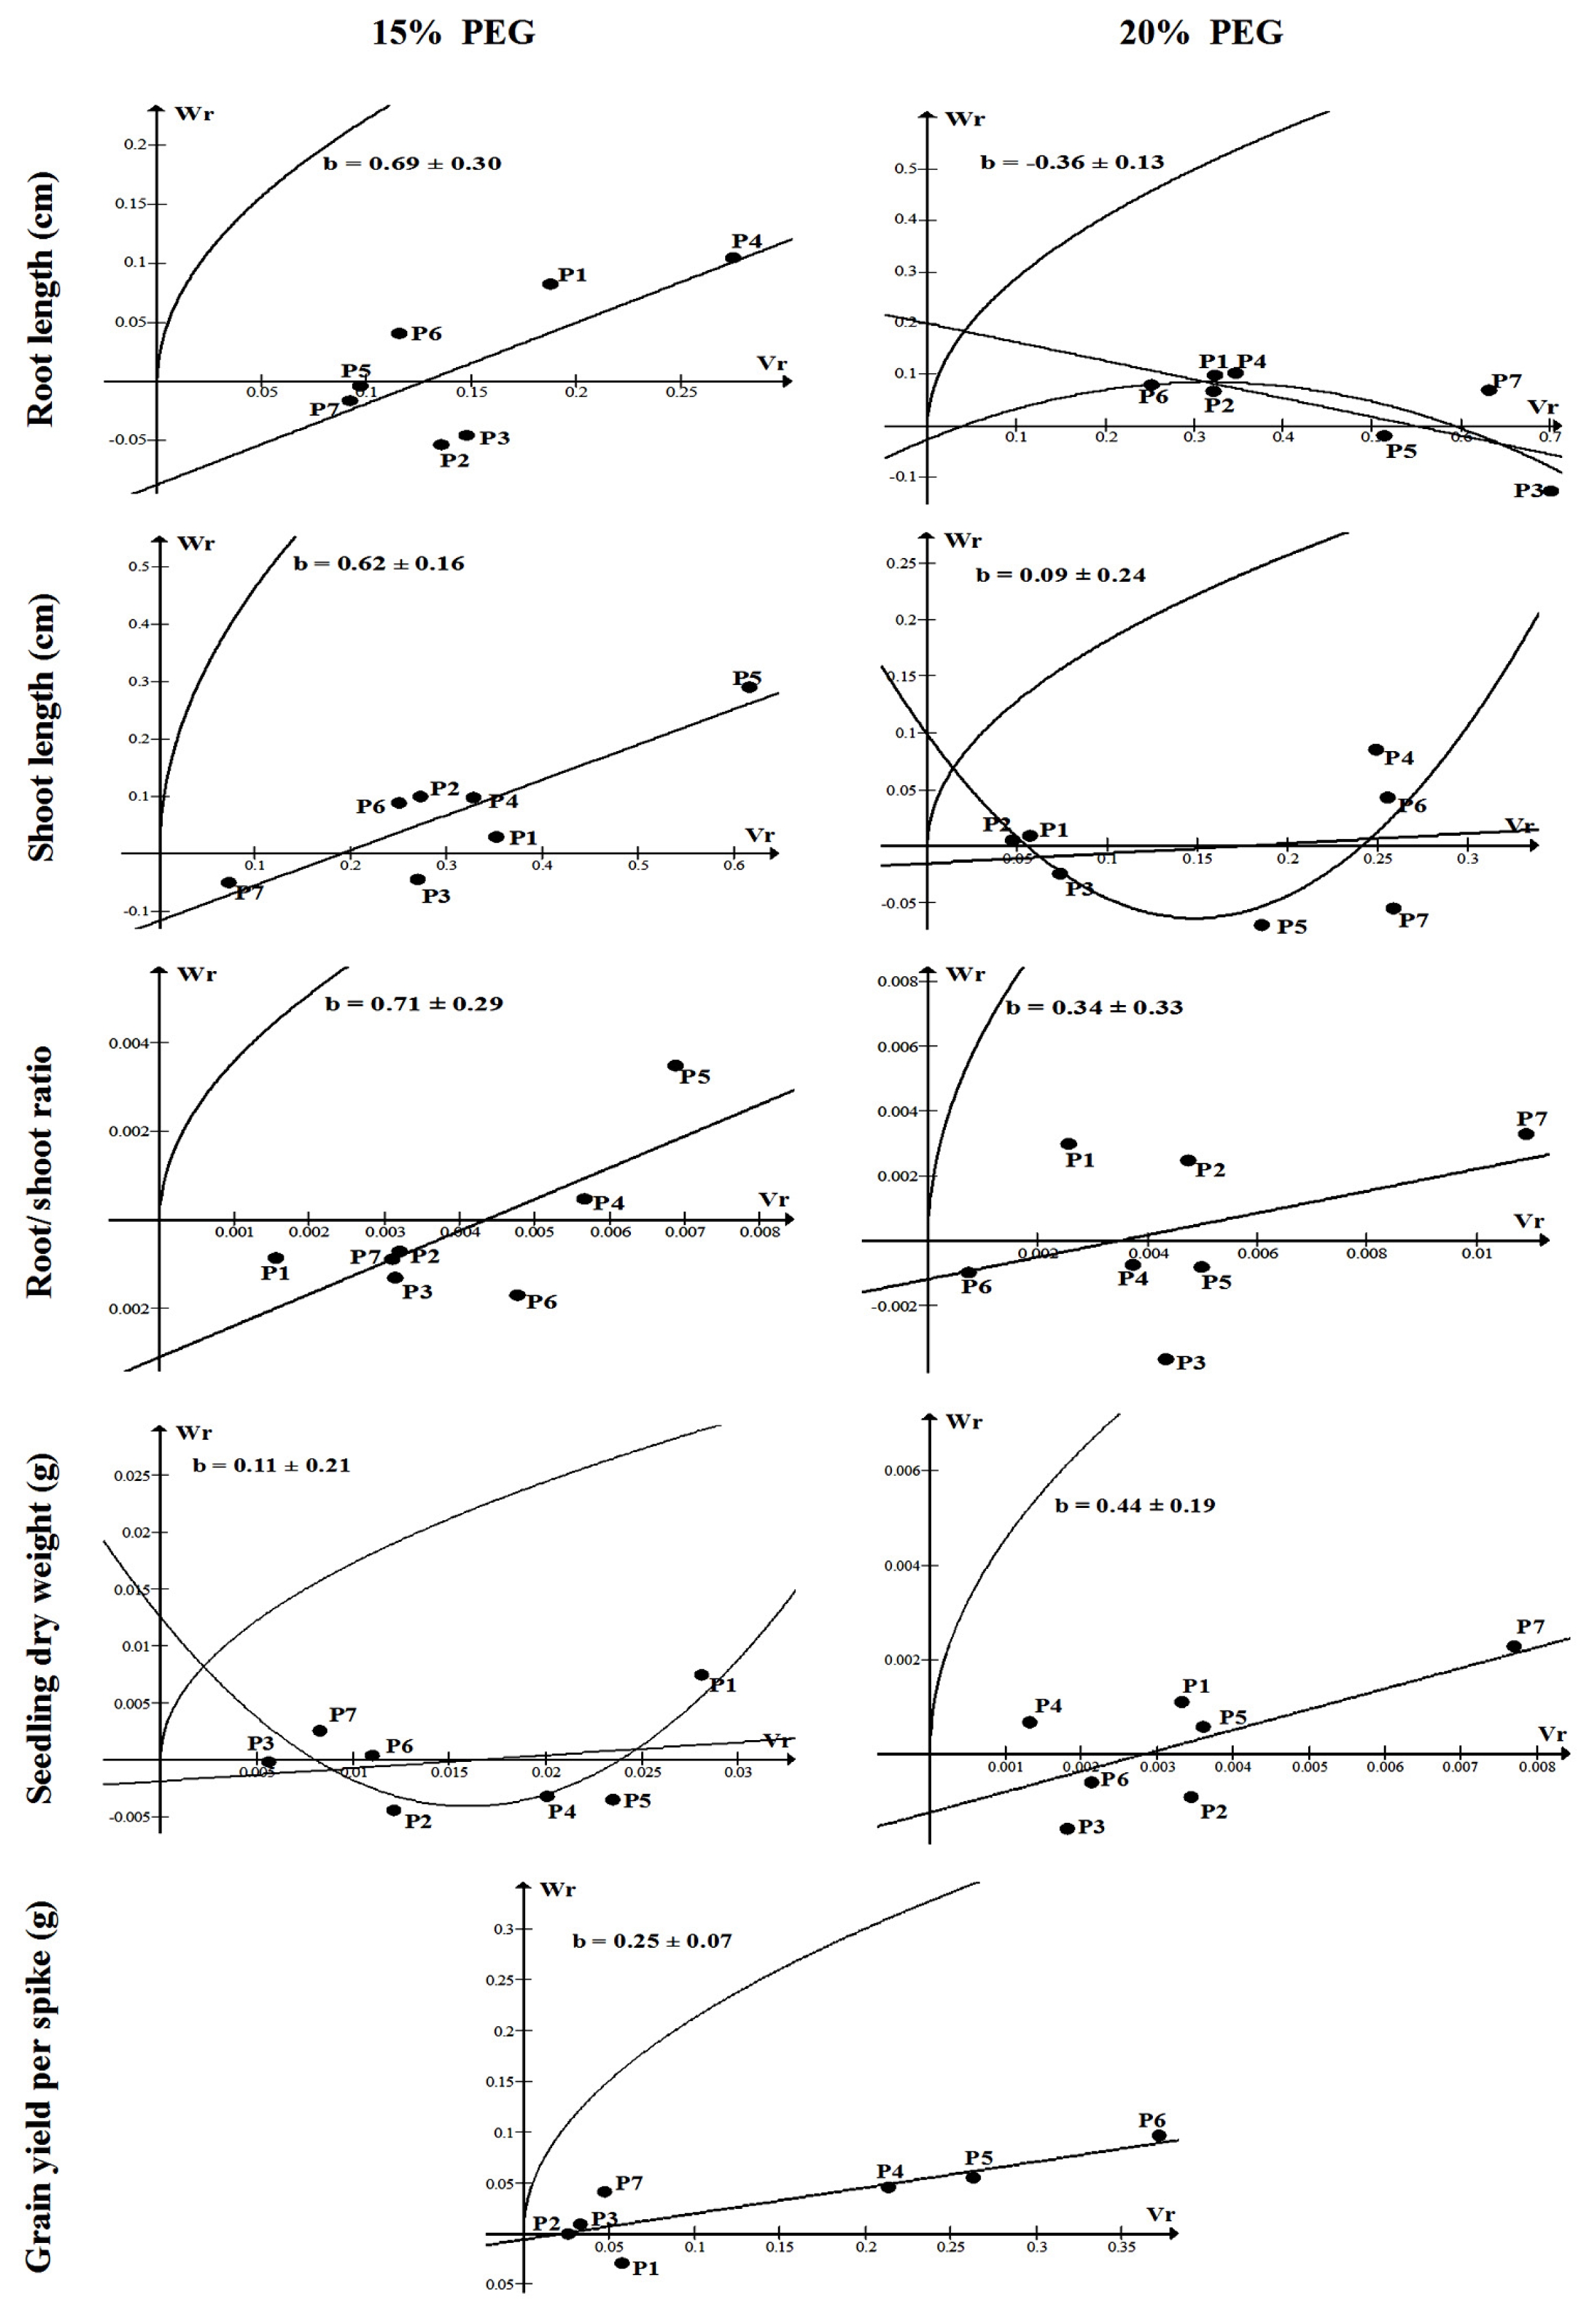
The Wr/Vr relationships for seedling traits under 15 and 20% PEG as well as for grain yield per spike are illustrated graphically in
Fig. 2. Among all seedling traits, the regression coefficient was significantly different from zero only for shoot length under 15% PEG supporting the adequacy of a simple additive-dominance genetic model and absence of non-allelic gene interaction. Non-significant regression coefficients were observed for the remaining cases supporting the presence of non
-allelic gene interaction. The regression line for shoot length under 15% PEG seemed to intercept the Wr axis below the origin indicating overdominance. The P
5 possessed a majority of recessive alleles for shoot length whereas P
7 possessed a high proportion of dominant alleles. Regarding grain yield per spike, the Wr/Vr regression line was significantly different from zero supporting the adequacy of the data for a simple additive-dominance model without any complication of non-allelic gene interaction. The regression line closely passed through the origin indicating that this trait exhibited complete dominance. The parents P
1, P
2, P
3 and P
7 possessed a majority of dominant alleles while P
6 possessed a high proportion of recessive alleles for grain yield per spike (
Fig. 2).
The correlation coefficients between the parental order of dominance (Vr+Wr) and the parental mean (Yr) of investigated traits are presented in
Table 5. Non-significant correlation coefficients were observed in root length under 15 and 20% PEG, indicating that recessive alleles contribute to both positive and negative effects of the trait. However, the correlation coefficient was high significantly (
P<0.01) negative for shoot length under 15 and 20% PEG, indicating that recessive alleles contribute to a lower shoot length. Contrarily, a highly significant (
P<0.01) positive correlation coefficient was observed in root/shoot ratio only under 15% PEG, indicating that recessive alleles contribute to an increase in the mean of such a trait under this stress condition. Meanwhile, a non-significant correlation coefficient was observed in root/shoot ratio under 20% PEG. Similarly, non-significant correlation coefficients were observed in seedling dry weight under both stress conditions as well in grain yield per spike, indicating that recessive alleles contribute to both positive and negative effects (
Table 5).
The additive component of variance (D) was found to be highly significant (
P<0.01) only in root length at 20% PEG whereas significant (
P<0.05) values were observed in shoot length and root/shoot ratio under 15 and 20% PEG, respectively (
Table 6). This indicated that additive component was important in the inheritance of these traits under such conditions. Non-significant values of additive variance were observed for the remaining cases. Values of dominant component of variance (H
1 and H
2) were highly significant (
P<0.01) for all seedling traits under stress conditions except in seedling dry weight at 20% PEG was non- significant. Obviously, the magnitudes of both types of dominant variance (H
1 and H
2) were much higher than the additive component (D) in all cases indicating the importance of the dominant than the additive component of variance in the inheritance of these traits. The positive but non-significant value of F for most cases indicated almost symmetrical gene distribution with a small excess of dominant alleles in the parents. As the ratio of (H
1/D)
1/2 is greater than one in all cases (
Table 6), overdominance is involved in the inheritance of these traits.
High values of broad-sense heritability (
h2b) and low to moderate narrow-sense heritability (
h2n) were observed for all investigated traits (
Table 6). Estimates of broad-sense heritability for root length were 0.62 under 15% PEG and 0.97 when applying 20% PEG. The highest value of narrow-sense heritability (0.18) was observed in root length under 15% PEG whereas, a value of 0.12 was observed under 20% PEG. The highest broad-sense heritability (0.92) was observed in shoot length under 20% PEG whereas the lowest value (0.85) was observed under 15% PEG. Regarding root/shoot ratio, estimates of broad-sense heritability were 0.71 and 0.96 under 15 and 20% PEG, respectively. While, a low value of narrow-sense heritability (0.06) was observed in root/shoot ratio under 20% PEG and a value of 0.15 was found when applying 15% PEG. A moderate value of broad-sense heritability (0.37) was found in seedling dry weight under 20% PEG whereas a high broad-sense heritability value (0.87) was observed at 15% PEG. High broad-sense heritability (0.90) and a moderate value of narrow-sense heritability (0.41) were observed in grain yield per spike. Moderate to high values of genetic advance (41.24 and 29.96 %), as calculated from the combined ANOVA across all PEG concentrations, were observed in root and shoot length, respectively, while low genetic advance values (2.49% and 7.27%) were found in root/shoot ratio and seedling dry weight, respectively (
Table 6).
Correlation studies among different traits (
Table 7) revealed that grain yield per spike was significantly correlated (
P<0.05) with root length (r = 0.41) and seedling dry weight (r = 0.46) at 15% PEG. Root length at 15% PEG showed significant (
P<0.05) and positive correlation with shoot length at 15 and 20% PEG, while a highly significant (
P<0.01) and positive correlation was observed with root/shoot ratio under 15% PEG. Similarly, a highly significant (
P<0.01) and positive correlation was observed between root length at 20% PEG with root/shoot ratio at 15 and 20% PEG. A highly significant (
P<0.01) and negative correlation was observed between shoot length at 15% PEG with root/shoot ratio at 15 and 20% PEG. A highly significant (
P<0.01) and negative correlation was found between shoot length and root/shoot ratio at 20% PEG.
DISCUSSION
In the present study, seedling traits in different genotypes were affected differently under different stress levels (
Table 2). These findings are in agreement with those of
Dhanda et al. (2004),
Rauf et al. (2007),
Bayoumi et al. (2008),
Singh et al. (2008),
Raziuddin et al. (2010),
Baloch et al. (2012), and
Ahmad et al. (2013) in wheat. Relative to the control, increasing PEG concentration steadily reduced root and shoot length. However, treatment with 20% PEG increased root length relative to the 15% concentration (
Fig. 1). Similar results were found by
Decuseara and Nedelea (2012) in terms of genotypes response to PEG treatment, where it is noted that application of 20 and 30% concentrations resulted in the highest values of root length. Moreover,
Khakwani et al. (2011) reported that some wheat varieties increased their root length when treated with 15% PEG to reach deeper water under stress condition.
Genotypic variation in response to PEG treatments indicated feasibility to select for drought tolerance at the seedling stage. Clearly, the parent P7 had maximum root and shoot lengths under stress conditions, the highest root/shoot ratio under 20% PEG and its grain yield per spike was also higher than the other parents suggesting that P7 possessed drought stress tolerance genes and could be characterized as a good combiner and the most tolerant genotype.
The Wr/Vr regression analyses (
Fig. 2) indicated that both additive and non-additive effects were involved in the control of seedling traits which is in agreement with the results of
Awan et al. (2011) and
Ashadusjaman et al. (2012) in wheat.
Ashadusjaman et al. (2012) reported that root length and dry weight of shoot explain additive dominance model with over dominance for both traits, whereas dry weight of root and shoot/root ratio indicate epistasis. The presence of mostly additive gene effect for root length, shoot dry weight, root dry weight and root-shoot ratio was also reported by
Ashadusjaman et al. (2012). High additive effects have been found in root length under both stress and non-stress conditions, but in stress condition coleoptile length was governed with over dominance (
Najafabadi et al. 2004).
Rather low to moderately narrow-sense heritability was obtained for root length (0.18 and 0.12) and shoot length (0.19 and 0.12) at 15 and 20% PEG, respectively; root/shoot ratio (0.15) and seedling dry weight (0.16) at 15% PEG. Moderate to high genetic advance was observed for root length (41.24%) and shoot length (29.96%) under stress conditions suggesting that selection could be practiced on both traits for improving drought tolerance in wheat breeding programs. The high values of broad-sense heritability observed in all investigated traits (
Table 6) confirmed that these traits are less influenced by the environment. The differences between estimates of heritability in broad and narrow-sense obtained in all traits reflected the presence of non-additive genetic effects in the control of these traits. Similar results were found by
Dhanda et al. (2004),
Khan et al. (2010),
Gulnaz et al. (2012),
Hosseini et al. (2012), and
Shahbazi et al. (2012). According to
Hayman (1954a;
1954b;
1958), epistasis can decrease or increase degree of dominance which also affect heritability estimates. The magnitude of genetic components of variance and heritability for root and shoot length traits were lower under stress than under control which is in accordance with the results of
Dhanda et al. (2004) and
Khan et al. (2010) in bread wheat.
The development of root system in water deficit conditions appeared to be a very viable criterion to select for water stress because the root takes the moisture from lower layers of soil and it obviously suffers more than any other seedling trait (
Morgan et al. 1986;
Dhanda et al. 1995;
Baloch et al. 2012). Thus, root length is an important trait against drought stress in plant varieties and genotypes with longer roots resistant to drought (
Leishman and Westoby 1994). However, selection for large rooting system under drought conditions is beneficial but under normal conditions it seems not economical for the plants (
Khan et al. 2004).
In conclusion: Various genotypes were differently affected by water deficit simulated by the addition of polyethylene glycol to the medium; hence provided better opportunity to select for drought tolerance at early seedling stage. It appears that, genotypes having longer root and shoot lengths as well as greater grain yield under drought stress possessed favorable genes and could be characterized as the most tolerant genotypes to be used as parents in breeding programs. Highly heritable seedling traits associated to grain yield under drought stress conditions (i.e. root and shoot length) could be used as indirect selection for augmenting yield-based selection procedures in wheat. Moreover, these drought tolerance indices can be incorporated into other high yielding varieties to get maximum grain yield under drought stress conditions.
ACKNOWLEDGMENTS
The authors would like to thank Prof. M.K. Omara, Genetics Dept., Faculty of Agriculture, Assiut University, Egypt for providing the initial plant material (landraces) used in the present study.
Fig. 1Graphs depicting effect of different levels of PEG induced water stress on parents and F2 means for seedling traits (A: Root length; B: Shoot length; C: Root/shoot ratio and D: Seedling dry weight).

Fig. 2The Wr/Vr graphs of seedling traits under 15 and 20% PEG, and grain yield per spike under drought stressed field conditions. b: coefficient of regression.

Table 1Names and description of the eight landraces and the initial crosses established.
Table 1
|
Cross No. |
Names of landraces and their crosses |
Description |
|
1 |
WS-102 × WA-78 |
Tolerant × susceptible |
|
2 |
WA-72 × WA50 |
Tolerant × susceptible |
|
3 |
WA-92 × WK-19 |
Tolerant × susceptible |
|
4 |
WA-70 × WA-90 |
Tolerant × susceptible |
Table 2The means of various seedling traits for the seven parental genotypes and their F2 progenies under different PEG concentrations and for grain yield per spike.
Table 2
|
Traits |
Root length (cm) |
Shoot length (cm) |
Root/shoot ratio |
Seedling dry weight (g) |
Grain yield per spike (g) |
|
|
Genotypes |
Control |
5%PEG |
10%PEG |
15%PEG |
20%PEG |
Control |
5%PEG |
10%PEG |
15%PEG |
20%PEG |
Control |
5%PEG |
10%PEG |
15%PEG |
20%PEG |
Control |
5%PEG |
10%PEG |
15%PEG |
20%PEG |
|
Parents |
P1
|
9.27 |
7.72 |
6.45 |
3.29 |
4.77 |
16.37 |
11.33 |
8.53 |
5.79 |
3.18 |
0.57 |
0.68 |
0.76 |
0.58 |
1.50 |
0.28 |
0.62 |
0.41 |
0.44 |
0.31 |
2.09 |
|
P2
|
9.85 |
7.68 |
6.30 |
3.60 |
5.22 |
16.87 |
11.87 |
9.86 |
5.87 |
3.17 |
0.58 |
0.65 |
0.64 |
0.62 |
1.65 |
0.42 |
0.71 |
0.66 |
0.59 |
0.18 |
2.04 |
|
P3
|
10.0 |
8.00 |
6.26 |
3.35 |
4.52 |
18.44 |
12.71 |
10.22 |
5.96 |
3.16 |
0.54 |
0.63 |
0.61 |
0.57 |
1.43 |
0.46 |
0.56 |
0.50 |
0.64 |
0.30 |
2.06 |
|
P4
|
9.53 |
7.73 |
6.11 |
3.18 |
4.24 |
17.37 |
12.79 |
9.48 |
5.10 |
2.60 |
0.55 |
0.60 |
0.64 |
0.63 |
1.63 |
0.36 |
0.52 |
0.52 |
0.59 |
0.39 |
1.89 |
|
P5
|
8.73 |
7.24 |
6.35 |
3.48 |
4.79 |
16.93 |
12.46 |
10.31 |
4.89 |
3.24 |
0.52 |
0.58 |
0.62 |
0.71 |
1.48 |
0.28 |
0.56 |
0.95 |
0.62 |
0.37 |
2.01 |
|
P6
|
8.72 |
7.62 |
6.71 |
3.39 |
4.52 |
16.02 |
12.92 |
11.30 |
5.52 |
2.82 |
0.54 |
0.59 |
0.59 |
0.62 |
1.61 |
0.51 |
0.48 |
0.56 |
0.54 |
0.29 |
1.93 |
|
P7
|
8.62 |
8.36 |
6.87 |
4.05 |
5.24 |
17.31 |
14.14 |
11.50 |
6.71 |
3.03 |
0.50 |
0.59 |
0.60 |
0.61 |
1.74 |
0.66 |
0.47 |
0.85 |
0.51 |
0.43 |
2.71 |
|
|
Mean |
9.25 |
7.76 |
6.44 |
3.48 |
4.76 |
17.04 |
12.60 |
10.17 |
5.69 |
3.03 |
0.54 |
0.62 |
0.64 |
0.62 |
1.58 |
0.42 |
0.56 |
0.64 |
0.56 |
0.32 |
2.10 |
|
|
F2 progenies |
P1×P2
|
10.5 |
7.57 |
5.58 |
4.22 |
4.30 |
14.65 |
11.55 |
7.96 |
7.42 |
3.83 |
0.71 |
0.66 |
0.71 |
0.57 |
1.12 |
0.44 |
0.58 |
0.37 |
0.62 |
0.30 |
2.39 |
|
P1×P3
|
8.76 |
7.76 |
7.26 |
4.18 |
4.57 |
14.15 |
13.47 |
10.18 |
7.54 |
3.63 |
0.62 |
0.58 |
0.71 |
0.56 |
1.26 |
0.15 |
0.46 |
0.32 |
0.55 |
0.25 |
1.89 |
|
P1×P4
|
9.70 |
6.05 |
4.66 |
3.42 |
3.24 |
14.74 |
10.54 |
8.02 |
6.68 |
3.41 |
0.66 |
0.57 |
0.58 |
0.51 |
0.95 |
0.27 |
0.39 |
0.30 |
0.77 |
0.36 |
2.46 |
|
P1×P5
|
9.68 |
7.67 |
6.20 |
3.72 |
3.76 |
16.23 |
12.51 |
10.08 |
7.13 |
3.77 |
0.60 |
0.61 |
0.62 |
0.52 |
1.00 |
0.48 |
0.54 |
0.38 |
0.77 |
0.38 |
2.50 |
|
P1 ×P6
|
10.0 |
6.84 |
5.74 |
3.34 |
3.47 |
14.37 |
11.84 |
10.27 |
6.56 |
3.76 |
0.70 |
0.58 |
0.56 |
0.51 |
0.92 |
0.43 |
0.34 |
0.18 |
0.34 |
0.30 |
2.49 |
|
P1×P7
|
9.00 |
7.63 |
7.02 |
4.23 |
4.14 |
16.82 |
13.89 |
10.70 |
6.92 |
3.43 |
0.54 |
0.55 |
0.66 |
0.61 |
1.21 |
0.64 |
0.53 |
0.53 |
0.44 |
0.39 |
2.12 |
|
P2×P3
|
9.18 |
8.06 |
6.84 |
3.78 |
3.65 |
15.18 |
13.73 |
12.78 |
6.12 |
3.48 |
0.60 |
0.59 |
0.54 |
0.62 |
1.05 |
0.43 |
0.52 |
0.48 |
0.44 |
0.33 |
2.27 |
|
P2×P4
|
9.88 |
7.83 |
6.68 |
4.42 |
4.25 |
15.72 |
13.92 |
12.84 |
6.30 |
3.56 |
0.63 |
0.56 |
0.52 |
0.70 |
1.19 |
0.58 |
0.74 |
0.43 |
0.65 |
0.38 |
2.50 |
|
P2×P5
|
9.05 |
5.99 |
5.21 |
3.32 |
3.50 |
15.37 |
11.30 |
10.41 |
6.22 |
3.78 |
0.59 |
0.53 |
0.50 |
0.53 |
0.93 |
0.19 |
0.35 |
0.16 |
0.36 |
0.24 |
2.20 |
|
P2×P6
|
9.85 |
8.05 |
6.11 |
3.88 |
4.18 |
16.36 |
13.97 |
12.92 |
6.31 |
3.52 |
0.60 |
0.58 |
0.47 |
0.62 |
1.19 |
0.40 |
0.57 |
0.44 |
0.48 |
0.35 |
2.07 |
|
P2×P7
|
9.88 |
7.81 |
6.53 |
3.75 |
3.88 |
16.61 |
13.42 |
12.89 |
6.84 |
3.62 |
0.60 |
0.58 |
0.51 |
0.55 |
1.07 |
0.36 |
0.51 |
0.40 |
0.62 |
0.27 |
2.26 |
|
P3×P4
|
9.90 |
7.42 |
6.37 |
3.95 |
3.51 |
16.25 |
13.33 |
11.17 |
6.59 |
3.42 |
0.61 |
0.56 |
0.57 |
0.60 |
1.03 |
0.47 |
0.55 |
0.43 |
0.53 |
0.31 |
2.27 |
|
P3×P5
|
9.78 |
6.66 |
5.19 |
3.15 |
2.49 |
15.94 |
11.50 |
10.44 |
6.65 |
2.95 |
0.61 |
0.58 |
0.50 |
0.48 |
0.86 |
0.19 |
0.47 |
0.45 |
0.52 |
0.27 |
1.82 |
|
P3×P6
|
9.52 |
7.01 |
6.07 |
4.03 |
4.27 |
16.71 |
12.65 |
11.14 |
6.24 |
3.68 |
0.57 |
0.55 |
0.55 |
0.64 |
1.16 |
0.63 |
0.55 |
0.56 |
0.51 |
0.32 |
1.98 |
|
P3×P7
|
9.83 |
6.05 |
5.17 |
3.46 |
2.72 |
16.28 |
10.68 |
9.63 |
6.46 |
3.18 |
0.60 |
0.57 |
0.54 |
0.53 |
0.87 |
0.42 |
0.50 |
0.43 |
0.65 |
0.14 |
2.19 |
|
P4×P5
|
9.40 |
7.63 |
6.77 |
4.04 |
4.35 |
16.42 |
13.78 |
13.01 |
6.82 |
4.23 |
0.57 |
0.55 |
0.52 |
0.59 |
1.04 |
0.40 |
0.76 |
0.46 |
0.49 |
0.22 |
1.73 |
|
P4×P6
|
9.37 |
6.04 |
5.18 |
3.12 |
3.20 |
15.58 |
10.74 |
9.75 |
6.32 |
3.53 |
0.60 |
0.56 |
0.53 |
0.49 |
0.92 |
0.18 |
0.46 |
0.38 |
0.32 |
0.30 |
1.22 |
|
P4×P7
|
9.91 |
7.92 |
7.11 |
4.25 |
4.65 |
16.65 |
12.92 |
12.47 |
6.49 |
3.88 |
0.60 |
0.61 |
0.57 |
0.65 |
1.20 |
0.44 |
0.55 |
0.44 |
0.47 |
0.36 |
2.23 |
|
P5×P6
|
8.41 |
6.76 |
6.67 |
3.26 |
3.75 |
14.03 |
11.18 |
11.44 |
6.82 |
3.79 |
0.60 |
0.60 |
0.58 |
0.48 |
0.99 |
0.16 |
0.35 |
0.27 |
0.33 |
0.27 |
0.89 |
|
P5×P7
|
8.78 |
6.37 |
5.41 |
3.61 |
3.73 |
15.60 |
11.86 |
10.48 |
7.14 |
3.90 |
0.56 |
0.54 |
0.52 |
0.51 |
0.96 |
0.30 |
0.30 |
0.21 |
0.42 |
0.20 |
2.15 |
|
P6×P7
|
10. 8 |
7.40 |
8.06 |
3.70 |
4.40 |
14.56 |
12.92 |
11.64 |
7.10 |
4.53 |
0.74 |
0.57 |
0.69 |
0.52 |
0.97 |
0.32 |
0.51 |
0.56 |
0.56 |
0.33 |
2.51 |
|
|
Mean |
9.52 |
7.17 |
6.18 |
3.75 |
3.81 |
15.63 |
12.46 |
10.96 |
6.70 |
3.66 |
0.61 |
0.58 |
0.57 |
0.56 |
1.04 |
0.38 |
0.50 |
0.39 |
0.52 |
0.30 |
2.10 |
|
|
LSD (0.05)
|
0.93 |
1.05 |
1.7 |
1.27 |
0.66 |
1.31 |
1.65 |
1.40 |
1.34 |
0.60 |
0.1 |
0.1 |
0.14 |
0.19 |
0.25 |
0.27 |
0.23 |
0.16 |
0.25 |
0.24 |
0.64 |
Table 3The combined analysis of variance for seedling traits under different PEG concentrations.
Table 3
|
Source of variation |
d.f |
Mean square |
|
|
Root length |
Shoot length |
Root/shoot ratio |
Dry weight |
|
PEG concentrations |
4 |
484.23**
|
2045.80**
|
5.854**
|
0.723**
|
|
Rep./environment |
10 |
0.92**
|
0.94**
|
0.019**
|
0.023**
|
|
Genotypes |
27 |
2.94**
|
4.85**
|
0.069**
|
0.110**
|
|
Parents vs crosses |
1 |
4.50**
|
2.54**
|
1.255**
|
0.570**
|
|
Among parents |
6 |
0.58**
|
3.41**
|
0.009*
|
0.049**
|
|
Among crosses |
20 |
3.57**
|
5.39**
|
0.028**
|
0.106**
|
|
Treat. × Gen. |
108 |
0.78**
|
2.52**
|
0.045**
|
0.034**
|
|
Error |
270 |
0.1681 |
0.2113 |
0.0033 |
0.0067 |
Table 4Hayman analysis of variances (following Morley Jones modification) for seedling traits and grain yield per spike in a 7 × 7 half diallel cross with F2 generation of bread wheat.
Table 4
|
Traits |
Mean square |
|
|
Root length |
Shoot length |
Root/shoot ratio |
Dry weight |
Grain yield per spike |
|
|
Item |
d.f |
15% PEG |
20% PEG |
15% PEG |
20% PEG |
15% PEG |
20% PEG |
15% PEG |
20% PEG |
|
Rep. |
2 |
1.65**
|
0.1ns
|
0.63ns
|
0.44**
|
0.02*
|
0.06**
|
0.01ns
|
0.01ns
|
0.22*
|
|
a |
6 |
0.49*
|
0.71**
|
1.1**
|
0.21**
|
0.01ns
|
0.05**
|
0.03**
|
0.01ns
|
0.82**
|
|
b |
21 |
0.41*
|
1.56**
|
1.25**
|
0.61**
|
0.01**
|
0.25**
|
0.05**
|
0.01*
|
0.32**
|
|
b1
|
1 |
1.1*
|
14.1**
|
16.43**
|
6.31**
|
0.05**
|
4.5**
|
0.03*
|
0.01ns
|
0.01ns
|
|
b2
|
6 |
0.35ns
|
0.33**
|
0.81**
|
0.35**
|
0.02**
|
0.02*
|
0.04**
|
0.03**
|
0.26**
|
|
b3
|
14 |
0.39*
|
1.19**
|
0.35ns
|
0.32**
|
0.01*
|
0.05**
|
0.05**
|
0.01ns
|
0.36**
|
|
Error |
54 |
0.19 |
0.05 |
0.21 |
0.04 |
0.003 |
0.01 |
0.01 |
0.01 |
0.06 |
Table 5Correlation coefficients between the parental order of dominance (Vr+Wr) and the parental mean (Yr) for seedlings traits under 15 and 20% PEG and grain yield per spike.
Table 5
|
Traits |
Root length |
Shoot length |
Root/shoot ratio |
Dry weight |
Grain yield per spike |
|
15% PEG |
20% PEG |
15% PEG |
20% PEG |
15% PEG |
20% PEG |
15% PEG |
20% PEG |
|
Value |
−0.63ns
|
0.34ns
|
−0.88**
|
−0.93**
|
0.95**
|
0.64ns
|
−0.67ns
|
0.57ns
|
−0.41ns
|
Table 6Estimates of genetic components of variance and related statistics for seedlings traits under 15 and 20% PEG and grain yield per spike in a 7 × 7 half diallel cross with F2 generation of bread wheat.
Table 6
|
Components |
Traits |
|
|
Root length |
Shoot length |
Root/shoot ratio |
Dry weight |
Grain yield per spike |
|
|
15% PEG |
20% PEG |
15% PEG |
20% PEG |
15% PEG |
20% PEG |
15% PEG |
20% PEG |
|
|
Value ± S.E |
Value ± S.E |
Value ± S.E |
Value ± S.E |
Value ± S.E |
Value ± S.E |
Value ± S.E |
Value ± S.E |
Value ± S.E |
|
D |
0.010ns±0.079 |
0.122**±0.040 |
0.303*±0.119 |
0.042ns±0.023 |
0.001ns±0.002 |
0.010*±0.004 |
0.003ns±0.003 |
0.004ns±0.005 |
0.057ns±0.032 |
|
H1
|
0.384*±0.171 |
1.702**±0.112 |
1.199**±0.210 |
0.666**±0.069 |
0.015**±0.004 |
0.212**±0.015 |
0.061**±0.010 |
0.011ns±0.008 |
0.415**±0.070 |
|
H2
|
0.332**±0.126 |
1.615**±0.101 |
0.995**±0.160 |
0.569**±0.055 |
0.012**±0.003 |
0.206**±0.014 |
0.051**±0.007 |
0.006ns±0.005 |
0.350**±0.054 |
|
F |
−0.008ns±0.130 |
0.096ns±0.057 |
0.363ns±0.183 |
0.095ns±0.045 |
0.003ns±0.003 |
0.008ns±0.006 |
0.007ns±0.006 |
0.008ns±0.008 |
−0.024ns±0.044 |
|
(H1/D)1/2
|
6.29 |
3.74 |
1.99 |
4.00 |
4.71 |
4.66 |
4.86 |
1.79 |
2.70 |
|
h2b |
0.62 |
0.97 |
0.85 |
0.92 |
0.71 |
0.96 |
0.87 |
0.37 |
0.90 |
|
h2n |
0.18 |
0.12 |
0.19 |
0.12 |
0.15 |
0.06 |
0.16 |
0.08 |
0.41 |
|
|
GA |
41.24 % |
29.96 % |
2.49 % |
7.27 % |
|
Table 7Correlation coefficients among seedlings traits under 15 and 20% PEG and grain yield per spike under drought stressed field conditions.
Table 7
|
Traits |
Grain yield per spike |
Root length |
Shoot length |
Root/shoot ratio |
Seedling dry weight |
|
|
15% PEG |
20% PEG |
15% PEG |
20% PEG |
15% PEG |
20% PEG |
15% PEG |
20% PEG |
|
Grain yield |
per spike |
1 |
0.41*
|
0.16 |
0.15 |
0.07 |
0.24 |
0.08 |
0.46*
|
0.33 |
|
Root length |
15% PEG |
|
1 |
0.40*
|
0.44*
|
0.37*
|
0.52**
|
0.07 |
0.18 |
0.25 |
|
20% PEG |
|
|
1 |
−0.23 |
−0.03 |
0.63**
|
0.82**
|
0.09 |
0.29 |
|
Shoot length |
15% PEG |
|
|
|
1 |
0.63**
|
−0.53**
|
−0.56**
|
−0.01 |
−0.17 |
|
20% PEG |
|
|
|
|
1 |
−0.24 |
−0.59**
|
−0.20 |
−0.15 |
|
Root/shoot ratio |
15% PEG |
|
|
|
|
|
1 |
0.61**
|
0.21 |
0.41*
|
|
20% PEG |
|
|
|
|
|
|
1 |
0.17 |
0.31 |
|
Seedling dry weight |
15% PEG |
|
|
|
|
|
|
|
1 |
0.16 |
|
20% PEG |
|
|
|
|
|
|
|
|
1 |
References
- Aazami MA, Torabi M, Jalili E. 2010. In vitro response of promising tomato genotypes for tolerance to osmotic stress. Afr J Biotechnol. 9: 4014-4017.
- Agnihotri RK, Palni LMS, Pandey DK. 2007. Germination and seeding growth under moisture stress, screening of landraces of rice (Oryza sativa L.) from Kumaun region of Indian central Himalaya. J Plant Biol. 34: 21-27.
- Ahmad M, Shabbir G, Minhas NM, Shah MKN. 2013. Identification of drought tolerant wheat genotypes based on seedling traits. Sarhad J Agric. 29: 21-27.
- Allard RW. 1960. Principles of plant breeding. John Wiley and Sons, Inc. New York.
- Ashadusjaman M, Shamsuddoha M, Alam MJ, Begum MO. 2012. Combining ability and gene action for different root characters in spring wheat. J Environ Sci Nat Resour. 5: 73-76.
- Awan SI, Ahmed MS, Farooq J, Ahmad SD, Ilyas M, Shah AH, Khan MF, Ali S, Hasan L. 2011. Genetic model analysis on seedling and maturity traits in wheat under rainfed conditions. Front Agric Chin. 5: 486-496.
- Badieh MMS, Farshadfar E, Haghparast R, Rajabi R, Zarei L. 2012. Evaluation of gene actions of some traits contributing in drought tolerance in bread wheat utilizing diallel analysis. Ann Biol Res. 3: 3591-3596.
- Baloch MJ, Dunwell J, Khakwani AA, Dennett M, Jatoi WA, Channa SA. 2012. Assessment of wheat cultivars for drought tolerance via osmotic stress imposed at early seedling growth stages. J Agric Res. 50: 299-310.
- Bayoumi TY, Eid MH, Metwali EM. 2008. Application of physiological and biochemical indices as a screening technique for drought tolerance in wheat genotypes. Afr J Biotechnol. 7: 2341-2352.
- Bhargava S, Sawant K. 2013. Drought stress adaptation: metabolic adjustment and regulation of gene Expression. Plant Breed. 132: 21-32.
- Cooper M, van Eeuwijk F, Chapman SC, Podlich DW, Loeffler C. 2006. Genotype-by-environment interactions under water-limited conditions. Ribaut JM, editor. Drought adaptation in cereal. Haworth. NY: pp. 51-96.
- Datta JK, Mondal T, Banerjee A, Mondal NK. 2011. Assessment of drought tolerance of selected wheat cultivars under laboratory condition. J Agric Technol. 7: 383-393.
- Decuseara C, Nedelea G. 2012. The effect of genotype and water stress on root growth in some alfalfa varieties. J Hortic For Biotechnol. 16: 149-152.
- Deka M, Baruah KK. 1998. Moisture stress induced changes in seed germination and seedling growth of upland Ahu rice (Oriza sativa L.). Ind J Ecol. 25: 133-137.
- Dhanda SS, Behl RK, Elbassam L. 1995. Breeding wheat genotypes for water deficit environments. Landbanforschung Volkenrode. 45: 159-167.
- Dhanda SS, Sethi GS, Behl RK. 2004. Indices of drought tolerance in wheat genotypes at early stages of plant growth. J Agron Crop Sci. 190: 6-12.
- Fleury D, Jefferies S, Kuchel H, Langridge P. 2010. Genetic and genomic tools to improve drought tolerance in wheat. J Exp Bot. 61: 3211-3222.
- Gulnaz S, Khan SH, Shahzad M, Nasim W, Sajjad M. 2012. Genetic evaluation of spring wheat (Triticum aestivum L.) germplasm for yield and seedling vigor traits. J Agric Soc Sci. 8: 123-128.
- Hakizimana F, Haley SD, Turnipseed EB. 2000. Repeatability and genotype × environment interaction of coleoptile length measurements in winter wheat. Crop Sci. 40: 1233-1237.
- Hayman BI. 1954a. The analysis of variance of diallel tables. Biometrics. 10: 235-244.
- Hayman BI. 1954b. The theory and analysis of diallel crosses. Genetics. 39: 789-809.
- Hayman BI. 1958. The theory and analysis of diallel crosses II. Genetics. 43: 63-85.
- Hayman BI. 1960. The theory and analysis of diallel crosses III. Genetics. 45: 155-172.
- Hosseini SJ, Sarvestani ZT, Pirdashti H. 2012. Responses of some rice genotypes to drought stress. Int J Agric Res Rev. 2: 475-482.
- Jinks JL. 1954. The analysis of continuous variation in diallel cross in Nicotiana rustica varieties. Genetics. 39: 767-788.
- Johnson HW, Robinson HF, Comstock R. 1955. Estimates of genetic and environmental variability in soybeans. Agron J. 47: 314-318.
- Jones RM. 1965. Analysis of variance of the half diallel table. Heredity. 20: 117-121.
- Kaydam D, Yagmur M. 2008. Germination, seedling growth and relative water content of shoot in different seed sizes of triticale under osmotic stress of water and NaCl. Afr J Biotechnol. 7: 2862-2868.
- Khakwani AA, Dennett MD, Munir M. 2011. Early growth response of six wheat varieties under artificial osmotic stress condition. Pak J Agric Sci. 48: 118-123.
- Khan AS, Ul Allah S, Sadique S. 2010. Genetic variability and correlation among seedling traits of wheat (Triticum aestivum) under water stress. Int J Agric Biol. 12: 247-250.
- Khan IA, Habib S, Sadaqat HA, Tahir MHN. 2004. Selection criteria based on seedling growth parameters in maize varies under normal and water stress conditions. Int J Agric Biol. 6: 252-256.
- Kulkarni M, Deshpande U. 2007. In vitro screening of tomato genotypes for drought resistance using polyethylene glycol. Afr J Biotechnol. 6: 691-696.
- Larher F, Leport L, Petrivalsky M, Chappart M. 1993. Effectors for the osmoinduced proline response in higher plants. Plant Physiol Biochem. 31: 911-922.
- Leishman MR, Westody M. 1994. The role of seed size in seedling establishment in dry soil conditions experimental evidence from semi-arid species. J Ecol. 82: 249-258.
- Lopes MS, Reynolds MP. 2010. Partitioning of assimilates to deeper roots is associated with cooler canopies and increased yield under drought in wheat. Funct Plant Biol. 37: 147-156.
- Mather K, Jinks JL. 1971. Biometrical Genetics. 2nd ed. Chapman and Hall Limited. London:
- Morgan JM, Hare RA, Fletcher RJ. 1986. Genetic variation in osmo-regulation in bread and durum wheat and its relationship to grain yield in a range of field environments. Aust J Agric Res. 37: 449-457.
- Najafabadi MF, Ghanadha MR, Zali AA, Yazdi SB. 2004. Genetic analysis of seedling characters in bread wheat. In: Proceedings of the 4th International Crop Science Congress; Brisbane, Australia. 26 Sep–1 0ct 2004.
- Rauf M, Munir M, Ul-Hassan M, Ahmed M, Afzal M. 2007. Performance of wheat genotypes under osmotic stress at germination and early seedling growth stage. Afr J Biotechnol. 6: 971-975.
- Raziuddin Swati ZA, Bakht J, Farhatullah Khan NU, Shafi M, Akmal M, Hassan G. 2010. In situ assessment of morpho-physiological responses of wheat (Triticum aestivum L.) genotypes to drought. Pak J Bot. 42: 3183-3195.
- Rebetzke GJ, Richards RA, Fettell NA, Long M, Condon AG, Forrester RI, Botwright TL. 2007. Genotypic increases in coleoptile length improves stand establishment, vigour and grain yield of deep-sown wheat. Field Crop Res. 100: 10-23.
- Saint Pierre C, Crossa JL, Bonnett D, Yamaguchi-Shinozaki K, Reynolds MP. 2012. Phenotyping transgenic wheat for drought resistance. J Exp Bot. 63: 1799-1808.
- Sakthivelu G, Akitha Devi MK, Giridhar P, Rajasekaran T, Ravishankar GA, Nedev T, Kosturkova G. 2008. Drought- induced alterations in growth, osmotic potential and in vitro regeneration of soybean cultivars. Genet Appl Plant Physiol. 34: 103-112.
- Shahbazi H, Bihamta MR, Taeb M, Darvish F. 2012. Germination characters of wheat under osmotic stress: heritability and relation with drought tolerance. Int J Agric Res Rev. 2: 689-698.
- Singh GP, Chaudhary HB, Rajbir Y, Tripathi S. 2008. Genetic analysis of moisture stress tolerance in segregating populations of bread wheat (T. aestivum L.). Ind J Agric Sci. 78: 848-852.
- Sio-Se Mardeh A, Ahmadi A, Poustini K, Mohammadi V. 2006. Evaluation of drought resistance indices under various environmental conditions. Field Crop Res. 98: 222-229.
- Srividya A, Vemireddy L, Ramanarao P, Sridhar S, Jayaprada M, Anuradha G, Srilakshmi B, Reddy H, Hariprasad A, Siddiq E. 2011. Molecular mapping of QTLs for drought related traits at seedling stage under PEG induced stress conditions in rice. Amer J Plant Sci. 2: 190-201.
- Talebi R. 2011. Evaluation of chlorophyll content and canopy temperature as indicators for drought tolerance in durum wheat (Triticum durum Desf.). Aust J Basic Appl Sci. 5: 1457-1462.1.
- Ukai Y. 2006. http://lbm.ab.a.u-tokyo.ac.jp/~ukai/dial98.html