Abstract
Perennial poor fruit-set and variability in tree yield are among major problems of cashew nut production. Thus, development of improved stable genotypes would be a sustainable strategy to address this perpetual problem in order to boost income and livelihood of many smallholder farmers of this important commodity crop. Here, we have applied additive main effect and multiplicative interaction (AMMI) and genotype, genotype by environment (GGE) biplot analysis to a 3-year multi-locational trial data on nine yield component characters of cashew to evaluate phenotypic stability across diverse environments. Variance analysis showed significant variability in the cashew genotypes and strong influence of genotype by environment (GxE) on tree yield as none of the genotypes was stable for any of the yield components across locations. GxE data showed that a substantial portion of the variation was explained by the genotype (highly heritable), accounting for between 10% and 87% of the variation, while the environment accounted for between 0.7% and 37%. Data showed significant higher values of interaction (GxE) than the respective values for environment, and were mostly captured and could be explained by the first principal component axis (IPCA 1) for all the yield component characters. There was an inverse relationship between stability and yield as the best three yielding genotypes (KT_26, IW_222 and IW_31) were found to be the most unstable. Among the yield component tested, hermaphrodite flowers per panicle, nuts per panicle, nuts per tree, nut weight, and tree fruiting efficiency were identified to be critical components for nut yield. Although there was wide variation between the three environments evaluated, the data effectively identified two mega-environments (ME), and two superior genotypes (IW_222 and KT_26) suitable for these two mega-environments. The GxE complex exposes the short-comings of broad recommendations of common agronomic-husbandry technologies across diverse cashew ecologies as each mega-environment would require specific adaptable technologies for optimal plant output. Above all, the data presented here underscore the importance of multi-locational evaluation of genotypes for varietal development in cashew.
-
Key words: AMMI, Cashew, GGE biplots, Genotype x environment interaction (GxE), Phenotypic stability, Low yield
INTRODUCTION
Cashew, (
Anacardium occidentale L.), is a high-value export commodity crop and the source of livelihood for large populations of rural households in many parts of Africa, Asia, and South America. The tree has thrived in Africa and Asia since its introduction about five centuries ago (
Johnson 1973;
Mitchell and Mori 1987). Cashew has been identified as a crop with huge potential to alleviate poverty because of its cultivation across diverse ecologies and employment of rural women in its value-chain. The United Nations recently included cashew in its Millennium Development Goal (MDG) programme to reduce poverty in the West Africa sub-region. However, cultivation of cashew across diverse ecologies comes with wide variability (instability) in tree yield, and poor total nut production (
Martins and Kasuga 1995;
Aliyu and Awopetu 2007). Poor tree yield remains a major challenge to farmers and has hindered investments in the industry. Development of stable, high yielding varieties to improve nut production is a key strategy to achieve sustainable and investable cashew industry. Interestingly, data on cashew genetic resources to drive improvement are just emerging (
Masawe 1994;
Mneney et al. 1998;
2001;
Dhanaraj et al. 2002;
Aliyu and Awopetu 2007;
Archaket al. 2009;
Desai et al. 2010). However, empirical data of genotype by environment interaction (GxE) on cashew that could influence phenotype stability are rare. Meanwhile, the importance of GxE on crop performance cannot be overemphasized, especially for cashew that is cultivated across wide ecologies in major producing regions.
Phenotypic stability has been well reported for many crops (
Abd El-Moneim and Cocks 1993;
Biarnes-Dumoulin et al. 1996;
Abay and Bjørnstad 2009;
Acikgoz et al. 2009;
Misra et al. 2009;
Rao et al. 2011). One of the most efficient statistical tools for testing stability across environments is additive main effect and multiplicative interaction (AMMI) analysis (
Gauch and Zobel 1988). The robustness of AMMI analysis is anchored on its ability to capture large portion of GxE interaction that enables breeders to meaningfully interpret the data agronomically/practically (
Gauch 1992) and select the best varieties for each environment. In other words, the AMMI analysis allows breeders to make reliable decisions in selection and development of superior varieties in breeding programme. Recently, GGE biplot analysis has been used to complement AMMI analysis in analyzing multilocational data (
Gauch 2006;
Yan et al. 2007;
Gauch et al. 2008;
Rakshit et al. 2012). The advantage of GGE biplot lies in its ability to remove the environmental effect (E) and integrate the genotypic effect (G) with genotype by environment interaction (GxE) in the data set. GGE has been applied to crops such as wheat, rice, barley, peanut, soybean, and sorghum (
Rakshit et al. 2012). Till date, published data on tree crops with application of these robust tools are rare.
To this end, AMMI and GGE biplot analyses were applied to a set of three-year data collected on nine yield component characters of seven cashew genotypes selected from diverse genetic backgrounds (
Akinwale and Esan 1989;
Akinwale 1990) and evaluated across three locations (environments) in Nigeria (
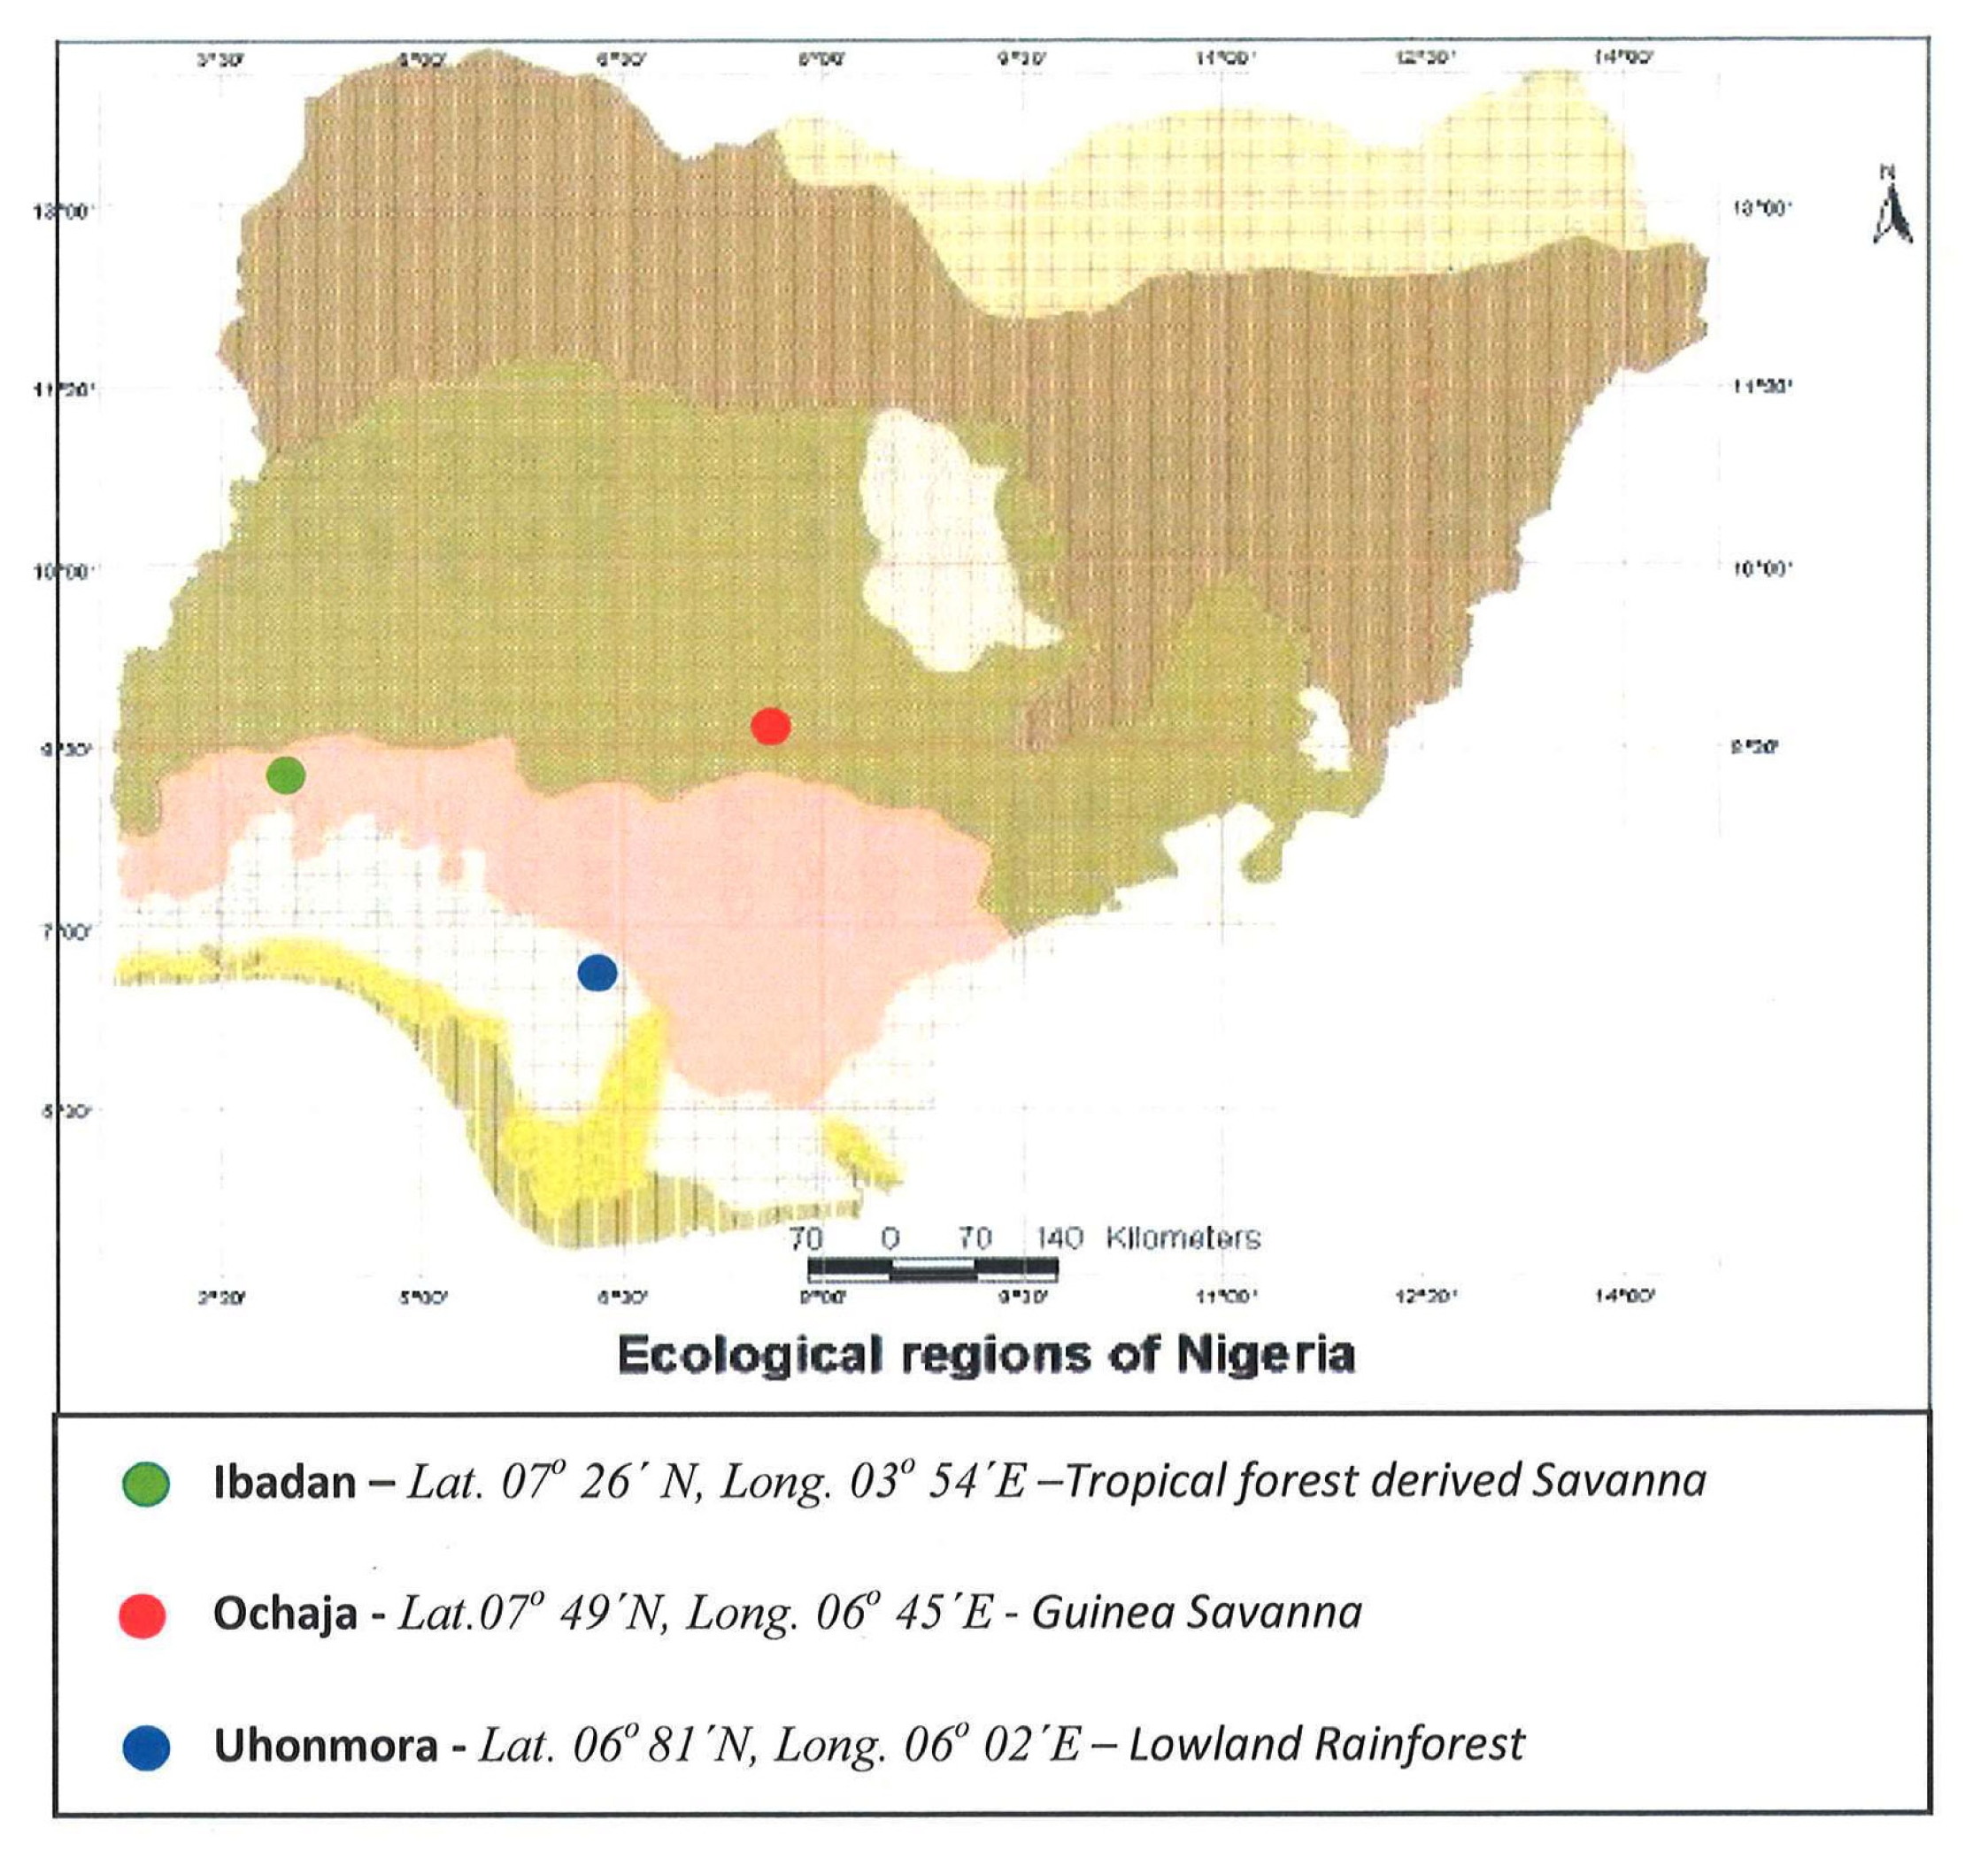
Figure 1). The goals of this study include identification of superior stable genotype(s) and understanding the influence ofGxE on phenotypic stability for yield in cashew.
MATERIALS AND METHODS
Seven cashewgenotypes (Eruwa_93 (ER_93), Iwo_31 (IW_31), Iwo_88 (IW_88), Iwo_222 (IW_222), Kotarakara_26 (KT_26), Madras_261 (MD_261), and Oghe_60 (OG_60)) were selected for this study. These genotypes were half-sib progenies of on-station evaluation of large germplasm introduced from the Centre for Plantation Crops, India; Institute of Agricultural Research, Tanzania; and commercial plantations (WNDC and ENDC) by the Cocoa Research Institute of Nigeria between 1960 and 1980 (
Akinwale and Esan 1989;
Aliyu 2012). It is important to note that there was no established clonal plantation that could be used for this study. These plant materials were selected on a single-tree-descendant basis and planted between 1991 and 1992 into a randomized complete block design of three replicates per genotype across three locations (Ibadan, Ochaja, and Uhonmora) (
Fig. 1). Each genotype has 3 entries (trees) per replication.
Ibadan is characterized by a rainforest derived savannah transition ecology (07° 26′ N, 03° 54′E) with a bimodal rainfall pattern, mean annual rainfall of 1325mm, and mean temperature of 28°C. The normal rainy season is from April to October, and the dry season from December to March (
Fig. 1). However, the dry season is sometimes shorter, with early rain in as early as February. Its forest vegetation is characterized by soil rich in organic matter and texturally comprising 834, 94, and 72 g/kg
−l of sand, silt, and gravel, respectively (
Salako et al. 1999).
Ochaja is located in north-central Nigeria and is characterized by a dry guinea savannah ecology (07° 49′N, 06° 45′E) (
Fig. 1). The annual mean rainfall at Ochaja is about 1070 mm and the annual temperature ranges between 29°C and 38°C. This ecology is characterized by a distinct dry season between November and April with rare early rains. The average humidity is between 65% and 70% with abundant sunshine (6.5 hours daily average) (
Saliu et al. 2010).
The third location, Uhonmora (06° 81′N, 06° 02′E) (
Fig. 1), is a lowland tropical rainforest climate with a long wet and short dry seasons. The annual rainfall is between 1500mm and 2500mm, and the average humidity ranges from 80–90% (
Adejuwon 2011).
In the experimental plots, trees were planted at 6.0 x 6.0 metres plant spacing in a randomized complete block experimental design. The experimental plots were managed for weeds and pests. Data were collected on nine yield components: days to flowering, number of hermaphrodite flowers per panicle, pollination efficiency (%), number of productive panicles per tree, number of nuts per panicle, number of nuts harvested per tree, total nut yield per tree (kg), mean nut weight (g), and tree fruiting efficiency (%). Days to flowering were computed from 01 September of the year i.e. after second flushing (
Aliyu and Awopetu 2003). Cashew flowering begins in late August and sometimes extends to May of the following year in this region (
Akinwale 1990;
Aliyu and Awopetu 2003). Hermaphrodite flowers per panicle were estimated from at least 120 panicles sampled per tree (across 4 canopy sections) during flowering. Nuts per panicle were the number of fruits clustering on a panicle and estimated for at least 120 panicles per tree. Nuts per tree were the total number of nuts produced per tree per year. Total nut yield was the weight of all the nuts produced per tree per year in kg. Mean nut weight (g) was the average weight of 100 nuts measured (individually) after detachment of pseudo-apples. Pollination efficiency (%) was estimated at 4 weeks after anthesis from the relationship between the number of hermaphrodite flowers and nuts per panicle according to the following equation.
Fruiting efficiency (%) was calculated from the same relationship but at 8 weeks after anthesis for each panicle (
Aliyu and Hammed, 2000). Detailed procedures on data collection for some of these cashew yield component characters has been previously reported (
Aliyu and Awopetu 2003;
2007;
2011;
Aliyu 2006;
2008). The three-year (2002/2003 – 2004/2005) data from the three locations were summarized and statistically analyzed for combined analysis of variance (ANOVA), additive main effect and multiplicative interaction (AMMI), and GGE biplot analysis using a combination of Genstat 13.2 version software by VSN International (
www.vsni.co.uk/software/genstat) and GGE biplot version 6.3 by Visual Statistical Analysis System (
www.ggebiplot.com). In order to appropriately reflect the relationships between flowering precocity (earliness to flowering) and other yield component, quantitative data for days to flowering were transformed into qualitative classes on a weighted-scale of 1 to 10. Precocious genotypes, i.e. most earliness to flowering within 2 weeks from 01 September, were scored 10 and those with delayed (late) flowering beyond 18 weeks (126 days) from 01 September were scored 1.
RESULTS
A summarized combined ANOVA for the nine yield components across the 3 environments (locations) for 3 years is presented in
Table 1. An overview of the ANOVA result showed significant differences (
P<0.01) for all the yield components studied for genotype (G), environment (location) (E), and year (Y) (
Table 1). The interaction of the three factors i.e. (GxE, GxY, ExY, and GxYxE) were significant (
P<0.05 and
P<0.01) for most of the yield components (
Table 1). Only mean nut weight recorded non-significant results for ExY and GxYxE. The results from variance analysis of the yield component data showed a significant influence of genotype, environment, and year on cashew yield component characters and the complex interaction of these factors on these components. The extent of variability was high for the yield component characters with coefficients of variation ranging between 26.60% and 58.93% (
Table 1).
A summarized matrix of phenotypic correlation analysis for the yield components is presented in
Table 2. There were negative correlations between days to flowering, and hermaphrodite flowers per panicle, and the number of productive panicles per tree, but positive correlation with pollination efficiency. Positive correlations were obtained between hermaphrodite flowers and fruiting efficiency, and nut yield components (nuts per panicle, nuts per tree, total nut yield (kg) per tree, and nut weight), but negative for pollination efficiency (
Table 2). The relationship between nuts per panicle and productive panicles per tree was negative, but positive with nuts per tree, total nut yield (kg) per tree, pollination, and fruiting efficiencies. The highest correlation (
r = 0.84) was recorded between nuts per tree and total nut yield (kg) per tree. And both positively correlated with productive panicles per tree, and fruiting efficiency. Correlations between nut size and total nut yield, productive panicles per tree and fruiting efficiency were significantly positive, but negative for pollination efficiency. Pollination and fruiting efficiencies were positively significant.
AMMI analysis of the nine yield component characters is summarized in
Table 3. Similar to ANOVA, genotype and environment separately showed significant differences for all the yield components (
Table 3) and their interactions (GxE) were also significant. Between 39.79% and 91.42% of the total variation were due to the treatment factors (
Table 3). Except for day to flowering and pollination efficiency, the AMMI analysis showed that substantial portions of variation (that signify degree of influence of each component factor) were explained by genotype (
Table 3). The effect of genotype (explained %) ranged from about 10% to about 87.04% for the number of productive panicles per tree and nut weight, respectively. The influence of the environment was between 0.7% for nut weight and 37% for days to flowering. The data however showed significantly higher values of interaction (GxE) over their respective values for the environment, and were mostly captured and could be explained by first principal component axis (IPCA 1) for all the yield components (
Table 3).
Mean performance and phenotypic stability of the genotypes were analyzed by AMMI (PCA 1 values) and GGE biplot (
Figures 2a–i) and we found high concordance between the two analyses. Because the first two PCAs of GGE biplot accounted for between 84.3% – 99.8% of the total variation (
Figure 2a–i), and as such captured more GxE variations compared to AMMI PCAs. Consequently, emphasis was on GGE biplots. ER_91 was most precocious (i.e. recorded least period to flowering), while OG_60 recorded longest period to flowering. And the most stable genotype for days to flowering was IW_31 (
Figure 2a). In terms of production of hermaphrodite flowers, IW_222 and KT_26 were most prolific, but KT_26 combined moderate stability with high production (
Figure 2b). MD_261, with the highest production of nuts per tree, displayed the highest instability for nuts per panicle and nuts per tree (
Figure 2c and d). The best three yielding genotypes (KT_26, IW_222, and IW_31) displayed the highest instability for nut yield traits (
Figures 2d and e). Highly prolific nut production genotype (MD_261) dropped in total nut yield (kg) per tree for its small size nuts (mean nut weight). In contrast to the two nut yield traits, mean nut weight was the most stable of all yield component characters studied (
Figure 2f), with KT_26 producing the largest nut size. Incidentally, this KT_26, though with least pollination efficiency (
Figure 2g) recorded highest fruiting efficiency (
Figure 2i). IW_222 combined efficient pollination with high productive panicles (
Figures 2g and h), but these traits were highly unstable.
Divergence among the 3 locations was analyzed using centered preserving data (SPV = 2) for the nine yield component characters (
Figure 3a–i). None of the three locations was consistently superior for all the yield components. The acute angle between the vectors of environment is a reflection of affinity (
Yan and Tinker, 2006). GGE biplots for days to flowering showed close affinity between Ibadan and Uhonmora compared to Ochaja, with cashews growing in the former beginning to flower earlier than the latter (
Figure 3). The same close affinity between Ibadan and Uhonmora as opposed to Ochaja were recorded for hermaphrodite flower (
Figure 3b), nuts per tree (
Figure 3d), total nut yield (
Figure 3e), productive panicles per tree (
Figure 3h), and fruiting efficiency (
Figure 3i). However, biplots for nuts per panicle (
Figure 3c) and the mean nut weight (
Figure 3f) displayed convergent among the three locations.
The performance of the genotypes in each environment, ranked by AMMI analysis (
Table 4), was complimented with the which-won-where biplots (
Figure 4a–i). Genotypes at the vertices of polygon (biplots) are either best or poorest in one or more environments (
Yan 2001). For days to flowering, ER_93 was the best genotype in Ibadan and Uhonmora, and MD_261 in Ochaja (
Table 4,
Figure 4a). However, IW_222 was the best genotype in Ibadan and Uhonmora in terms of hermaphrodite flowers per panicle (
Figure 4b), nuts per panicle (
Figure 4c), nuts per tree (
Figure 4d), total nut yield (kg) per tree (
Figure 4e), and productive panicles per tree (
Figure 4h). MD_261 and KT_26 were the best genotypes for these components in Ochaja (
Figures 4b, c, d and e). KT_26 was the best genotype in terms of mean nut weight for all three environments (
Figure 4f). The biplot for pollination efficiency indicates IW_222 as best in Ochaja, OG_60 in Ibadan, and IW_31 in Uhonmora (
Figure 4g). The most efficient fruiting genotype in Ochaja was KT_26, while OG_60 was best in Ibadan and Uhonmora.
DISCUSSION
Breeding for stable yield would involve evaluation of crop varieties across diverse environments to identify superior genotypes with broad or specific adaptation due to GxE interaction. And it has been shown that varietal adaptation differs significantly across environments (
Kaya and Taner 2002). Evaluation of such phenotypic stability through GxE is very important for a crop system like cashew that is cultivated across diverse ecologies (
Ohler, 1979). There are arrays of statistical tools for analyzing GxE data, but here we have chosen a combination of AMMI and GGE biplot because they are capable of summarizing the interactions in comprehensible ways, which will enable breeders to visualize phenotypic stability across environments from multilocational trial data (
Thillainathan and Fernandez 2001) and allows easy identification of superior genotypes in each environment (which-won-where) (
Yan et al. 2007). Till date, no data has been reported on GxE in cashew evaluating phenotypic stability using this approach. Here, we have applied these robust statistical tools to a 3-year multilocational trial data collected on nine yield components from seven cashew genotypes across 3 diverse environments in Nigeria (
Figure 1).
An overview of the variability data revealed that the cashew genotypes are genetically different for all the yield components, and responded differently across the 3 environments. Wide genetic backgrounds (source of introduction, differential level of domestication and improvement) and open-pollinated (half-sib) source of these cashew genotypes (
Akinwale and Esan, 1989;
Aliyu, 2012) could account for this high variability.
Obisesan and Fatunla (1983) had opined that it is not uncommon that crop genotypes at the early stage of a breeding programme, as is the case here, can exhibit broad variability which would offer breeders flexibility for selection of candidates with diverse attributes as crossing-parents in a breeding programme. Furthermore, the wide phenotypic variability could be linked to the out-breeding nature of cashew (
Sedgley and Griffin 1989;
Sedgley 1994). Out-breeding crop systems are characterized by high genetic recombination (
Charlesworth and Wright 2001;
Glémin et al. 2006) leading to a highly heterozygous population with diverse fitness (phenotypes). Importantly, high genetic variability among genotypes would allow selection of potential candidates for flowering precocity and high yield (positive selection). Variation in days to flowering has been reported not only between genotypes, but also on a tree basis in
Prunus avium (
Diaz and Merlo 2008). It must be noted that the genotypes were half-sib progenies and liable to natural (high) variability.
Phenotypic correlation analysis of cashew does not show evidence of strong genetic linkage between factors controlling earliness to flowering (precocity) and nut yield.
Guitton et al. (2012) reported negative correlation after 3
rd year in apple (
Malus x domestica), between flowering precocity and fruit yield, similar to this study in cashew. Thus, selection and breeding for flowering precocity (earliness) should not be a priority in cashew yield improvement in the short-term, because of its indirect negative effect on yield (
Aliyu 2006). Polygenes with various functions have also been implicated in flowering initiation (precocity) (
Guitton et al. 2012) and data from Arabidopsis has indicated that dominant and recessive genes were responsible for expression of fruit size and flowering time, respectively (
Wu, 1974). Furthermore, negative correlations between precocity and hermaphrodite flowers and productive panicles production (
Table 2) also support previous findings that cashew flowering is in phases, with mix-phase (i.e. when hermaphrodite flowers are most produced) being in the peak of flowering (
Ohler 1979;
Aliyu and Awopetu 2003). Partial delay in the production of hermaphrodite flowers towards a warm climate across the three environments, indicates the importance of warm temperature to cashew flowering. Yield component characters such as nuts per trees, nuts per panicle, productive panicles per tree, and efficient pollination that showed strong relationships (high correlation values,
r > 0.50) are more critical genetic elements for nut yield improvement in this crop, as genotypes (IW_222 and KT_26) with high production of productive panicles and hermaphrodite flowers gave the highest nut yield. Results obtained in this study support previous data (
Murthy et al. 1984;
Azevedo et al. 1998;
Aliyu 2006;
Aliyu and Awopetu 2011). Although the relationships between nut size and total nut yield was positively significant, breeders must be cautious in the use of this yield component characters as a selection indicator for nut yield, because of the number-size trade-off complex (
Aliyu and Awopetu, 2011). Also of importance is the relationships between reproductive efficiency (flowering and fruiting) and yield; highlighting the need for further study on the flower pollination system in order to develop an integrated improvement technology for improved nut yield.
Considering data presented here, GxE analysis revealed that the genetic constitution of the cashew substantially contributed to variation recorded in all the yield components except for days to flowering (
Table 3), and as such are highly heritable. The strong genotypic influence on these yield components indicates that variability in nut yield within and between diverse ecologies (environments) could be ameliorated through development of phenotypes (varieties) with location-specific adaptation. However, the significant environmental effect on the days to flowering signifies great influence of climatic variables on flowering initiation and floral development in cashew. Studies have shown that flowering initiation is controlled by polygenes and strongly influenced by temperature changes (
Alcalde et al., 1999). It was also observed that the GxE brought about change in performance (ranking of genotype) between locations and rule out a universal best genotype among these seven cashew genotypes across the three locations used for this study. Each location has some comparative advantages over the others. Climatic data (not shown) showed that each environment (location) varies in rainfall (quantity and pattern), temperature, humidity, sunshine (spread and quantity), and harmattan (very dry and dusty wind), all of which could affect cashew flowering and fruiting differently. The effect of climatic and edaphic factors on flowering and yield of some tree crops are well documented (
Gordon 1976;
Ohler, 1979;
Avim and de 1984;
Esan 1993;
Blaike et al. 1998;
Tolla 2004;
Omolaja et al. 2009;
Omonona and Akintude 2009;
Oyekale et al. 2009). However, among the three locations, Ibadan and Uhonmora favour flowering precocity. Cashew trees growing in these two locations consistently began flowering about 4–6 weeks earlier than the trees in Ochaja with late rainfall and high temperature.
Omolaja et al. (2009) recorded similar correlation between rainfall-temperature and flowering initiation in cocoa (
Theobroma cacao) in Ibadan. This observation probably signifies the important role of available soil moisture for growth and development of reproductive tissues in cashew trees. Early rain could facilitate faster recovery of trees after the previous fruiting season and early readiness for the new reproductive (flowering) cycle. Nonetheless, these climatic advantages in Ibadan and Uhonmora did not translate to better yield over Ochaja, as there was no linkage between earliness to flowering and nut yield production (
Table 2). This result reinforces earlier opinions that factors controlling nut yield in cashew are more complex than earlier thought (see
Aliyu 2008;
Aliyu and Awopetu 2011;
Aliyu et al. 2011).
In contrast to flower precocity, warm climatic condition (Ochaja) favours better quality flower production and nut yield than the other two (cooler) locations. And with better flower production and higher nut yield in Ochaja compared to the two cooler environments, the GxE data prove further the importance of warm climatic conditions for optimal flowering and fruit development in cashew. Although, the importance of soil moisture could be critical during nut filling and physiological maturity (
Aliyu and Hammed 2000;
Aliyu 2007), as indicated by comparatively bigger nuts from Ibadan and Uhonmora, however, Ochaja was the most suitable for cashew production among the 3 environments. However, it must be noted that cashew trees in Ochaja produced more productive flowers, but the proportions that got pollinated for fruit-set were less. High rate of flower abortion, insufficient pollinators, and soil nutrient-yield dynamics could account for the observation in this warm environment. On the other hand, reduced productive flowers in cooler regions could be attributed to high humidity and pest infestation (see
Anikwe et al. 2008). Excessive humidity has been attributed to severe fruit drop in mango (
Mangifera indica) (
Anila and Radha 2003).
Since the goals of this study include identification of superior genotypes across the environments, the phenotypic stability analysis (GxE) data grouped the three environments into 2 mega-environments, namely; Ibadan and Uhonmora as mega-environment 1 (ME-1) with IW_222 as the best genotype, and Ochaja as mega-environment 2 (ME-2) with MD_261 as the best genotype. But for nut size-number trade-off (
Aliyu and Awopetu 2011), KT_26 would be most suitable genotype for ME-2 because it combines high nut yield with a moderate large nut size (
Table 4). At a planting density of between 120 – 270 trees per hectare, IW_222 has potential to produce between 2.60 and 5.50 tons of nuts per hectare in ME-1, while KT_26 would yield between 3.20 and 6.80 tons per hectare in ME-2. In other words, with combination of suitable genotypes for the specific environment and appropriate husbandry techniques, significant improvement in cashew nut yield is possible. Although, none of the genotypes was universal in performance across the 3 environments, IW_222 was the closest universal phenotype as it ranked among best 3s for critical nut yield components across the 3 locations.
GxE data obtained here demonstrates that an ideal cashew environment for optimal yield should include better soil fertility, available soil moisture, optimal temperature and moderate relative humidity during flowering and fruit development (
Ohler 1979). Significant GxE recorded in this study indicate the need for the development of an efficient integrated husbandry management technology tailored towards ecological peculiarities and further exposed the risk of making general recommendations of agronomic-husbandry technologies and uniform varieties across diverse cashew ecologies. Each mega-environment may require adaptable technologies for optimal plant outputs. Varietal characteristics and climatic variables of the farm location must guide adoption of integrated production technology for a productive cashew farm. Above all, the data presented here underscores the importance of multi-locational evaluation of genotypes for varietal development in cashew.
ACKNOWLEDGEMENTS
We acknowledge Messrs L. O. Raji, S. O. Odeleye, A. Ajani, S. Oladoyinbo and R. A. Adeleke for information about the cashew plots and support on data collection across the three experimental stations.
Fig. 1A Nigerian vegetation map showing the ecological description of the 3 experimental locations (environments) used for this cashew GxE study.

Fig. 2GGE biplots of cashew genotypes showing mean vs. stability for (a) days to flowering, (b) hermaphrodite flowers, (c) nuts per panicle, (d) nuts per tree, (e) total nut yield (kg) per tree, (f) nut weight, (g) pollination efficiency, (h) panicles per tree, and (i) fruiting efficiency.
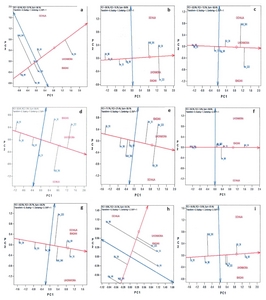
Fig. 3GGE biplots of cashew genotypes showing relationships between environments (locations) and genotypes for (a) days to flowering, (b) hermaphrodite flowers, (c) nuts per panicle, (d) nuts per tree, (e) total nut yield (kg) per tree, (f) nut weight, (g) pollination efficiency, (h) panicles per tree, and (i) fruiting efficiency.
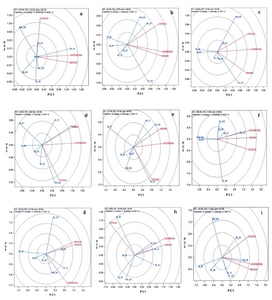
Fig. 4GGE biplots of cashew genotypes showing “Which-won-where” for (a) days to flowering, (b) hermaphrodite flowers, (c) nuts per panicle, (d) nuts per tree, (e) total nut yield (kg) per tree, (f) nut weight, (g) pollination efficiency, (h) panicles per tree, and (i) fruiting efficiency.
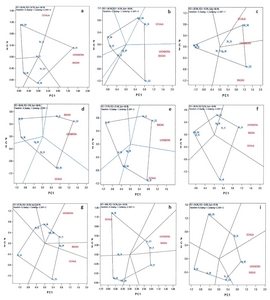
Table 1Mean square values and descriptive statistics (ANOVA) showing variability of nine yield component characters.
Table 1
|
Source of variance |
Degree of freedom |
Days to flowering |
Hermaphrodite flowers per panicle |
Nuts per panicle |
Nuts per tree |
Nut yield per tree (kg) |
|
Replication |
2 |
124.99 |
12.75 |
2.68 |
55074.00 |
3.32 |
|
Genotype |
6 |
2144.76**
|
996.29**
|
137.26**
|
14386523.00**
|
811.63**
|
|
Error
|
12 |
54.76 |
8.58 |
0.76 |
94098.00 |
5.65 |
|
Environment |
2 |
14026.81**
|
1012.78**
|
30.19**
|
7580853.00**
|
197.97**
|
|
Genotype x Environment |
12 |
1392.87**
|
165.13**
|
26.21**
|
5392818.00**
|
187.18**
|
|
Error
|
28 |
34.80 |
15.34 |
1.01 |
140169.00 |
5.12 |
|
Year |
2 |
1179.62**
|
821.94**
|
44.48**
|
1840079.00**
|
157.85**
|
|
Genotype x Year |
12 |
294.11**
|
37.66**
|
5.13**
|
761719.00**
|
28.01**
|
|
Environment x Year |
4 |
407.72**
|
35.56*
|
5.78**
|
169478.00ns |
4.96ns |
|
Environment x Year x Genotype |
24 |
190.58**
|
50.15**
|
2.47**
|
357096.00**
|
14.43**
|
|
Error
|
84 |
52.05 |
11.31 |
0.95 |
85450.00 |
4.16 |
|
Range |
|
24.00 (9)–132.00 (2) |
6.42–47.92 |
2.00–14.45 |
366.00–5600.00 |
1.45–34.64 |
|
Mean |
|
68.05 (6) |
19.98 |
5.98 |
2164.00 |
13.42 |
|
Standard Deviation |
|
20.10 (1.37) |
8.91 |
2.87 |
1033.00 |
6.96 |
|
Coefficient of variation (%) |
|
22.70 |
44.62 |
48.08 |
48.00 |
51.85 |
|
Source of variance |
Degree of freedom |
Nut weight (g) |
Pollination Efficiency (%) |
Productive Panicles per Tree |
Tree Fruiting Efficiency (%) |
|
Replication |
2 |
0.18 |
78.13 |
4987.00 |
31.04 |
|
Genotype |
6 |
74.01**
|
687.30**
|
85897.00**
|
7862.58**
|
|
Error
|
12 |
0.10 |
58.69 |
10715.00 |
26.72 |
|
Environment |
2 |
1.80**
|
1815.15**
|
97341.00**
|
564.54**
|
|
Genotype x Environment |
12 |
1.56**
|
223.36**
|
132047.00**
|
807.73**
|
|
Error
|
28 |
0.20 |
41.89 |
13478.00 |
75.37 |
|
Year |
2 |
3.82**
|
384.38**
|
220526.00**
|
5863.02**
|
|
Genotype x Year |
12 |
0.53**
|
197.39**
|
41393.00**
|
475.25**
|
|
Environment x Year |
4 |
0.13ns |
350.43**
|
20561.00*
|
253.63**
|
|
Environment x Year x Genotype |
24 |
0.20ns |
216.91**
|
15094.00**
|
125.26**
|
|
Error
|
84 |
0.21 |
47.71 |
5958.00 |
50.03 |
|
Range |
|
3.25 – 9.85 |
9.95 – 71.89 |
157.00 – 1045.00 |
3.64 – 91.04 |
|
Mean |
|
6.19 |
31.30 |
391.60 |
36.33 |
|
Standard Deviation |
|
1.65 |
11.81 |
158.00 |
21.41 |
|
Coefficient of variation (%) |
|
26.60 |
37.73 |
40.00 |
58.93 |
Table 2Correlation analysis of nine yield component characters.
Table 2
|
Days to flowering |
Hermaphrodite flower per panicle |
Nuts per panicle |
Nuts per tree |
Total nut yield (kg) |
Nut wieght (g) |
Pollination Efficiency (%) |
Productive panicles per tree |
Fruiting efficiency (%) |
|
Days to flowering |
1.00 |
|
|
|
|
|
|
|
|
|
Hermaphrodite flower per panicle |
−0.13*
|
1.00 |
|
|
|
|
|
|
|
|
Nuts per panicle |
0.02ns |
0.67**
|
1.00 |
|
|
|
|
|
|
|
Nuts per tree |
−0.01ns |
0.64**
|
0.72**
|
1.00 |
|
|
|
|
|
|
Total nut yield (kg) |
−0.01ns |
0.58**
|
0.54**
|
0.84**
|
1.00 |
|
|
|
|
|
Nut wieght (g) |
−0.09ns |
0.12*
|
−0.03ns |
0.03ns |
0.50**
|
1.00 |
|
|
|
|
Pollination Efficiency (%) |
0.18**
|
−0.43**
|
0.28**
|
0.03ns |
−0.07ns |
−0.14*
|
1.00 |
|
|
|
Productive panicles per tree |
−0.13*
|
0.04ns |
−0.22**
|
0.35**
|
0.45**
|
0.18*
|
−0.25**
|
1.00 |
|
|
Fruiting efficiency (%) |
−0.03ns |
0.34**
|
0.57**
|
0.38**
|
0.53**
|
0.49**
|
0.24**
|
−0.28**
|
1.00 |
Table 3GxE (Explained %) from AMMI analysis for nine (9) yield component characters of cashew.
Table 3
|
|
Days to flowering |
Hermaphrodite flowers |
Nuts per panicle |
Nuts per tree |
|
|
|
Source of variation |
DF |
SS |
MS |
% E. |
SS |
MS |
% E. |
SS |
MS |
% E. |
SS |
MS |
% E. |
|
Total
|
188 |
75984 |
404 |
|
14933 |
79.40 |
|
1553.7 |
8.26 |
|
200605571 |
1067051 |
|
|
Treatments |
20 |
57637 |
2882** |
75.85 |
9985 |
499.20** |
66.86 |
1198.4 |
59.92** |
77.13 |
166194662 |
8309733** |
82.85 |
|
Genotypes |
6 |
12869 |
2145** |
16.94 |
5978 |
996.30** |
40.03 |
823.6 |
137.26** |
53.01 |
86319193 |
14386523** |
40.03 |
|
Environments |
2 |
28054 |
14027** |
36.92 |
2026 |
1012.80* |
13.57 |
60.40 |
30.19** |
3.89 |
15161707 |
7580853** |
7.56 |
|
Block |
6 |
379 |
63ns |
0.50 |
109 |
18.10ns |
0.73 |
14.40 |
2.40ns |
0.93 |
610100 |
10183 ns |
0.30 |
|
Interaction |
12 |
16714 |
1393** |
22.00 |
1982 |
165.10** |
13.27 |
314.5 |
26.21** |
20.24 |
64713817 |
5392818** |
32.26 |
|
IPCA 1 |
7 |
15405 |
2201** |
20.27 |
1937 |
276.70** |
12.97 |
262.3 |
37.47** |
16.88 |
62263046 |
8894721** |
31.04 |
|
IPCA 2 |
5 |
1309 |
262ns |
1.02 |
45 |
8.90ns |
0.30 |
52.2 |
10.43* |
3.36 |
2450771 |
490154** |
1.22 |
|
Error |
162 |
17969 |
111 |
|
4840 |
29.90 |
|
340.8 |
2.10 |
|
33800809 |
208647 |
|
|
Nut yield per tree (kg) |
Nut weight (g) |
Pollination Efficiency (%) |
Productive panicles per tree |
Tree Fruiting Efficiency (%) |
|
|
SS |
MS |
% E. |
SS |
MS |
% E. |
SS |
MS |
% E. |
SS |
MS |
% E. |
SS |
MS |
% E. |
|
9097 |
48.4 |
|
510.2 |
2.17 |
|
26220 |
139:5 |
|
4693285 |
24964 |
|
86142 |
458 |
|
|
7512 |
375.6** |
82.58 |
466.4 |
23.32** |
91.42 |
10434 |
521.7** |
39.79 |
2294629 |
114731** |
48.89 |
57997 |
2900** |
67.33 |
|
4870 |
811.6** |
53.53 |
444.1 |
74.01** |
87.04 |
4124 |
687.3** |
15.73 |
515384 |
85897** |
10.98 |
47175 |
7863** |
54.76 |
|
396 |
198.0** |
4.35 |
3.6 |
1.8** |
0.71 |
3630 |
1815.2** |
13.84 |
194682 |
97341** |
4.14 |
1129 |
565* |
1.31 |
|
19 |
3.2ns |
0.21 |
1.0 |
0.17ns |
0.20 |
313 |
52.2ns |
1.19 |
93151 |
15525ns |
1.98 |
750 |
125ns |
0.87 |
|
2246 |
187.20** |
24.69 |
18.7 |
1.56** |
3.67 |
2680 |
223.4* |
10.22 |
1584563 |
132047** |
33.76 |
9693 |
808* |
11.25 |
|
2171 |
310.1** |
23.87 |
17.7 |
2.52** |
3.47 |
2390 |
341.5* |
9.12 |
1278233 |
182605** |
27.24 |
6651 |
950** |
7.72 |
|
76 |
15.1ns |
0.84 |
1.0 |
0.20ns |
0.20 |
290 |
58.0ns |
1.11 |
306329 |
61266** |
6.53 |
3042 |
608* |
3.53 |
|
1566 |
9.7 |
|
42.9 |
0.26 |
|
15473 |
95.5 |
|
2305505 |
14232 |
|
27395 |
169 |
|
Table 4Ranking of genotypes in each environment by AMMI analysis.
Table 4
|
Environment |
Rank |
|
Days to flowering |
Hermaphrodite flowers per panicle |
Nuts per panicle |
Nu Nuts per tree |
Nut yield per tree (kg) |
|
|
Genotype |
Mean |
Genotype |
Mean |
Genotype |
Mean |
Genotype |
Mean |
Genotype |
Mean |
|
Ibadan |
1st
|
ER_93 |
36.33 |
IW_222 |
23.69 |
IW_222 |
8.63 |
IW_222 |
3295.83 |
IW_222 |
22.39 |
|
2nd
|
IW_31 |
50.11 |
KT_26 |
20.31 |
OG_60 |
5.69 |
IW_31 |
2110.56 |
IW_31 |
14.85 |
|
3rd
|
IW_88 |
52.11 |
MD_261 |
16.77 |
KT_26 |
5.49 |
MD_261 |
1608.33 |
KT_26 |
12.39 |
|
4th
|
KT_26 |
52.78 |
OG_60 |
14.83 |
MD_261 |
5.11 |
KT_26 |
1406.11 |
OG_60 |
8.69 |
|
5th
|
IW_222 |
52.89 |
IW_31 |
12.98 |
IW_31 |
4.91 |
OG_60 |
1382.78 |
MD_261 |
6.71 |
|
6th
|
OG_60 |
59.56 |
ER_93 |
10.41 |
ER_93 |
3.33 |
ER_93 |
1180.67 |
IW_88 |
6.21 |
|
7th
|
MD_261 |
66.78 |
IW_88 |
8.82 |
IW_88 |
3.1 |
IW_88 |
907.78 |
ER_93 |
5.17 |
|
Mean
|
|
51.95 |
|
15.40 |
|
5.18 |
|
1698.87 |
|
10.92 |
|
|
Ochaja |
1st
|
MD_261 |
53.56 |
KT_26 |
49.81 |
MD_261 |
12.47 |
MD_261 |
4612.56 |
KT_26 |
27.2 |
|
2nd
|
KT_26 |
66.11 |
MD_261 |
45.62 |
KT_26 |
8.73 |
KT_26 |
3259.56 |
MD_261 |
17.78 |
|
3rd
|
ER_93 |
68.56 |
IW_222 |
31.41 |
IW_222 |
7.92 |
IW_222 |
2576.33 |
IW_222 |
15.03 |
|
4th
|
IW_31 |
82.33 |
OG_60 |
22.54 |
OG_60 |
6.19 |
OG_60 |
2475 |
OG_60 |
14.61 |
|
5th
|
IW_222 |
95.33 |
IW_31 |
16.94 |
IW_31 |
4.4 |
IW_88 |
1744.72 |
IW_88 |
12.98 |
|
6th
|
OG_60 |
100.86 |
IW_88 |
14.79 |
IW_88 |
2.4 |
IW_31 |
1592.67 |
IW_31 |
10.56 |
|
7th
|
IW_88 |
110.89 |
ER_93 |
13.94 |
ER_93 |
2.29 |
ER_93 |
577.56 |
ER_93 |
2.39 |
|
Mean
|
|
83.45 |
|
27.86 |
|
6.34 |
|
2405.49 |
|
14.36 |
|
|
Uhonmora |
1st
|
ER_93 |
39.35 |
IW_222 |
23.79 |
IW_222 |
8.46 |
IW_222 |
3075.5 |
IW_222 |
20.65 |
|
2nd
|
IW_222 |
52.45 |
KT_26 |
20.47 |
MD_261 |
8.26 |
MD_261 |
1901.67 |
KT_26 |
16.44 |
|
3rd
|
IW_88 |
60.40 |
MD_261 |
18.93 |
KT_26 |
6.5 |
KT_26 |
1832.78 |
IW_31 |
12.92 |
|
4th
|
KT_26 |
61.55 |
OG_60 |
13.98 |
IW_31 |
6.48 |
IW_31 |
1867.78 |
OG_60 |
8.35 |
|
5th
|
IW_31 |
64.22 |
IW_31 |
13.44 |
OG_60 |
6.2 |
OG_60 |
1272.72 |
MD_261 |
7.75 |
|
6th
|
MD_261 |
68.00 |
ER_93 |
9.89 |
ER_93 |
4.32 |
ER_93 |
1202.89 |
IW_88 |
6.51 |
|
7th
|
OG_60 |
71.05 |
IW_88 |
9.06 |
IW_88 |
4.14 |
IW_88 |
1075.56 |
ER_93 |
5.06 |
|
Mean
|
|
58.02 |
|
15.65 |
|
6.34 |
|
1746.99 |
|
11.10 |
|
Environment |
Rank |
Nut weight (g) |
Pollination efficiency (%) |
Productive panicles per tree |
Fruiting efficiency (%) |
|
|
Genotype |
Mean |
Genotype |
Mean |
Genotype |
Mean |
Genotype |
Mean |
|
Ibadan |
1st
|
KT_26 |
8.84 |
OG_60 |
39.18 |
IW_222 |
546.25 |
IW_222 |
54.31 |
|
2nd
|
IW_31 |
7.03 |
IW_31 |
37.66 |
IW_31 |
433.27 |
KT_26 |
48.33 |
|
3rd
|
IW_88 |
6.79 |
IW_222 |
37.35 |
ER_93 |
374.58 |
IW_31 |
40.37 |
|
4th
|
IW_222 |
6.76 |
IW_88 |
36.19 |
MD_261 |
320.28 |
OG_60 |
34.07 |
|
5th
|
OG_60 |
6.41 |
MD_261 |
31.83 |
IW_88 |
316.2 |
IW_88 |
24.8 |
|
6th
|
ER_93 |
4.4 |
ER_93 |
31.6 |
OG_60 |
274.11 |
MD_261 |
13.94 |
|
7th
|
MD_261 |
4.15 |
KT_26 |
27.24 |
KT_26 |
264.75 |
ER_93 |
13.2 |
|
Mean
|
|
6.34 |
|
34.44 |
|
361.35 |
|
32.72
|
|
|
Ochaja |
1st
|
KT_26 |
8.36 |
IW_222 |
31.48 |
IW_222 |
497.98 |
KT_26 |
60.42 |
|
2nd
|
IW_88 |
7.43 |
IW_31 |
28.3 |
KT_26 |
438.54 |
OG_60 |
47.03 |
|
3rd
|
IW_31 |
6.6 |
OG_60 |
28.15 |
OG_60 |
423.58 |
IW_222 |
45.7 |
|
4th
|
OG_60 |
5.94 |
MD_261 |
27.86 |
IW_88 |
400.97 |
MD_261 |
40.01 |
|
5th
|
IW_222 |
5.82 |
ER_93 |
19.18 |
IW_31 |
372.14 |
IW_31 |
30.19 |
|
6th
|
ER_93 |
4.09 |
IW_88 |
18.66 |
MD_261 |
369.29 |
IW_88 |
15.56 |
|
7th
|
MD_261 |
3.84 |
KT_26 |
17.72 |
ER_93 |
249.71 |
ER_93 |
5.97 |
|
Mean
|
|
6.01 |
|
24.48 |
|
436.03 |
|
34.98
|
|
|
Uhonmora |
1st
|
KT_26 |
8.92 |
IW_31 |
49.55 |
IW_222 |
444.95 |
IW_31 |
53.41 |
|
2nd
|
IW_31 |
7.09 |
MD_261 |
49.45 |
IW_31 |
389.79 |
KT_26 |
50.51 |
|
3rd
|
IW_222 |
6.7 |
IW_88 |
46.99 |
KT_26 |
364.09 |
IW_222 |
42.2 |
|
4th
|
OG_60 |
6.56 |
OG_60 |
46.12 |
MD_261 |
307.31 |
IW_88 |
28.33 |
|
5th
|
IW_88 |
6.01 |
ER_93 |
45.07 |
OG_60 |
295.23 |
OG_60 |
27.4 |
|
6th
|
ER_93 |
4.21 |
IW_222 |
34.89 |
ER_93 |
232.99 |
MD_261 |
21.45 |
|
7th
|
MD_261 |
4.06 |
KT_26 |
32.3 |
IW_88 |
211.29 |
ER_93 |
10.37 |
|
Mean
|
|
6.22 |
|
43.48 |
|
320.81 |
|
33.38
|
References
- Abay F, Bjørnstad A. 2009. Specific adaptation of barley varieties in different locations in Ethiopia. Euphytica. 167: 181-195.
- Abd El-moneim AM, Cocks PS. 1993. Adaptation and yield stability of selected lines of Lahtyrus spp. under rainfed conditions in West Asia. Euphytica. 66: 89-97.
- Acikgoz E, Ustun A, Gul I, Anlarsal E, Tekeli AS, Nizam I, Avcioglu R, Geren H, Cakmakci S, Aydinoglu B, Yucel C, Avci M, Acar Z, Ayan I, Uzun A, Bilgili U, Sincik M, Yavuz M. 2009. Genotype x environment interaction and yield stability analysis for dry matter and seed yield in field pea (Pisum sativum L.). Spanish J Agric Res. 7(1): 96-106.
- Adejuwon JO. 2011. A spectral analysis of rainfall in Edo and Delta States (formerly Mid-Western Region), Nigeria. International Journal of Climatology. 31: 2365-2370.
- Akinwale SA. 1990. Biological characterization of cashew (Anacardium occidentale L.). Ph D Thesis Department of Botany, Obafemi Awolowo University. Ile – Ife, Nigeria, 211.
- Akinwale SA, Esan EB. 1989. Advances in Cashew Breeding in Nigeria. Progress in Tree Crop Research. 2nd Edition. Cocoa Research Institute of Nigeria. pp. 166-174.
- Alcalde JA, Wheeler TR, Summerfield RJ, Norero AL. 1999. Quantitative effects of the genes Lf, Sn, E, and Hr on time of flowering in pea (Pisum sativum L.). J Exp Bot. 50: 1691-1700.
- Aliyu OM. 2012. Genetic diversity of the Nigerian cashew germplasm. pp. 163-184. editor. Genetic Diversity in Plants. Çalişkan Mahmut, InTech Publisher. Croatia: pp. 498.
- Aliyu OM, Awopetu JA. 2011. Variability study on nut size and number trade-off identify a threshold level for optimum yield in cashew (Anacardium occidentale L.). International Journal of Fruit Science. 11(4): 342-363.
- Aliyu OM, Adeigbe OO, Awopetu JA. 2011. Foliar application of exogenous plant hormones at pre-blooming stage increases cashew (Anacardium occidentale L.) yield through improved flowering, fruit set, fruit retention and nut size. Journal of Crop Science and Biotechnology. 14(2): 143-150.
- Aliyu OM. 2008. Compatibility and fruit set in cashew (Anacardium occidentale L.). Euphytica. 160: 25-33.
- Aliyu OM. 2007. Pollen-style compatibility in cashew (Anacardium occidentale L.). Euphytica. 158: 249-260.
- Aliyu OM, Awopetu JA. 2007. Multivariate analyses of cashew (Anacardium occidentale L.) germplasm in Nigeria. Silvae Genetica. 56(3–4): 170-179.
- Aliyu OM. 2006. Phenotypic correlation and path coefficient analysis of nut yield and yield components in cashew. Silvae Genetica. 55(1): 19-24.
- Aliyu OM, Awopetu JA. 2003. Studies on flowering pattern in cashew (Anacardium occidentale L.). Nigerian Journal of Genetics. 18: 29-35.
- Aliyu OM, Hammed LA. 2000. A study of nut and apple development in cashew (Anacardium occidentale L.). Nigerian Journal of Tree Crop Research. 4(2): 1-10.
- Alvim P, de T. 1984. Factors affecting the flowering of cocoa tree. Cocoa Growers Bulletin. 35: 23-31.
- Anikwe JC, Otuonye H, Okelana FA, Hammed LA, Aliyu OM. 2008. Integrated management of an emerging insect pest of cashew: A case study of the cashew root and stem borer, Plocaederus ferrugineus, in Ibadan, Nigeria. International Journal of Agriculture Forestry and Social Sciences. 5(1): 143-149.
- Anila R, Radha T. 2003. Studies in fruit drop in mango varieties. Journal of Tropical Agriculture. 41: 30-32.
- Archak S, Gaikwad AB, Swamy KRM, Karihaloo JL. 2009. Genetic analysis and historical perspective of cashew (Anacardium occidentale L.) introduction into India. Genome. 52(3): 222-230.
- Azevedo DMP, Crisóstomo JR, Almeida FCG, Rossetti AG. 1998. Estimates of genetic correlations and correlated responses to selection in cashew (Anacardium occidentale L.). Genet Mol Biol (online). 21(3):
- Biarnes-Dumoulin V, Denis JB, Lejeune-Henaut I, Eteveg G. 1996. Interpreting yield instability in pea using genotypic and environmental covarates. Crop Sci. 36: 115-120.
- Blaike SJ, Chacko EK, Lu P, Muller WJ. 1998. Productivity and water relations of field grown cashew: a comparison of sprinkler and drip irrigation. Australian Journal of Experimental Agriculture. 41(5): 663-673.
- Charlesworth D, Wright SI. 2001. Breeding systems and genome evolution. Current Opinion in Genetics & Development. 11: 685-690.
- Desai AR, Mokashi AN, Korikanthimath VS, Fakrudin B, Patil RV, Hegde RV, Gadag RN. 2010. Comparative analysis of morphometric and molecular diversity in cashew (Anacardium occidentale L.) genotypes. Indian Journal of Plant Genetic Resources. 23: 104-109.
- Dhanaraj A, Bhaskara Rao EVV, Swamy KRM, Bhat MG, Prasad DT, Sondur SN. 2002. Using RAPDs to assess the diversity in Indian cashew (Anacardium occidentale L.) germplasm. J Hortic Sci Biotechnol. 77(1): 41-47.
- Diaz R, Merlo E. 2008. Genetic Variation in reproductive traits in a clonal seed orchard of Prunus avium in Northern Spain. Silvae Genetica. 57,3: 110-118.
- Esan EB. 1993. The effect of gravimorphism on the efficiency of seed pod production in cacao seed orchards. In: Proceedings of the 11th International Cocoa Research Conference, Book of Summaries; Yamoussoukro, Cote d’Ivoire. pp 637-644.
- Gauch HG, Piepho HP, Annicchiarico P. 2008. Statistical analysis of yield trials by AMMI and GGE: further considerations. Crop Science. 48: 866-889.
- Gauch HG. 2006. Statistical analysis of yield trials by AMMI and GGE. Crop Science. 46: 1488-1500.
- Gauch HG. 1992. Statistical analysis of regional yield trials. AMMI analysis of factorial designs. Amsterdam: Elsevier.
- Gauch HG, Zobel RW. 1988. Predictive and post-dictive success of statistical analysis of yield trials. Theoretical and Applied Genetics. 76: 1-10.
- Glémin S, Bazin E, Charlesworth D. 2006. Impact of mating systems on patterns of sequence polymorphism in flowering plants. Proc R Soc B. 273: 3011-3019.
- Gordon J. 1976. Cocoa: Its nature, habitat and cultivation. editor. Cocoa Production, Economic and Botanical Perspectives. Springer Publishers. Simmons J, New York: pp. 3-29.
- Guitton B, Kelner JJ, Velasco R, Gardiner SE, Chanque D, Costes E. 2012. Genetic control of biennial bearing in apple. J Experimental Botany. 63(1): 131-149.
- Johnson D. 1973. The botany, origin and spread of cashew (Anacardium occidentale L.). Journal of Plantation Crops. 1: 1-7.
- Kaya Y, Taner S. 2002. Additive main effects and multiplicative interactions analysis of yield performances in bread wheat genotypes across environments. Turk J Agric For. 26: 275-279.
- Martins PJ, Kasuga LJ. 1995. Variation in cashew tree yield in South east Tanzania and the implication for management of cashew smallholder farmers in Tanzania. Experimental Agriculture. 72: 261-268.
- Masawe PAL. 1994. Aspect of breeding and selecting improved cashew genotypes (Anacardium occidentale L.). Ph D Thesis University of Reading. UK.
- Misra RC, Das S, Patnaik MC. 2009. AMMI model analysis of stability and adaptability of late duration finger millet (Eleusine coracana) genotypes. World Applied Sciences Journal. 6(12): 1650-1654.
- Mitchell JD, Mori SA. 1987. The cashew and its relatives (Anacardium, Anacardiaceae). Memoirs of New York Botanical Gardens English. 42: 1-76.
- Mneney EE, Mantell SH, Tsoktouridis G, Amin S, Bessa AMS, Thangavelu M. 1998. RAPD – profiling of Tanzanian cashew (Anacardium occidentale L.). In: Proceedings of International Cashew and Coconut Conference, Dar es Salaam; 1997; Tanzania. pp 108-115.
- Mneney EE, Mantell SH, Bennett M. 2001. Use of random amplified polymorphic DNA (RAPD) markers to reveal genetic diversity within and between populations of cashew (Anacardium occidentale L.). J Hortic Sci Biotechnol. 76: 375-383.
- Murthy KN, Vijayakumar K, Pillai RSN, Kumaran PM. 1984. Aspects of flowering behaviour and correlation studies in cashew tree (Anacardium occidentale L.). In: Proceedings of the International Cashew Symposium, Cochin, Central Plantation Crop Research Institute (ICAR); Kerala, India. pp 279-280.
- Obisesan IO, Fatunla T. 1983. Genotype x environment interaction for bunch yield and its components in the Oilpalm. Theoretical Applied Genetics. 64: 133-136.
- Ohler JG. 1979. Cashew. Koninklijk instituut voor de Tropen; Teskin, Zutphen Co.. Amsterdam, The Netherlands.
- Omolaja SS, Aikpokpodion P, Adedeji S, Vwioko DE. 2009. Rainfall and temperature effects on flowering and pollen productions in cocoa. African Crop Science Journal. 17(1): 41-48.
- Omonona BT, Akintunde OK. 2009. Rainfall effects on water use and yield of cocoa in Nigeria. Continental J Agricultural Economics. 3: 52-60.
- Oyekale AS, Bolaji MB, Olowa OW. 2009. The Effects of Climate Change on Cocoa Production and Vulnerability Assessment in Nigeria. Agricultural Journal. 4(2): 77-85.
- Rakshit S, Ganapathy KN, Gomashe SS, Rathore A, Ghorade RB, Nagesh-Kumar MV, Ganesmurthy K, Jain SK, Kamtar MY, Sachan JS, Ambekar SS, Ranwa BR, Kanawade DG, Balusamy M, Kadam D, Sakar A, Tonapi VA, Patil JV. 2012. GGE biplot analysis to evaluate genotype, environment and their interaction in sorghum multi-location data. Euphytica. 185: 465-479.
- Rao PS, Reddy PS, Bathore A, Reddy BVS, Panwar S. 2011. Application of GGE biplot and AMMI model to evaluate sweet sorghum (Sorghum bicolor) hybrids for genotype x environment interaction and seasonal adaptation. Indian J Agric Sci. 81(5): 438-444.
- Salako FK, Babalola O, Hauser S, Kang BT. 1999. Soil micro-aggregate stability under different fallow system and cropping intensity in Southwestern Nigeria. Geoderma. 91: 103-123.
- Saliu OJ, Alao JS, Oluwagbemi T. 2010. An evaluation of farmer’s participation in afforestation programme in Kogi State, Nigeria. Journal of Agricultural Science. 2(3): 248-257.
- Sedgley M, Griffin AR. 1989. Sexual Reproduction of Tree Crop. Academic Press. London.
- Sedgley M. 1994. Self-incompatibility in woody horticultural species. pp. 141-163. Williams EG, Clarke AE, Knox RB, editors. Genetic control of self-incompatibility and reproductive development in flowering plants. Kluwer Academic. Dordrecht:
- Thillainathan M, Fernandez GCJ. 2001. SAS application of Tai’s stability analysis and AMMI model genotype x environmental interaction (GEI) effects. Journal of Heredity. 92(4): 367-371.
- Tolla TD. 2004. Effects of moisture conditions and management on production of cashew: A case study in the Lower Limpopo basin, Mozambique. An M Sc Thesis. International Institute for Geo- information Science and Earth Observation; Enschede, The Netherlands, 95. http://www.itc.nl/library/papers_2004/msc/nrm/teshome_demissie_tolla.pdf
- Wu HP. 1974. Genetic basis of plant stability in Arabidopsis thaliana. Bot Bull, Academia Sinica. 15: 69-88.
- Yan W. 2001. GGE biplot – a windows application for graphical analysis of multi-environment trial data and other types of two-way data. Agron J. 93: 1111-1118.
- Yan W, Tinker NA. 2006. Biplot analysis of multi-environment trial data: principles and applications. Can J Plant Sci. 86: 623-645.
- Yan W, Kang MS, Ma BL, Woods S, Cornelius PL. 2007. GGE biplot vs. AMMI analysis of genotype-by-environment data. Crop Science. 47: 643-653.