Abstract
We investigated the species discriminatory efficiency of the proposed plant barcoding loci ITS2 and matK in Vicia species. In 2011, China Plant BOL Group proposed the addition of nuclear ITS2 to matK be accepted as a 2-locus DNA barcode to classify plant species. The matK region was chosen as a DNA barcode because of its effective species discriminating power, high quality sequence recovery, and easy experimental analysis. Integration of matK sequences into Vicia phylogeny could improve phylogenetic reconstruction of this species. To assess the ability of barcoding loci to resolve Vicia species, we sampled 36 of the taxonomically best known groups in the genus. Topologies of the phylogenetic trees based on ITS2 and matK analyses were similar but a few accessions were placed into distant phylogenetic groups. Neither ITS2 nor matK analyses alone could discriminate some closely related Vicia species. Thus, we have proposed a concatenated data approach to increase the resolving power of ITS2 and used matK as an additional tool for phylogenetic analysis in Vicia because characterization of the nucleotide sequences of the matK region was easier to recover and more cost-effective than those of the ITS region.
-
Key words: Vicia, Barcode DNA, Phylogenetic analysis, Species differentiation
INTRODUCTION
Legumes (Fabaceae) are the third largest flowering family and are second only to cereals in their importance for human nutrition. Archaeological evidence suggests that the Mediterranean region is the principal center of origin for legumes (
Perrino 1988). Legumes are inexpensive, nutrient-dense, and high-quality sources of protein that can be substituted for dietary animal protein (
Anderson et al. 1999). Legumes also produce a high diversity of secondary metabolites which serve as medicinal, nutraceuticals, and eco-friendly by-products such as tannins, gums, insecticides, resins, varnish, paints, dyes, and biodiesel. Moreover, there is renewed interest in grain legumes for their use in animal feed. Equally important is the role of legumes to sustainable agriculture, because of their ability to fix soil nitrogen via symbiotic nitrogen-fixation. They also play an important role as a rotation crop with cereal grain and vegetable crops (
Arianoutsou and Thanos 1996;
Velazquez et al. 2010)
The genus
Vicia L. is a member of the legume tribe Vicieae of the subfamily Papilionoideae (
Frediani et al. 2004). The temperate and herbaceous genus
Vicia L. comprises 210 annual or perennial species that are widely distributed in temperate regions of Europe, Asia, and the Americas (
Maxted 1993;
Jaaska 2005). The identification of
Vicia species using a method based on their morphological characteristics has proved tricky and is rather difficult to account for the entire genetic variation existing in
Vicia species (
Haider et al. 2000).
Hosseinzadeh et al. (2008) reported that there are several species with intermediate morphological characters which makes species diagnosis a difficult task for non-specialists. Large scale structural changes were observed in
Vicia chromosomes; thus, cytological and karyological studies have been performed to discriminate their taxonomy (
Maxted et al. 1991;
Navratilova et al. 2003); however, earlier morphological and cytogenetic studies had limited ability to discriminate the species. Thus, a robust and reliable method is crucial to discriminate plant species to secure their diversity. Recently, DNA barcoding has become a hotspot of biodiversity research (
Gregory 2005).
The barcoding method has been used to identify a specific region of the plant genome that can be sequenced routinely in diverse sample sets, resulting in easily comparable data which enable species to be distinguished from one another (
Chen et al. 2010). Many recent papers have been reviewed about DNA barcoding in plants (
Vijayan and Tsou 2010;
Hollingsworth et al. 2011). There has been considerable debate regarding locus choice for DNA barcoding and a number of single locus and combined loci have been proposed as barcode sequences (
Chase et al. 2007;
Kress and Erickson 2007), but no consensus has emerged on the use of a standard region. To facilitate the selection of a plant barcode, the Consortium for the Barcode of Life (CBOL) was formed from the systematics research community. Subsequently a number of loci have been tested for their suitability as plant bar-codes and CBOL research groups have proposed combinations of
rbcL and
matK loci as their preferred plant barcodes (
Group et al. 2009). Several researchers have already demonstrated the potential for using ITS2 for taxonomic classification and phylogenetic reconstruction at both the genus and species levels for eukaryotes, including animals, plants, and fungi (
Schultz et al. 2005;
Yao et al. 2010;
Bellemain et al. 2010). The ITS2 region of nuclear DNA provides a powerful tool because of sufficient variation in primary sequences and secondary structures. To achieve maximum species discrimination, the China Plant BOL (Group
Li et al. 2011) proposed the addition of nuclear ITS2 to the
matK +
rbcL combination as a plant barcode. We therefore evaluated the use of a nuclear region ITS2 along with a chloroplast region
matK for discrimination of
Vicia L. species and to compare phylogenetic tree topologies of
matK and ITS2 analyses.
MATERIALS AND METHODS
Plant Material and DNA extraction
Seeds of genebank accessions (a total of 105 accessions) belonging to 36 species of
Vicia were provided by the Genetic Resource Center of the National Academy of Agricultural Science, Rural Development Administration, Republic of Korea (
Table S1). To determine which of a subset of the proposed barcoding loci are necessary to resolve
Vicia species, we sampled a total of 105 accessions which contains one to five individual accessions. Seeds were germinated and leaf tissue was harvested from 3 weeks old seedling in the greenhouse. Total DNA was extracted using the DNeasy® Plant Mini kit (Qiagen, Valencia, CA, USA) according to the manufacturer’s instructions. Fresh leaf tissue from each accession was used for each extraction and was ground well in liquid nitrogen. DNA was resuspended in 100 μL water, and dilutions were made to 10 ng/μL followed by storage at either −20°C or −80°C. Genomic DNA was quantified using a Nanodrop/UVS-99 instrument (ACTGene, USA), and the A260/A280 nm ratio was determined. DNA quality was confirmed on a 0.8% agarose gel.
The internal transcribed spacer ITS2 nuclear region and the
matK chloroplast region of 105 individuals, belonging to 36 species of
Vicia were tested for their ability to resolve congeneric species and to infer their applicability and efficacy as DNA barcodes. The sequences of the universal primers for ITS2 and
matK regions and general PCR reaction conditions were obtained from previous studies (
Chen et al. 2010). Amplification reactions were carried out in a total volume of 20 μL containing 1× PCR buffer, 0.1 mM primers, 0.2 mM each dNTP, 1 U Taq DNA polymerase, and 200 ng template DNA.
Approximately 1 μg DNA was used to generate a DNA library to use with the Genome Sequencer GSFLX Titanium System (Roche, 454 Life Science, Branford, CT, USA). The DNA fragment ends were polished (blunted), and two short adapters were ligated to both ends according to standard procedures (
Moe et al. 2011). Finally, the quality of this single stranded template DNA library was assessed using a 2100 BioAnalyzer (Agilent, Waldbronn, Germany). The library was quantified to determine the optimal amount needed as input for emulsion-based clonal amplification. Multiplex identifiers were used to specifically tag unique samples in a GS FLX Titanium sequencing run, which were recognized by the GS data analysis software after the sequencing run and provided high confidence for assigning individual sequencing reads to the correct sample.
Sequences of ITS2 and
matK regions were manually edited with MEGA6 (
Tamura et al. 2013) and aligned using the “ClustalW” option. Manual adjustment in the alignment of the nucleotide sequences for the ITS2 region was made to improve alignment. Aligned ITS2 and
matK sequences were evaluated with bootstrap analysis (1000 replicates) (
Felsenstein 1985) and Kimura 2-parameter distances were calculated to construct a neighbor-joining (NJ) dendrogram using the MEGA6 with the program (
Kimura 1980). Aligned ITS and
matK sequences were also used for the maximum parsimony (MP) method. MP trees were obtained using the tree-bisection-regrafting (TBR) algorithm (
Nei and Kumar 2000) with search level 1, in which the initial trees were obtained by the random addition of sequences (10 replicates). MP trees were tested with bootstrap analysis (1000 replicates). All positions containing gaps in the ITS2 and
matK sequences were eliminated. MP analyses were conducted using the program MEGA6 (
Tamura et al. 2013).
RESULTS
We obtained 105 ITS2 and 105 matK sequences from 36 Vicia species, resulting in 210 new sequences. With regard to universality of primers and success of sequence amplification, the proportion at each of the regions was 100% for both the chloroplast matK and nuclear ITS2 region (data not shown). The ClustalW aligned sequence length of ITS2 was 301 bp and the sequence length of matK was 665 bp; the resulting concatenated sequence length of ITS2 and matK was 966 bp. All positions containing gaps and missing data were eliminated. There were a total of 957 positions in the final dataset.
A total of 210 sequences were analyzed from 36
Vicia species in this study. The sequence analysis revealed the average nucleotide frequencies as A = 34.5 ± 0.20%, T = 28.9 ± 0.30%, G = 19.7 ± 0.30, C = 16.9 ± 0.20. The phylogenetic utility of ITS2 and
matK regions is shown in
Table 1. The number of segregating sites was (S) = 314 and nucleotide diversity was (Pi) = 0.0556. Tajma’s statistics was (D) = −1.0021 and it was not significantly (
p<0.01) different among sequences. Kimura 2 Parameter (K2P) genetic distance in
Vicia species is given in
Table S2. The overall K2P distance between the 36 species was 0.060.
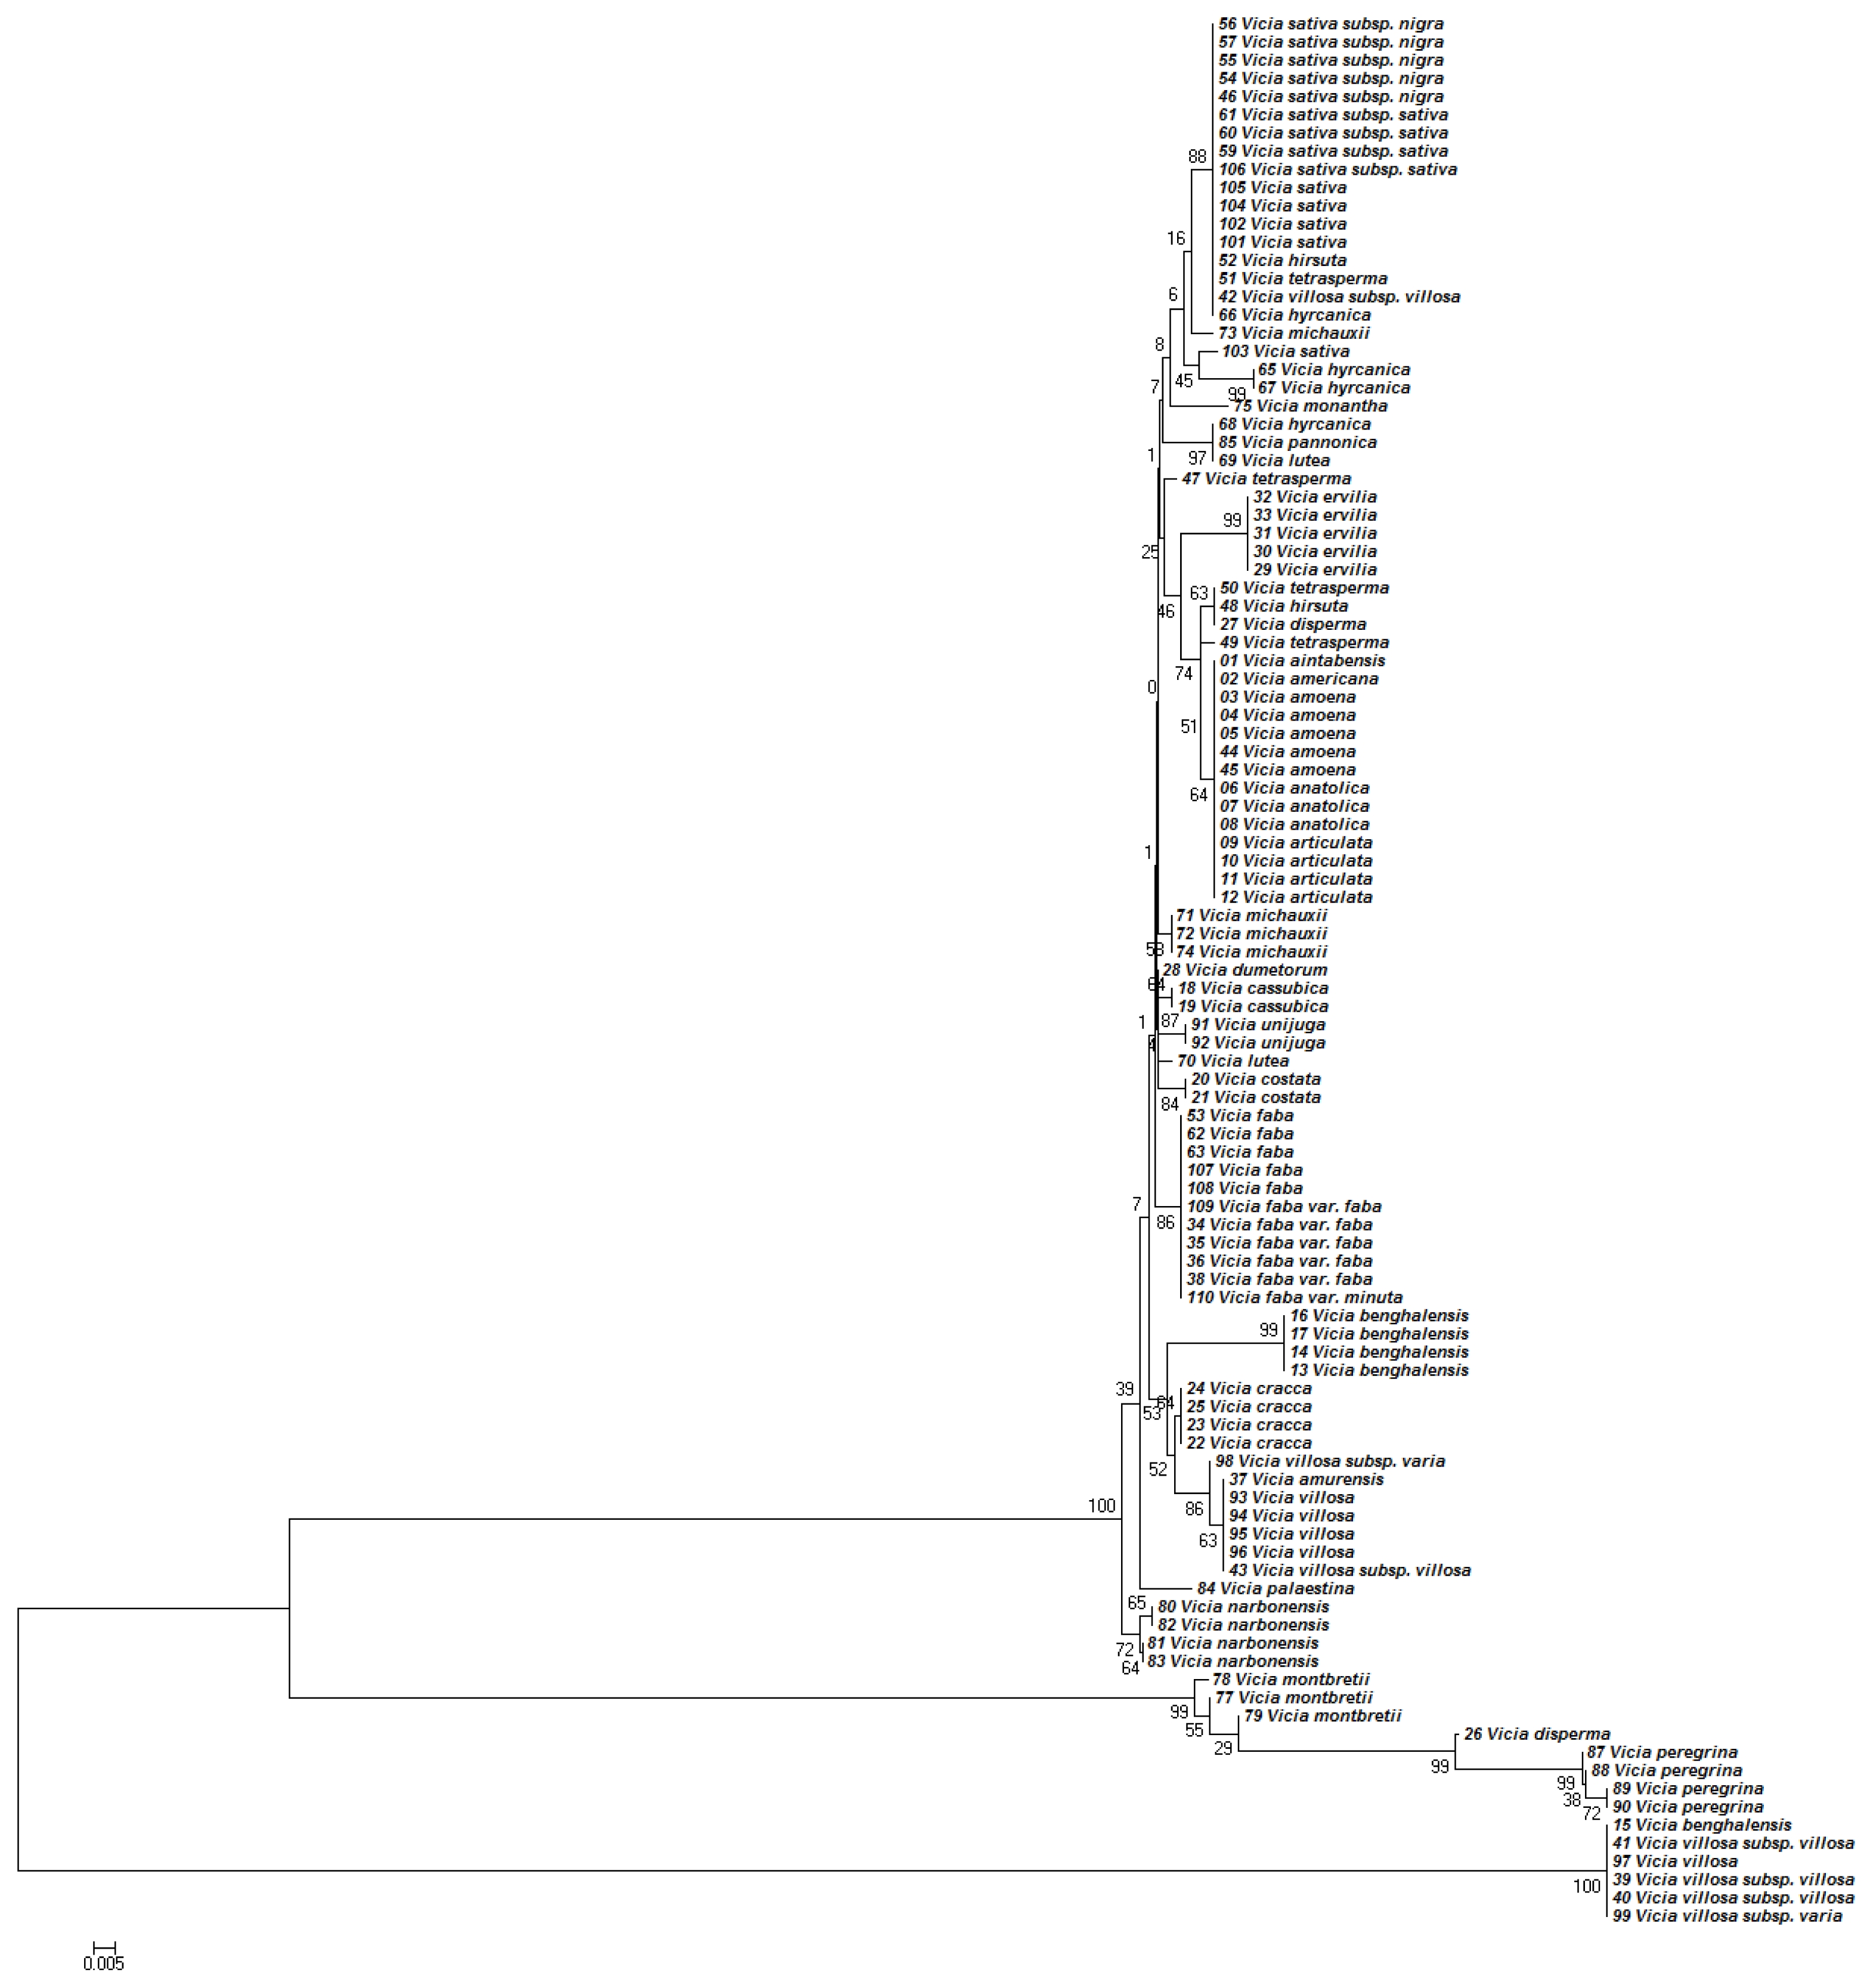
The NJ tree developed using
Kimura (1980) distances based on nucleotide sequences of the ITS2 region had a similar topology as the MP tree, shown in
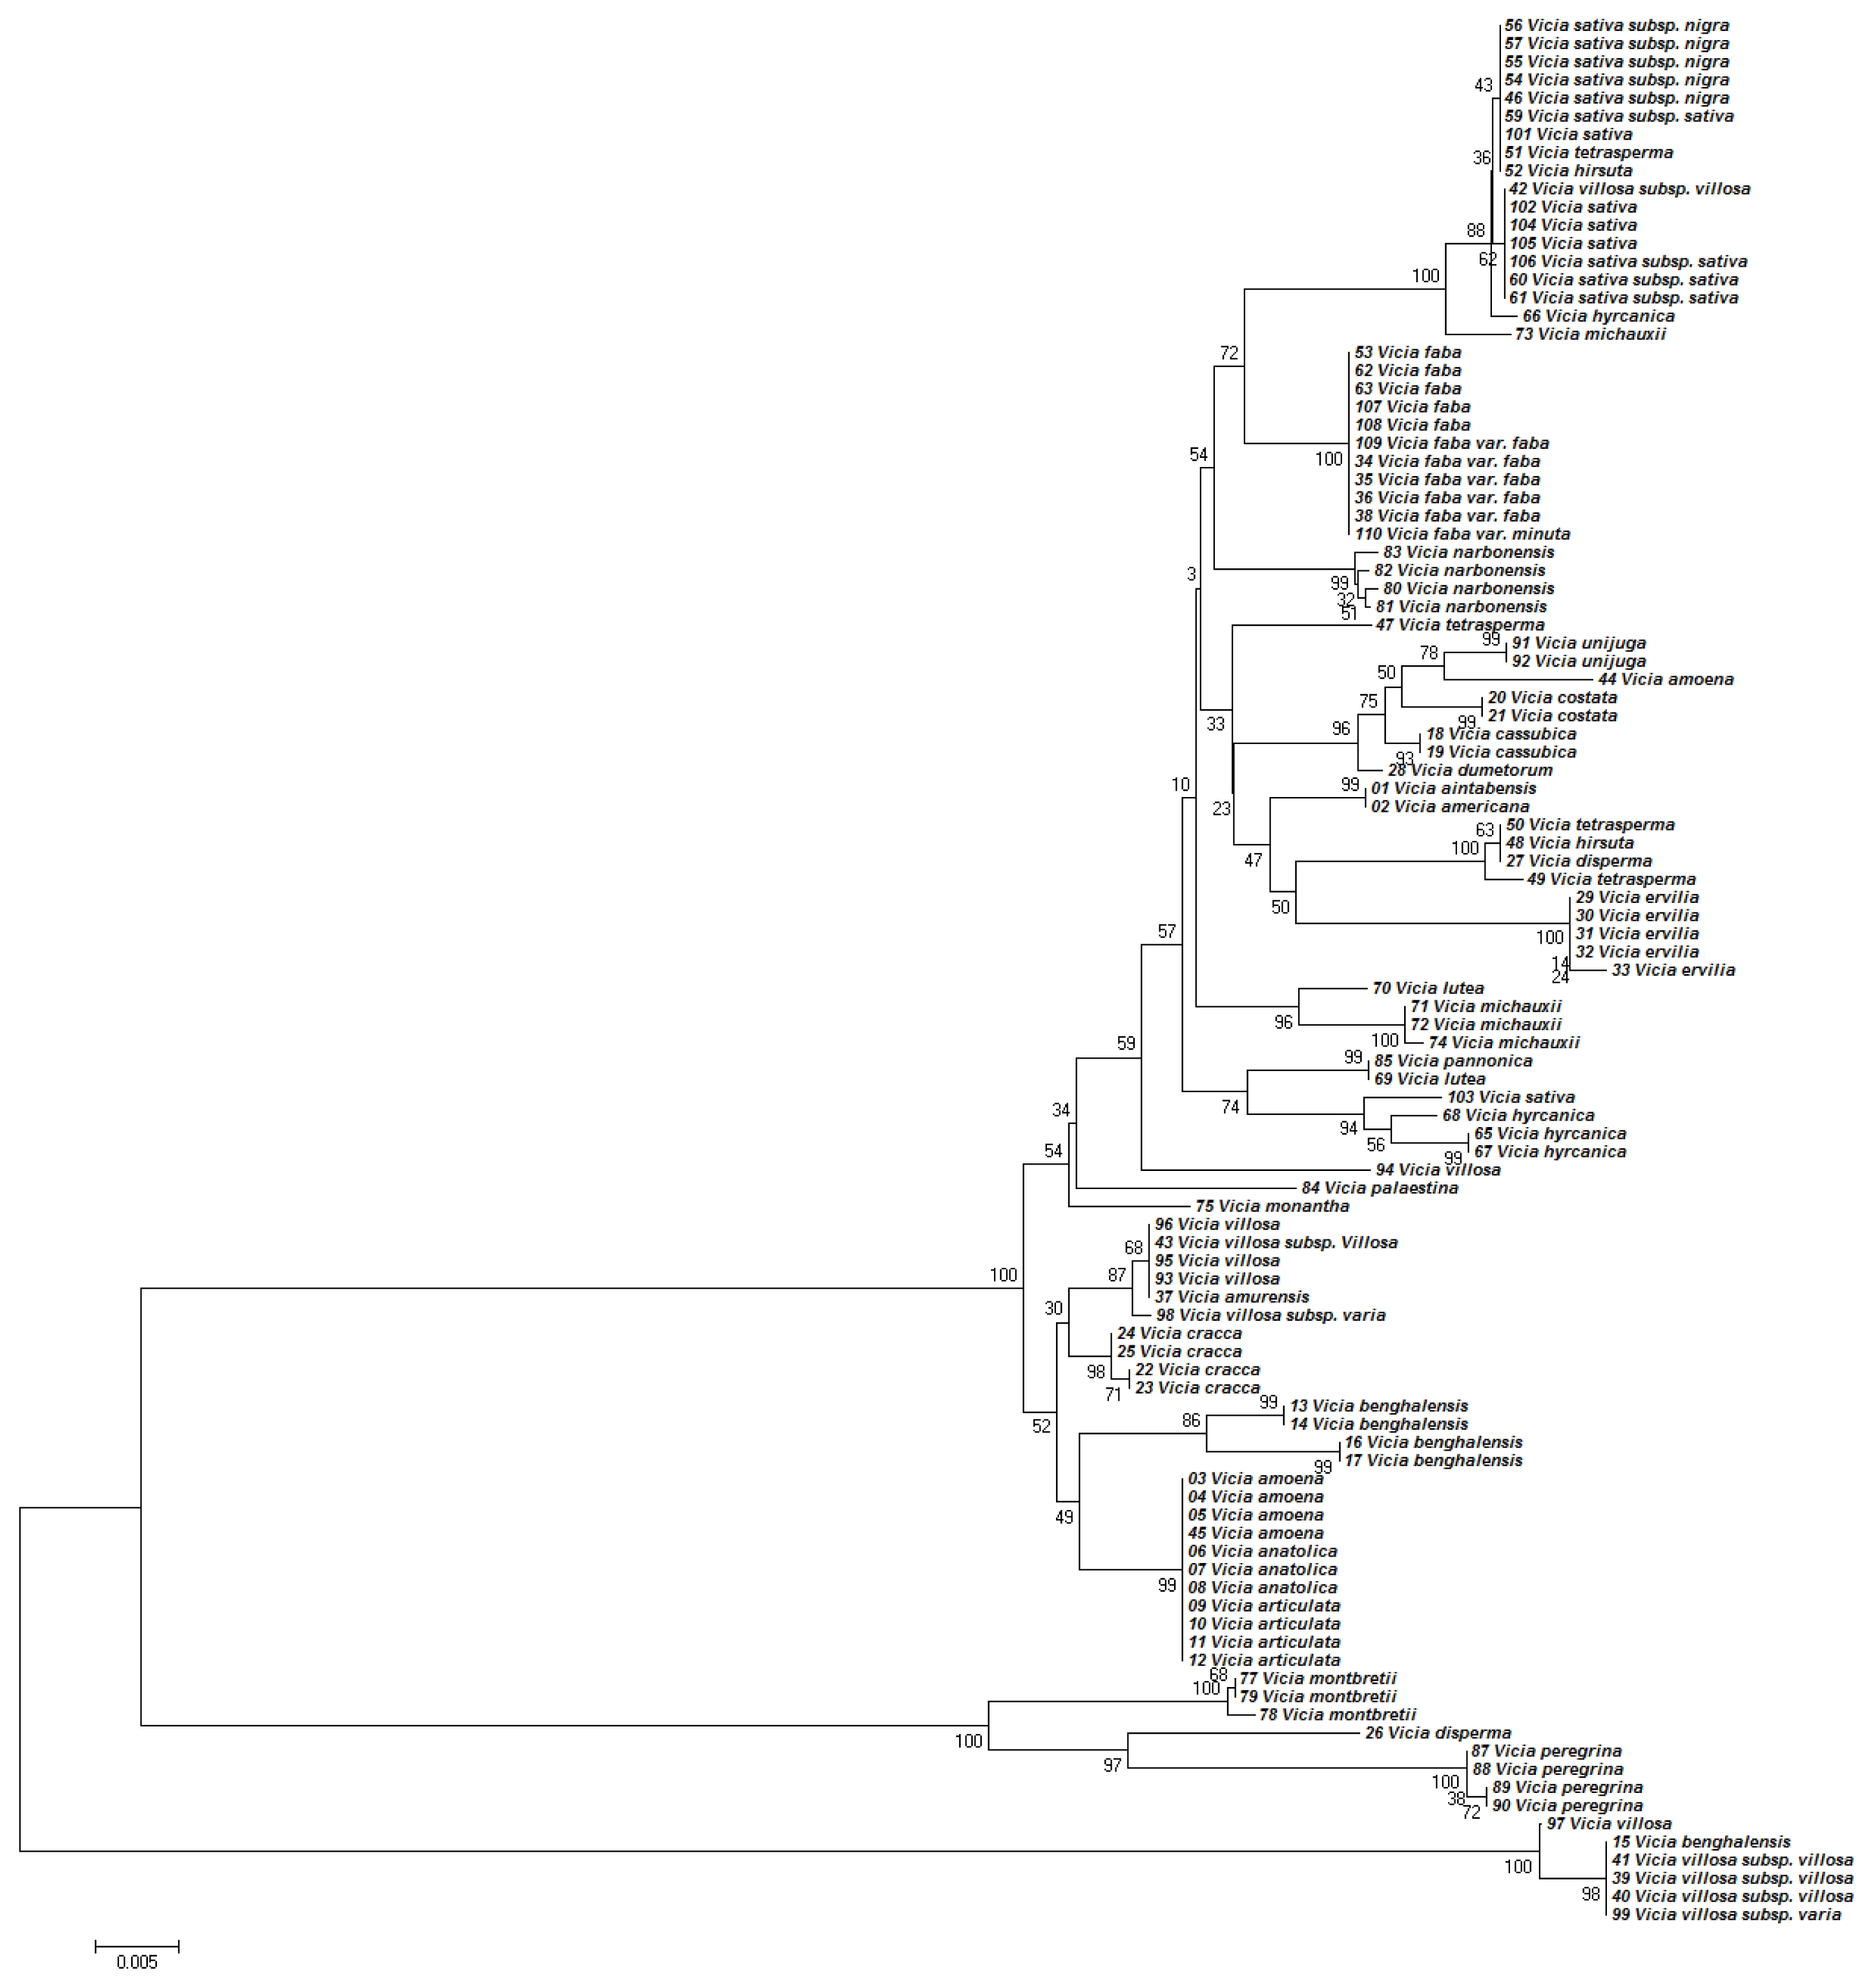
Figure 1. The phylogenetic tree based on the NJ analysis of
Kimura (1980) distances of the nucleotide sequences of the
matK region was topologically similar to the MP tree in
Figure 2. However, trees generated by NJ and MP analyses differed in their branch-length values (data not presented).
Phylogenetic analyses based on the nucleotide sequences of the ITS2 region generally discriminated the
Vicia species (
Fig. 1). Although the ITS2 region separated most of the
Vicia species from each other, some closely related species could not be discriminated (
Fig. 1). For example,
V. aintabensis, V. Americana, V. amoena, V. anatolica, and
V. articulata accessions were located in the same clade without any differences. Phylogenetic analysis of the ITS2 region also demonstrated that, for several species, accessions were located in distant clades, suggesting that there might be mixtures or interspecies variation in the accession. For example, an accession of
V. villosa subsp. villosa was located in a clade with the accessions of
V. sativa (
Fig. 1).
Similarly, the phylogenetic analyses based on the nucleotide sequences of
matK region generally discriminated the
Vicia species (
Fig. 2). Although most of the species were also discriminated by
matK, some closely related species could not be distinguished (
Fig. 2). For example, accessions of
V. anatolica,
V. amoena,
V. articulata,
V. benghalensis, and
V.villosa were placed in the same clade with no clear differences.
matK analysis also confirmed mixtures. For instance, different accessions of
V. hyrcanica and
V. sativa were placed in distant clades.
Topologies of the phylogenetic trees based on concatenated ITS2 and
matK regions were similar, but there were some
Vicia species that were placed in different clades after ITS2 or
matK analysis. For example, ITS2 analysis placed
V. aintabensis and
V. Americana accessions into the same clade of
V. amoena, V. anatolica, and
V. articulata (
Fig. 1). However,
matK analysis placed
V. aintabensis and
V. Americana accessions into different clades (
Fig. 2). Similarly, an accession of
V. hyrcanica (68) was placed into the same clade as
V. hyrcanica accessions, which was misplaced by ITS2 (
Fig. 2). Phylogenetic trees based on concatenated ITS2 and
matK regions have improved the topologies of the phylogenetic tree (
Fig. 3). Although this barcoding region successfully discriminated all 36
Vicia species, the closely related species were not discriminated. For example, concatenated ITS2 and
matK analysis failed to discriminate the closely related species
V. amoena, V. anatolica, and
V. articulata (
Fig. 3).
DISCUSSION
Taxonomy of the genus
Vicia L. has been problematic as the taxonomic history of the genus is extensive and contentious, having 20 major classification of the genus (
Maxted 1993). The high economic importance of the genus
Vicia has led to a large body of studies on the molecular characterization and investigation of phylogenetic relationships among species that belong to this genus. Various studies have been reported for investigation of phylogenetic relationships among species based on rDNA (
Raina and Ogihara 1995), in situ hybridization with repetitive sequences (
Navratilova et al. 2003), RAPD analysis (
Haider et al. 2000;
Sakowicz and Cieslikowski 2006), repetitive DNA sequences as probes (
Frediani et al. 2004), capillary electrophoresis (
Piergiovanni and Taranto 2005), and SDS-PAGE on seed storage proteins (
Mirali et al. 2007). However, none of these could resolve the taxonomic problems.
Previously, the ITS region was suggested for phylogenetic analysis in plants (
Chen et al. 2010;
Gao et al. 2010). Recently, nucleotide sequences of some DNA regions in the chloroplast genome (
matK,
rpoC1 rpoB,
trnH-PsbA rbcL,
atpF-atpH, and
psbK-psbI) and their combinations were tested as potentials for barcoding plant species (
Starr et al. 2009). Among these regions,
matK and
rbcL were accepted as a 2-locus DNA barcode by the CBOL Plant Working Group (
Group et al. 2009). In this study, the potential use of ITS2 nucleotide sequences combined with
matK was tested as a two-locus DNA barcode for discrimination of the
Vicia species. According to our results, ITS2 and
matK regions were both easy to amplify with PCR. Species resolution of both DNA regions was similar because the topologies of trees of ITS2 and
matK were similar. Both DNA regions generally separated sections in
Vicia. However, several species could not be discriminated from each other by either ITS2 or
matK regions alone. It was reported that the ITS region requires cloning before sequencing because of the allelic polymorphisms, pseudogenes, and paralogous copies of the ITS region in a plant species (
Bailey et al. 2003;
King and Roalson 2008). However, there was no allelic polymorphism or insertion/deletion in the
matK region within the chloroplast genome of
Vicia species. Therefore, we were able to efficiently amplify and sequence-characterize the
matK region without cloning.
Phylogenetic relationships among
Vicia species based on both ITS2 analyses were in agreement with the previous studies using the ITS region (
Shiran et al. 2014). Genetic relationships among 49
Vicia species were recently analyzed using the polymorphisms within the region of nrDNA which comprises both internal transcribed spacers, ITS1 and ITS2. The sequence data obtained for ITS2 and
matK were used to discriminate the species used. However, the dendrogram did not indicate any clear division among the
Vicia accessions. Although it did not perform well in the strict sense, it can still be used to discriminate both
V. faba, V. sativa, V. ervilia, and
V. benghalensis. Chung et al. (2013) reported a cluster analysis of
V.
sativa subsp.
sativa in which no clear clustering pattern of geographically close accessions was observed, indicating that the association between genetic similarity and geographical distance was of low significance. The placement of the other species used in this study in the phylogenetic tree cannot be directly compared with placements made in other studies owing to the methods used to construct the tree. Thus our results suggest that ITS2 and
matK could make a significant contribution to resolving phylogeny at multiple taxonomic levels from generic relationships within
Vicia species.
Supplementary Information
ACKNOWLEDGMENTS
This study was carried out with the support of the “Research Program for Agricultural Science & Technology Development (Project No. PJ008623)” and was supported by the 2014 Postdoctoral Fellowship Program of National Academy of Agricultural Science, Rural Development Administration, Korea.
Fig. 1Phylogenetic analysis of 36 Vicia species based on the nucleotide sequences of the ITS2 region. The NJ tree was developed using Kimura 2-parameter method on nucleotide sequences of the ITS2 region. Numbers next to the branches are the bootstrap test values.

Fig. 2Phylogenetic analysis of 36 Vicia species based on the nucleotide sequences of the matK region. The NJ tree was developed using the Kimura 2-parameter method on nucleotide sequences of the matK region. Numbers next to the branches are the bootstrap test values.
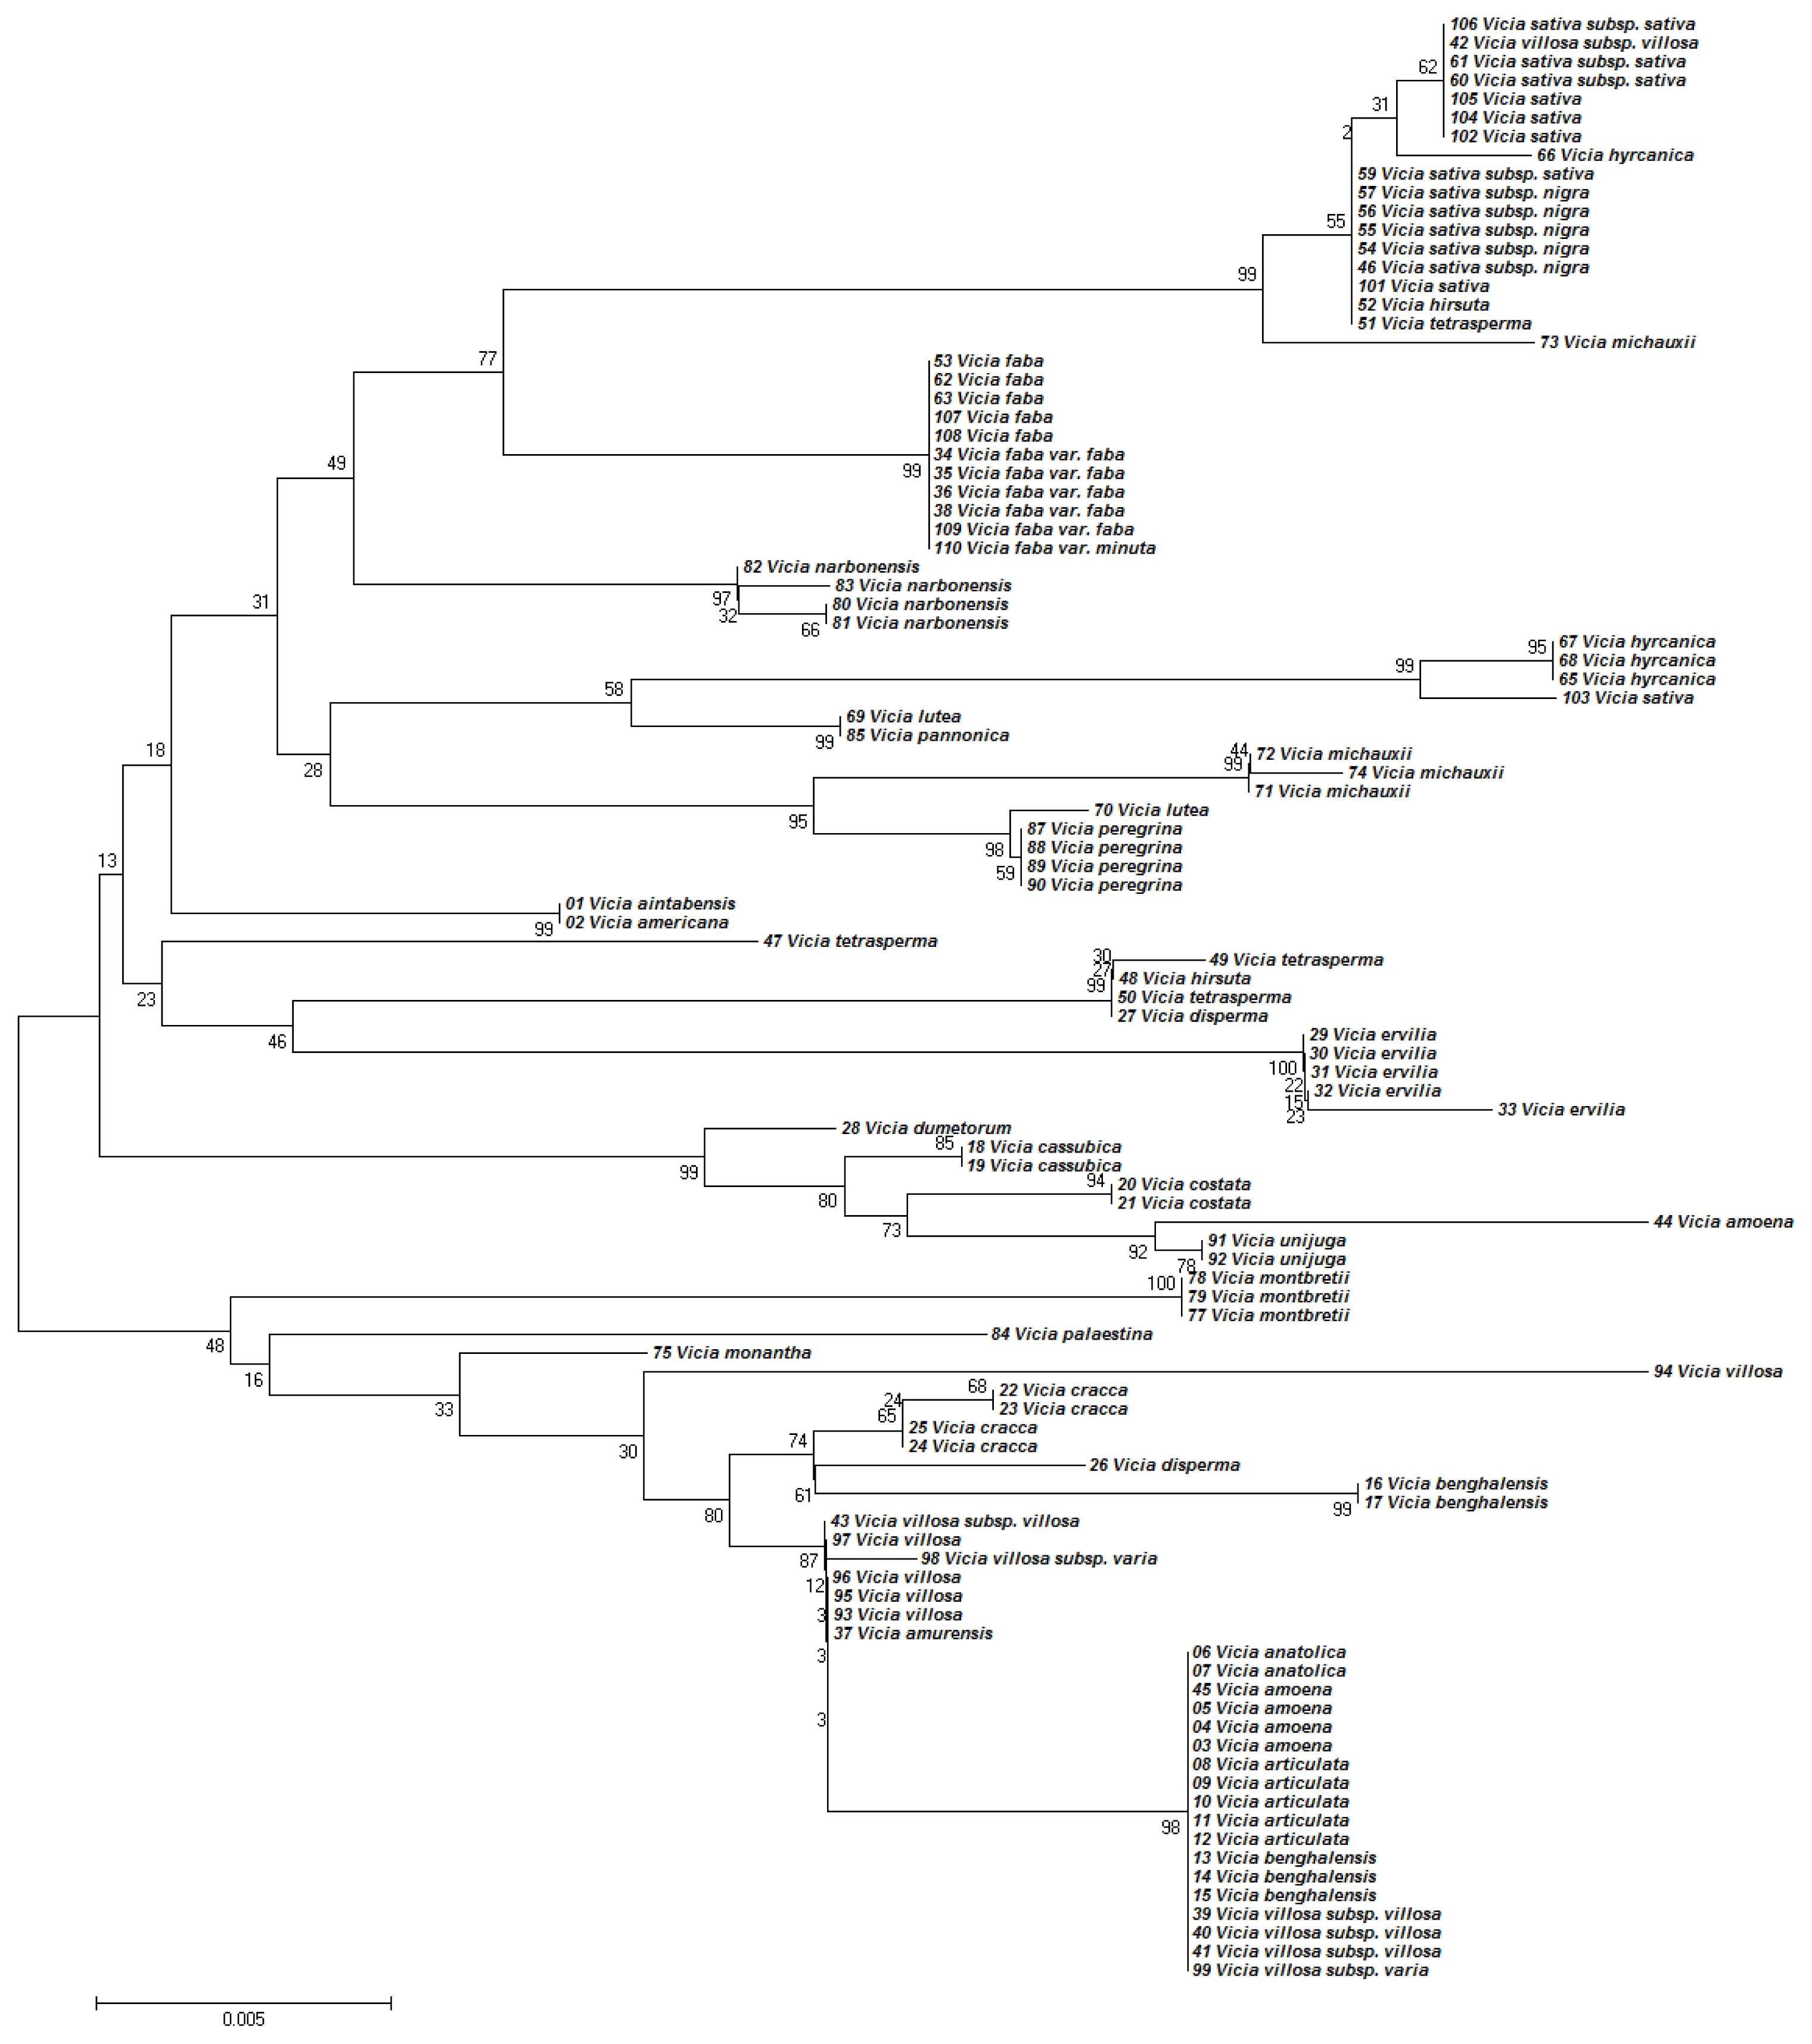
Fig. 3Phylogenetic analysis of 36 Vicia species based on the nucleotide sequences of the ITS2 and matK region. The NJ tree was developed using the Kimura 2-parameter method on nucleotide sequences of the ITS2 and matK region. Numbers next to the branches are the bootstrap test values.

Table 1Phylogenetic utility of ITS2 and matK regions.
Table 1
|
ITS2 |
matK
|
ITS2 + matK
|
|
Individuals (n) |
105 |
105 |
210 |
|
Aligned length (bp) |
301 |
665 |
966 |
|
Nucleotide diversity (Pi) |
0.1133 |
0.0296 |
0.05563 |
|
Variable sites |
187 |
127 |
314 |
|
Informative sites |
181 |
101 |
282 |
|
Tajima’D |
−1.0293 |
−0.9271 |
−1.0021 |
References
- Anderson JW, Smith BM, Washnock CS. 1999. Cardiovascular and renal benefits of dry bean and soybean intake. Am J Clin Nutr. 70(3): 464s-474s.
- Arianoutsou M, Thanos CA. 1996. Legumes in the fire-prone Mediterranean regions: An example from Greece. Int J Wildland Fire. 6(2): 77-82.
- Bailey CD, Carr TG, Harris SA, Hughes CE. 2003. Characterization of angiosperm nrDNA polymorphism, paralogy, and pseudogenes. Mol Phylogenet Evol. 29(3): 435-455.
- Bellemain E, Carlsen T, Brochmann C, Coissac E, Taberlet P, Kauserud H. 2010. ITS as an environmental DNA barcode for fungi: an in silico approach reveals potential PCR biases. Bmc Microbiol. 10: 189
- Chase MW, Cowan RS, Hollingsworth PM, van den Berg C, Madrinan S, Petersen G, Seberg O, Jorgsensen T, Cameron KM, Carine M, et al. 2007. A proposal for a standardised protocol to barcode all land plants. Taxon. 56(2): 295-299.
- Chen SL, Yao H, Han JP, Liu C, Song JY, Shi LC, Zhu YJ, Ma XY, Gao T, Pang XH, Luo K, Li Y, Li XW, Jia XC, Lin YL, Leon C. 2010. Validation of the ITS2 Region as a Novel DNA Barcode for Identifying Medicinal Plant Species. Plos One. 5: E8613
- Chung JW, Kim TS, Suresh S, Lee SY, Cho GT. 2013. Development of 65 Novel Polymorphic cDNA-SSR Markers in Common Vetch (Vicia sativa subsp sativa) Using Next Generation Sequencing. Molecules. 18: 8376-8392.
- Felsenstein J. 1985. Confidence limits on phylogenies: An approach using the bootstrap. Evolution. 39: 783-791.
- Frediani M, Maggini F, Gelati MT, Cremonini R. 2004. Repetitive DNA sequences as probes for phylogenetic analysis in Vicia genus. Caryologia. 57: 379-386.
- Gao T, Yao H, Song J, Liu C, Zhu Y, Ma X, Pang X, Xu H, Chen S. 2010. Identification of medicinal plants in the family Fabaceae using a potential DNA barcode ITS2. Journal of Ethnopharmacology. 130: 116-121.
- Gregory TR. 2005. DNA barcoding does not compete with taxonomy. Nature. 434: 1067-1067.
- Group CPW, Hollingsworth PM, Forrest LL, Spouge JL, Hajibabaei M, Ratnasingham S, van der Bank M, Chase MW, Cowan RS, Erickson DL, et al. 2009. A DNA barcode for land plants. Proceedings of the National Academy of Sciences. 106: 12794-12797.
- Haider A, Hassanin BR, Mahmoud N, Madkour M. 2000. Molecular characterization of some species of the genus Vicia. Arab Council for Graduate Studies and Scientific Research. Cairo.
- Hollingsworth PM, Graham SW, Little DP. 2011. Choosing and Using a Plant DNA Barcode. Plos One. 6: e19254
- Hosseinzadeh Z, Pakravan M, Tavassoli A. 2008. Micro-morphology of seed in some Vicia species from Iran. Rostaniha. 9: 96-107.
- Jaaska V. 2005. Isozyme Variation and Phylogenetic Relationships in Vicia subgenus Cracca (Fabaceae). Ann Bot-London. 96: 1085-1096.
- Kimura M. 1980. A simple method for estimating evolutionary rates of base substitutions through comparative studies of nucleotide sequences. Journal of molecular evolution. 16: 111-120.
- King MG, Roalson EH. 2008. Exploring evolutionary dynamics of nrDNA in Carex subgenus Vignea (Cyperaceae). Syst Bot. 33: 514-524.
- Kress WJ, Erickson DL. 2007. A Two-Locus Global DNA Barcode for Land Plants: The Coding rbcL Gene Complements the Non-Coding trnH-psbA Spacer Region. Plos One. 2: e508
- Li DZ, Gao LM, Li HT, Wang H, Ge XJ, Liu JQ, Chen ZD, Zhou SL, Chen SL, Yang JB, Fu CX, Zeng CX, et al. 2011. Comparative analysis of a large dataset indicates that internal transcribed spacer (ITS) should be incorporated into the core barcode for seed plants. P Natl Acad Sci USA. 108: 19641-19646.
- Maxted N. 1993. A Phenetic Investigation of Vicia L Subgenus Vicia (Leguminosae, Vicieae). Bot J Linn Soc. 111: 155-182.
- Maxted N, Callimassia MA, Bennett MD. 1991. Cytotaxonomic Studies of Eastern Mediterranean Vicia Species (Leguminosae). Plant Syst Evol. 177: 221-234.
- Mirali N, El-Khouri S, Rizq F. 2007. Genetic diversity and relationships in some Vicia species as determined by SDS-PAGE of seed proteins. Biol Plantarum. 51: 660-666.
- Moe KT, Chung JW, Cho YI, Moon JK, Ku JH, Jung JK, Lee J, Park YJ. 2011. Sequence Information on Simple Sequence Repeats and Single Nucleotide Polymorphisms through Transcriptome Analysis of Mungbean. J Integr Plant Biol. 53: 63-73.
- Navratilova A, Neumann P, Macas J. 2003. Karyotype analysis of four Vicia species using in situ hybridization with repetitive sequences. Ann Bot-London. 91: 921-926.
- Nei M, Kumar S. 2000. Molecular Evolution and Phylogenetics. Oxford University Press. New York: pp. 3.
- Perrino P. 1988. The diversity inVavilov’s Mediterranean Gene Center. Die Kulturpflanze. 36: 85-105.
- Piergiovanni AR, Taranto G. 2005. Specific differentiation in Vicia genus by means of capillary electrophoresis. J Chromatogr A. 1069: 253-260.
- Raina SN, Ogihara Y. 1995. Ribosomal DNA Repeat Unit Polymorphism in 49 Vicia Species. Theor Appl Genet. 90: 477-486.
- Sakowicz T, Cieslikowski T. 2006. Phylogenetic analyses within three sections of the genus Vicia. Cell Mol Biol Lett. 11: 594-615.
- Schultz J, Maisel S, Gerlach D, Muller T, Wolf M. 2005. A common core of secondary structure of the internal transcribed spacer 2 (ITS2) throughout the Eukaryota. Rna. 11: 361-364.
- Shiran B, Kiani S, Sehgal D, Hafizi A, ul-Hassan T, Chaudhary M, Raina SN. 2014. Internal transcribed spacer sequences of nuclear ribosomal DNA resolving complex taxonomic history in the genus Vicia L. Genet Resour Crop Ev. 61: 909-925.
- Starr JR, Naczi RF, Chouinard BN. 2009. Plant DNA barcodes and species resolution in sedges (Carex, Cyperaceae). Molecular ecology resources. 9: 151-163.
- Tamura K, Stecher G, Peterson D, Filipski A, Kumar S. 2013. MEGA6: Molecular Evolutionary Genetics Analysis Version 6.0. Mol Biol Evol. 30: 2725-2729.
- Velazquez ER, Silva L, Alvaro P. 2010. Legumes: a healthy and ecological source of flavonoids. Curr Nutr Food Sci. 6: 109-144.
- Vijayan K, Tsou CH. 2010. DNA barcoding in plants: taxonomy in a new perspective. Curr Sci India. 99: 1530-1541.
- Yao H, Song JY, Liu C, Luo K, Han JP, Li Y, Pang XH, Xu HX, Zhu YJ, Xiao PG, Chen SL. 2010. Use of ITS2 Region as the Universal DNA Barcode for Plants and Animals. Plos One. 5: e13102