Abstract
DNA barcoding is the use of short DNA sequences of the genome for large scale species identification. The Consortium for the Barcode of Life (CBOL) plant-working group recommended a 2-locus combination as the standard plant barcode. The evolutions of the chloroplast regions combined with nuclear gens are sufficiently rapid to allow discrimination between closely related species. We evaluated the efficacy of the proposed plant barcoding loci, matK, along with ITS2 for barcoding the Vigna species. To assess the discriminatory ability of barcoding loci for identifying the Vigna species, we sampled 52 of the taxonomically best known groups in the genus. Topologies of the phylogenetic trees based on ITS2 and matK analyses were similar but a few accessions were placed into distant phylogenetic groups. Neither ITS2 nor matK analyses were able to discriminate some closely related Vigna species. Thus, we used concatenated data to increase the resolving power of ITS2 and used matK as an additional tool for phylogenetic analysis in Vigna because characterization of the nucleotide sequences of the matK region was easier and more cost-effective than that of the ITS region.
-
Key words: Vigna, rDNA-ITS2, matK, phylogenetic analysis, species identification
INTRODUCTION
Legumes (Fabaceae) are the third largest flowering family and are second only to cereals in their importance for human nutrition. Archaeological evidence suggests that the Mediterranean region is the principal center of origin for legumes (
Perrino 1988). Legumes are inexpensive, nutrient-dense and high-quality sources of protein that can be substituted for dietary animal protein (
Anderson et al. 1999). Legumes also produce a high diversity of secondary metabolites that serve as medicinal, nutraceuticals and eco-friendly by-products such as tannins, gums, insecticides, resins, varnish, paints, dyes and biodiesel. There is renewed interest in grain legumes for their use in animal feed. Equally important is the role of legumes in sustainable agriculture: they can fix soil nitrogen via symbiotic nitrogen-fixation and play an important role as a rotation crop with cereal grain and vegetable crops (
Arianoutsou and Thanos 1996;
Velazquez et al. 2010).
The genus Vigna belongs to the Fabaceae family and is divided into seven subgenera, with over 150 species distributed throughout the tropics. Cultivated Vigna species are food legumes that have great economic importance throughout the world, especially in developing countries (Smartt 1990). The traditional phenotypic characterization of these species was limited because of weak morphological differentiation. The morphological markers were not quite enough to expose the genetic diversity and do not reflect real genetic relationships. Several DNA marker systems are now commonly used in diversity studies of plants, the most commonly used marker systems are restriction fragment length polymorphism (RFLP) (Soller and Beckmann, 1983), random amplified polymorphic DNA (RAPD) (Williams et al. 1990), amplified fragment length polymorphism (AFLP) (Vos et al., 1995), intersimple sequence repeats (ISSRs) (Zietkiewicz et al. 1994) and microsatellites or simple sequence repeats (SSRs) (Becker and Heun, 1994).
Recently, DNA barcoding has been used to identify specific regions of the plant genome that can be sequenced routinely in diverse sample sets, resulting in easily comparable data that enable species to be distinguished from one another (
Chen et al. 2010). Many recent papers have reviewed DNA barcoding in plants (
Vijayan and Tsou 2010;
Hollingsworth et al. 2011). A number of single locus and combined loci have been proposed as barcodes for DNA barcoding (
Chase et al. 2007;
Kress and Erickson 2007). Subsequently, a number of loci in the chloroplast genome have been tested for barcoding and combinations of
rbcL and
matK have been proposed as preferred plant barcoding loci (
Group et al. 2009). Similarly, researchers reported that ITS regions in the nuclear genome also had potential for taxonomic classification and phylogenetic reconstruction (
Schultz et al. 2005;
Yao et al. 2010;
Bellemain et al. 2010). Because of sufficient variation in the primary sequences and secondary structures of the ITS2 region, a combination with this locus is considered efficient for plant barcoding. Hence, the China Plant BOL Group proposed the addition of nuclear ITS2 to the
matK +
rbcL combination as a plant barcode (
Li et al. 2011). In the present study, we therefore evaluated the use of a nuclear region ITS2 along with a chloroplast region
matK for the discrimination of
Vigna species.
MATERIALS AND METHODS
Plant Material and DNA extraction
Seeds of genebank accessions (a total of 149 accessions) belonging to 52 species of
Vigna were provided by the Genetic resource center of the National Academy of Agricultural Science, Rural Development Administration, Republic of Korea (
Table S1). To determine which of a subset of proposed barcoding loci are necessary to resolve
Vigna species, we sampled a total of 149 accessions that contained two to three individual accessions. Seeds were germinated and leaf tissue was harvested from 3 week old seedlings in the greenhouse. Total DNA was extracted using the DNeasy® Plant Mini kit (Qiagen, Valencia, CA, USA) according to the manufacturer’s instructions. Fresh leaf tissue from each accession was used for each extraction and was ground well in liquid nitrogen. DNA was resuspended in 100 μL water, diluted to 10 ng/μL and stored at either −20°C or −80°C. Genomic DNA was quantified using a Nanodrop/UVS-99 instrument (ACTGene, USA), and the A260/A280 nm ratio was determined. DNA quality was confirmed on a 0.8% agarose gel.
The sequences of universal primers for ITS2 and
matK regions as well as general PCR reaction conditions were obtained from previous studies (
Chen et al. 2010). Amplification reactions were carried out in a total volume of 20 μL containing 1× PCR buffer, 0.1 mM primers, 0.2 mM of each dNTP, 1 U Taq DNA polymerase and 200 ng template DNA. Approximately 1 μg DNA was used to generate a DNA library for use with the Genome Sequencer GSFLX Titanium System (Roche, 454 Life Science, Branford, CT, USA). The DNA fragment ends were polished (blunted), and two short adapters were ligated to both ends according to standard procedures (
Moe et al. 2011). Finally, the quality of this single stranded template DNA library was assessed using a 2100 BioAnalyzer (Agilent, Waldbronn, Germany). The library was quantified to determine the optimal amount needed as input for emulsion-based clonal amplification. Multiplex identifiers were used to specifically tag unique samples in a GS FLX Titanium sequencing run, which were recognized by the GS data analysis software after the sequencing run and provided high confidence for assigning individual sequencing reads to the correct sample.
Sequences of ITS2 and
matK regions were manually edited with MEGA6 (
Tamura et al. 2013) and the sequences were aligned using the “ClustalW” option. Manual adjustment in the alignment of the nucleotide sequences for the ITS2 region was made to improve alignment. Aligned ITS2 and
matK sequences were evaluated with bootstrap analysis (1000 replicates) (
Felsenstein 1985) and Kimura-2-parameter distances (
Kimura 1980) were calculated to construct a neighbor-joining (NJ) dendrogram using the MEGA6 (
Tamura et al. 2013).
RESULTS
We employed molecular markers to test the discriminatory power of each DNA barcode region. Genomic DNA extracted from
Vigna samples and typical PCR amplicons obtained for the DNA barcodes used here are shown in
Table 1. Amplification of ITS2 and
matK DNA barcodes for all
Vigna populations analyzed here yielded alignments of 413 and 469 bp, and the resulting concatenated sequence length of ITS2 and
matK was 882 bp. We obtained 149 ITS2 and 149
matK sequences from 52
Vigna species, resulting in 298 new sequences. All 52 individuals in each population were found to be 100% identical at the DNA level. All positions containing gaps and missing data were eliminated. There were a total of 277 positions in the final dataset.
A total of 298 sequences were analyzed from 52
Vigna species in this study. Sequence analysis revealed the average nucleotide frequencies as A = 23.3 ± 1.50 %, T = 25.4 ± 4.70 %, G = 28.5 ± 1.60 %, C = 22.8 ± 3.40 %. The phylogenetic utility of ITS2 and
matK regions is shown in
Table 1. The number of segregating sites (S) = 277 and the nucleotide diversity (Pi) = 0.196706. Tajma’s statistics (D) = 0.329429 and it was not significantly (
p<0.01) different among sequences. The Kimura 2 Parameter (K2P) genetic distance in
Vigna species is given in
Table S2. The overall K2P distance between the 52 species was 0.240.
An un-rooted phylogenetic tree constructed by NJ based on ITS2 sequence data is presented in
Figure S1. The phylogenetic analyses based on the ITS2 region generally discriminated the
Vigna species. The 149 accessions analyzed in this study were placed into six Groups (I–VI) supported by high bootstrap values. Four
Vigna species analyzed (
V.reticulate, V. frutescens, V. heterophylla and
V. vexillata varieties) were placed in Group I. Species and subspecies of
V. friesiorum and
V. membranacea were placed in Group II.
V. schimperi formed a distant Group III. Five
Vigna species (
V. unguiculata, V. radiate, V. lobatifolia, V. angivensis, and
V. vexillata) and their subspecies were placed in Group IV. Six
Vigna species (
V. hosei, V. racemose, V. fischeri, V. oblongifolia, V. marina, and
V. luteola) and their varieties formed Group V. The remaining
Vigna species and their subspecies were grouped together with a 66% bootstrap value as Group VI. Within Group VI, there were three subclades supported by high bootstrap values.
Similarly, phylogenetic analyses based on the nucleotide sequences of
matK region generally discriminated the
Vigna species (
Fig. S2). The 149 accessions analyzed in this study were placed into distant clades if they were not supported by high bootstrap values (
Fig. S2). The
matK sequences separated most of the species in the species
Vigna from each other but some closely related species could not be discriminated.
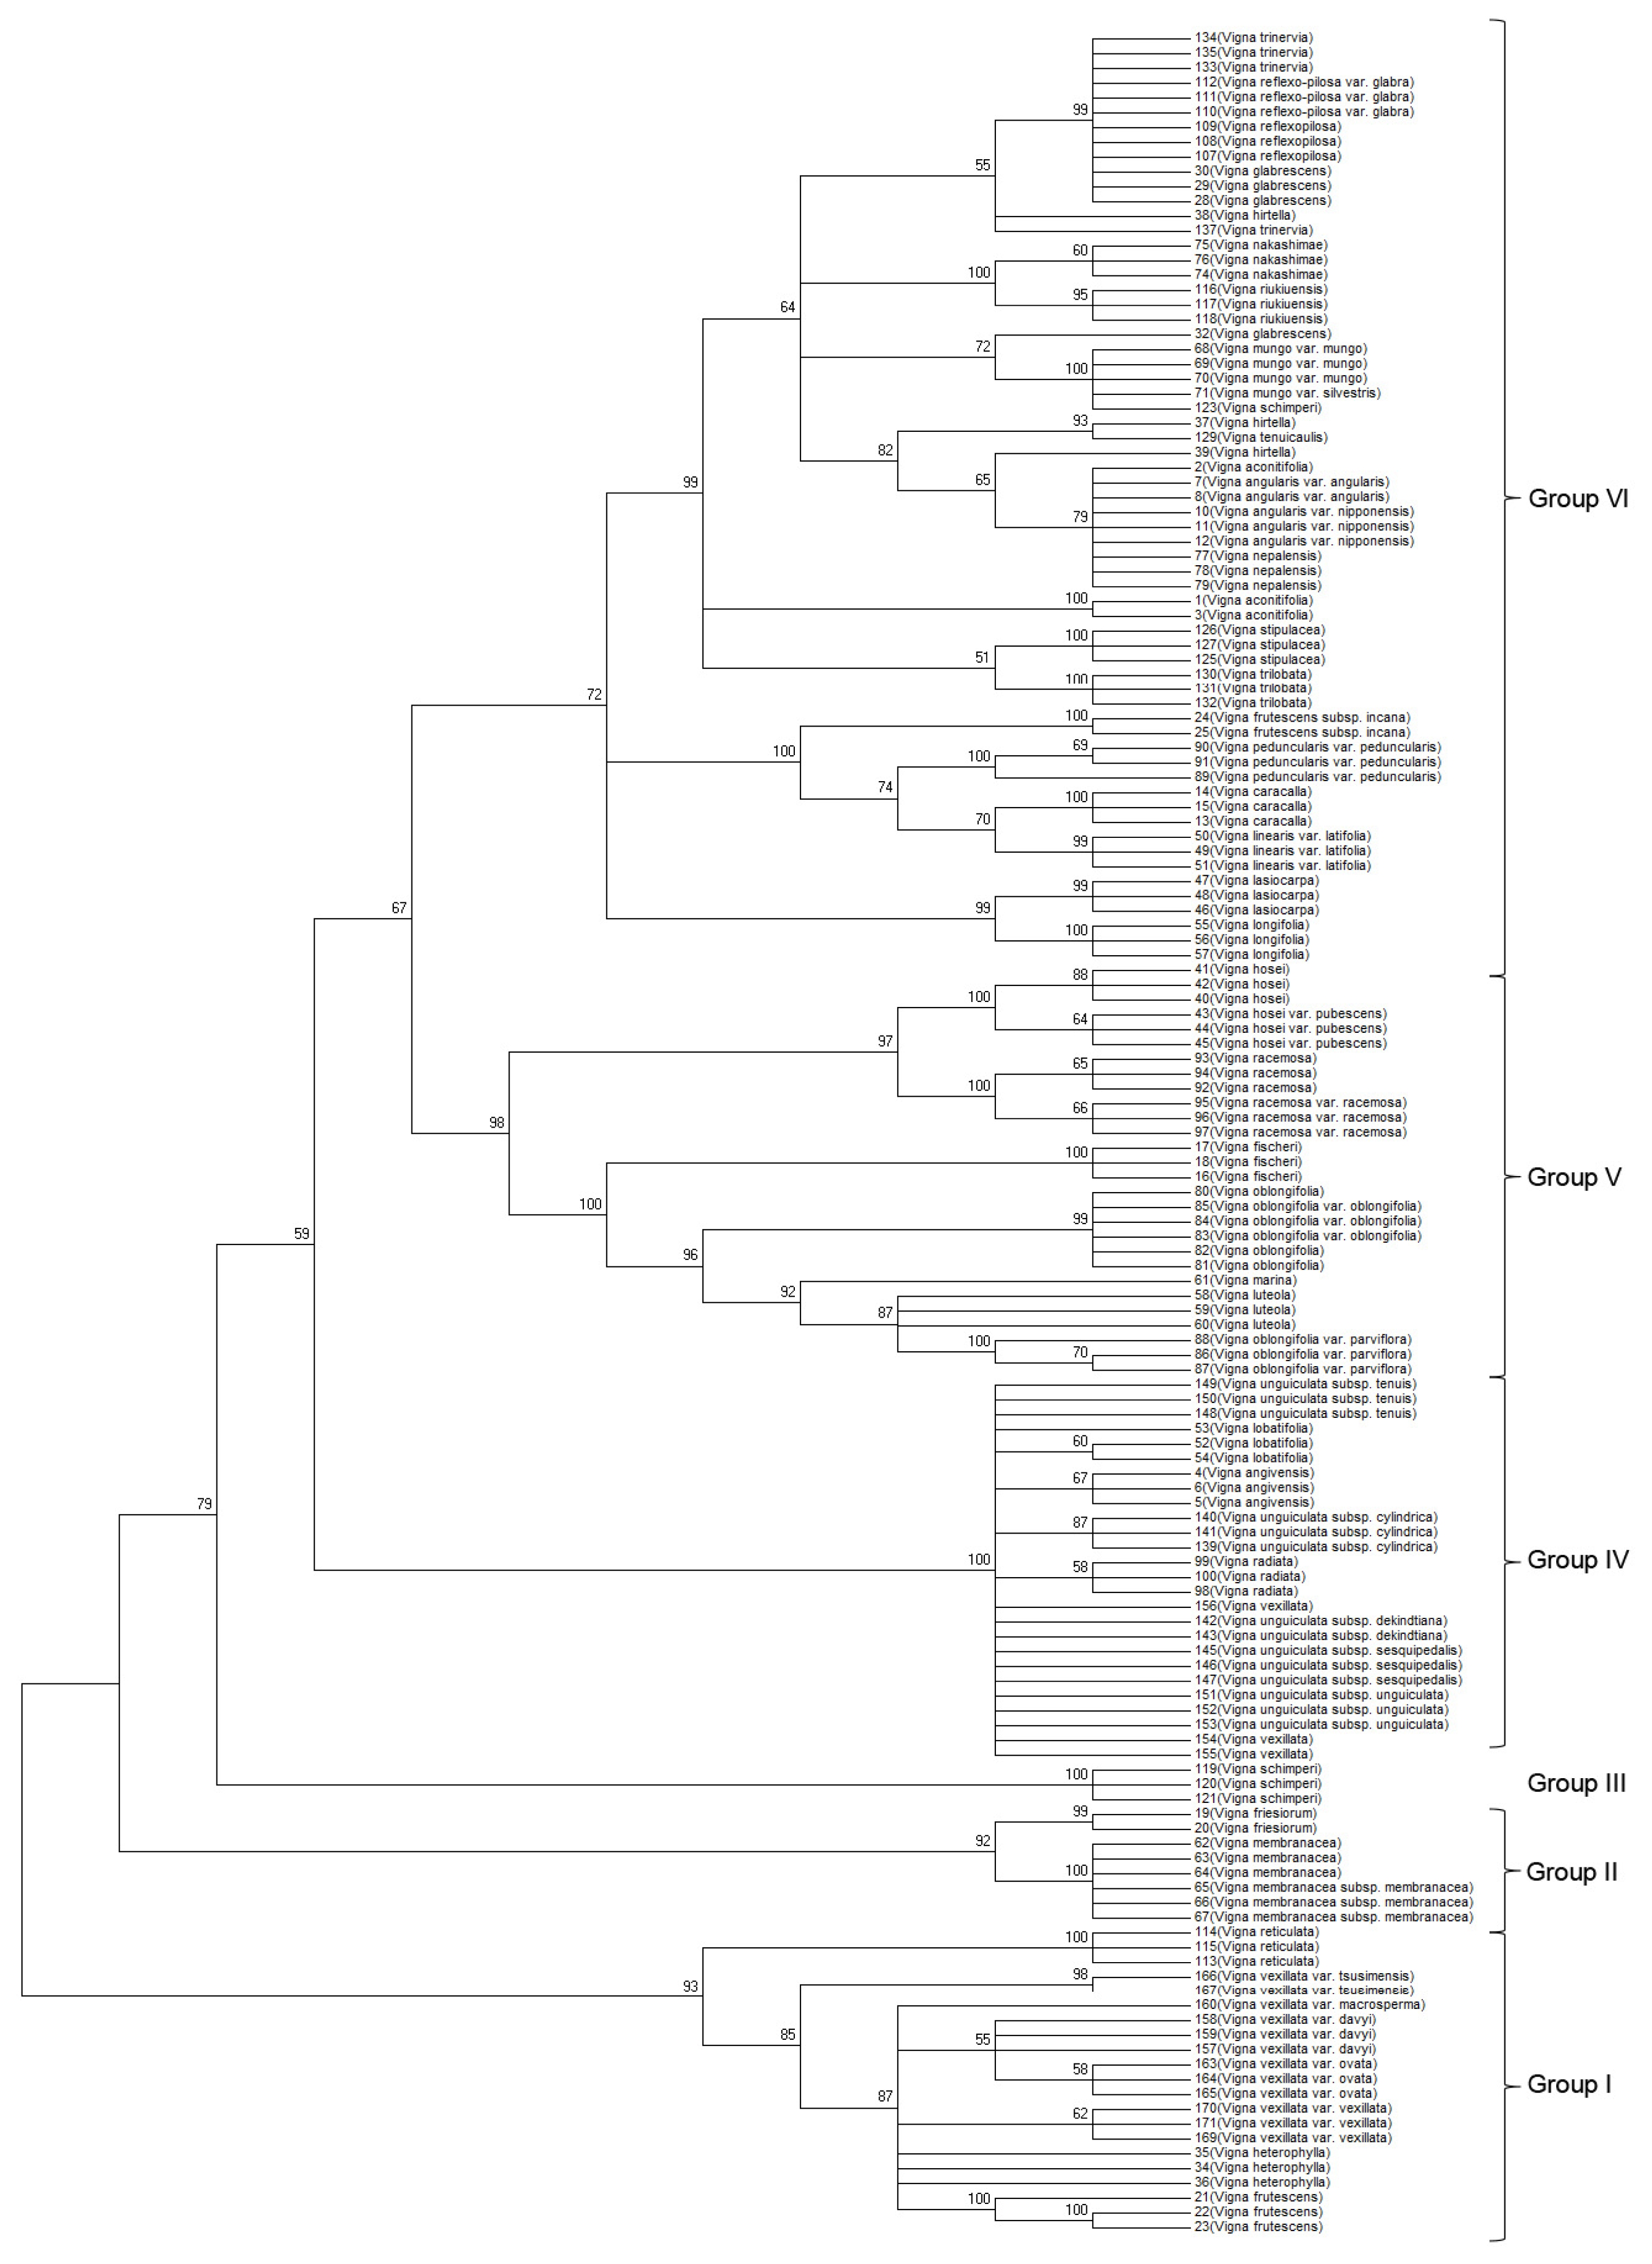
A neighbor-joining (NJ) phylogenetic tree was developed based on the concatenated ITS2 and
matK sequences. The topologies of the phylogenetic NJ tree were similar (
Fig. 1). Bootstrap values for all nodes ranged between 59 to 100%, with one short branch within a clade retaining a 57% bootstrap value in the NJ tree. Similar to ITS2, the concatenated sequences based NJ tree separated the 52 analyzed
Vigna species into six groups (I–VI): (i) group I contained
V.reticulate, V. frutescens, and
V. heterophylla and
V. vexillata verities, (ii) group II included species and subspecies of
V. friesiorum and
V. membranacea, (iii) group III comprised
V. schimperi as a distant clade, (iv) group IV contained five
Vigna species (
V. unguiculata, V. lobatifolia, V. angivensis, and
V. vexillata) with one short branch (
V. radiate) within the group
, and their subspecies, (v) group V included six
Vigna species (
V. hosei, V. racemose, V. fischeri, V. oblongifolia, V. marina, and
V. luteola), and (vi) group VI included the remaining 19
Vigna species and subspecies, verities of
V. trinervia, V. reflex-pilosa, V. glabrescens, V. hirtella, V. nakashimae, V. riukiuensis, V. mungo, V. tenuicaulis, V. aconitifolia, V. angularis V. nepalensis, V. stipulacea, V. trilobata, V. peduncularis, V. Caracalla, V. linearis, V. lasiocarpa, V. longifolia, and
V. frutescens subspecies. Within Group VI, the NJ tree based on concatenated ITS2 and
matK sequences successfully discriminated 19
Vigna species. Moreover, the
matK sequences improved the bootstrap values for all nodes in the phylogenetic tree (
Fig. 1). Although this barcoding region successfully discriminated all 52
Vigna species, closely related species were not discriminated.
DISCUSSION
DNA barcoding approaches using more samples (species/accessions) provides better insights into species relationships as well as more precise estimation of intraspecies heterogeneity. Morphological, biochemical, and molecular marker approaches have been used to infer the genetic relationships within and among
Vigna species (
Maxted et al. 2004). Various studies have been published investigating the phylogenetic relationships among species based on cpDNA (
Javadi et al. 2011), rDNA (
Vijaykumar et al. 2010), AFLP (
Tomooka et al. 2002), RAPD analysis (
Mimura et al. 2000) and biochemical markers (
Yasuda and Yamaguchi 1996). Similarly, FISH mapping of rDNA in
Vigna species was also previously conducted (
She et al. 2015). However, none of these have efficiently resolved the taxonomic problems.
The internal transcribed spacer (ITS) regions of 45S rDNA have been used extensively to determine phylogenetic relationships at the interspecific or intraspecific level because of their relatively high rate of mutation (
Alvarez and Wendel 2003). Previously, the ITS region was proposed for phylogenetic analysis in plant species (
Chen et al. 2010;
Gao et al. 2010). Recently, nucleotide sequences of some DNA regions in the chloroplast genome (
matK,
rpoC1 rpoB,
trnH-PsbA rbcL,
atpF-atpH,
psbK-psbI) and their combinations were tested for barcoding plant species (
Starr et al. 2009). Among these DNA regions,
matK and
rbcL were accepted as a 2-locus DNA barcode by the CBOL Plant Working Group (
Group et al. 2009). In this study, potential use of ITS2 nucleotide sequences combined with
matK was investigated as a two-locus DNA barcode for discrimination of the
Vigna species.
In the present study, ITS2 and
matK sequences were found to be easy to amplify with polymerase chain reaction (PCR). A total of 149 accessions were analyzed, from which 298 sequences (all > 400 bp) belonging to 52
Vigna species were ultimately obtained. Nucleotide diversity rate tests were performed for the aligned ITS2 and
matK sequences with all pairwise combinations in the genus
Vigna. Genetic divergence, represented by the average genetic distance of all pairwise comparisons, was 0.137 for the ITS2 region and 0.016 for the
matK region (
Table 1). Genetic distance estimated with the Kimura 2- parameter method (
Kimura 1980) among taxa calculated from complete sequence data ranged from 0.000 to 0.701 (
Table S2). This is a general problem for large-scale barcoding, as demonstrated by (
Bergsten et al. 2012), who concluded that the genetic distance to the closest heterospecific region decreases with increasing geographical sampling scale, linked to the larger intraspecific variance when more populations are incorporated. Thus, we included more samples and species per genus, in order to find the genetic distance between populations.
Species resolution of both DNA regions was similar because the topologies of ITS2 and
matK trees were similar. Both DNA regions were generally separated in
Vigna. However, several species could not be discriminated from each other by either ITS2 or
matK regions. It was reported that the ITS region requires cloning before sequencing because of allelic polymorphisms, pseudogenes, and paralogous copies of the ITS region in plant species (
Bailey et al. 2003;
King and Roalson 2008). However, there was no allelic polymorphism or insertion/deletion in the
matK region within the chloroplast genome of the
Vigna species. Therefore, we were able to efficiently amplify and sequence-characterize the
matK region without cloning.
The NJ method was originally employed in this study for species identification, and all accessions were allocated into different groups without polyphyly/paraphyly in the NJ tree (
Fig. 1). Phylogenetic relationships among
Vigna species based on ITS2 analyses were in agreement with previous studies using the ITS region (
Vijaykumar et al. 2010). The genetic diversity and phylogenetic relationships among species in the
Vigna subgenus
Ceratotropis were also investigated using sequence data from the ribosomal DNA ITS and atpB-rbcL intergenic spacer of chloroplast DNA regions (
Doi et al. 2002). Similarly in the present study, the ITS2 and
matK sequences proved efficient for discriminating
Vigna species. However, in the present study we found that the
V. vexillata and their varieties were present in different clade; the accession need to be tested with more samples along with multiple locus. The sequence data obtained for ITS2 and
matK were used to discriminate the species used. The dendrogram clearly indicated diversity among the
Vigna accessions. Thus our results suggest that ITS2 and
matK could make a significant contribution to resolving phylogeny at multiple taxonomic levels from generic relationships within
Vigna species.
Supplementary Information
ACKNOWLEDGMENTS
This study was carried out with the support of the “Research Program for Agricultural Science & Technology Development (Project No. PJ008553)” and was supported by the 2014 Postdoctoral Fellowship Program of National Academy of Agricultural Science, Rural Development Administration, Korea.
Fig. 1Phylogenetic analysis of 52 Vigna species based on the nucleotide sequences of the ITS2 and matK regions. The NJ tree was developed using the Kimura 2-parameter method with nucleotide sequences of the ITS2 and matK regions. Numbers next to the branches are the bootstrap test values.

Table 1Genetic diversity of barcoding markers and combinations used in this study.
Table 1
|
Marker combination |
Individuals (n) |
Number of species |
Aligned length |
Variable characters |
Number of segregating sites |
Nucleotide diversity (π) |
|
ITS2 |
149 |
52 |
413 |
29 |
200 |
0.137552 |
|
matK
|
149 |
52 |
469 |
21 |
76 |
0.016086 |
|
ITS2 + matK
|
149 |
52 |
882 |
33 |
277 |
0.196706 |
References
- Alvarez I, Wendel JF. 2003. Ribosomal ITS sequences and plant phylogenetic inference. Mol Phylogenet Evol. 29: 417-434.
- Anderson JW, Smith BM, Washnock CS. 1999. Cardiovascular and renal benefits of dry bean and soybean intake. Am J Clin Nutr. 70: 464s-474s.
- Arianoutsou M, Thanos CA. 1996. Legumes in the fire-prone Mediterranean regions: An example from Greece. Int J Wildland Fire. 6: 77-82.
- Bailey CD, Carr TG, Harris SA, Hughes CE. 2003. Characterization of angiosperm nrDNA polymorphism, paralogy, and pseudogenes. Mol Phylogenet Evol. 29: 435-455.
- Bellemain E, Carlsen T, Brochmann C, Coissac E, Taberlet P, Kauserud H. 2010. ITS as an environmental DNA barcode for fungi: an in silico approach reveals potential PCR biases. Bmc Microbiol. 10:
- Bergsten J, Bilton DT, Fujisawa T, Elliott M, Monaghan MT, Balke M, Hendrich L, Geijer J, Herrmann J, Foster GN, et al. 2012. The Effect of Geographical Scale of Sampling on DNA Barcoding. Systematic Biol. 61: 851-869.
- Chase MW, Cowan RS, Hollingsworth PM, van den Berg C, Madrinan S, Petersen G, Seberg O, Jorgsensen T, Cameron KM, Carine M, et al. 2007. A proposal for a standardised protocol to barcode all land plants. Taxon. 56: 295-299.
- Chen SL, Yao H, Han JP, Liu C, Song JY, Shi LC, Zhu YJ, Ma XY, Gao T, Pang XH, et al. 2010. Validation of the ITS2 Region as a Novel DNA Barcode for Identifying Medicinal Plant Species. PLoS One. 5(1):
- Doi K, Kaga A, Tomooka N, Vaughan DA. 2002. Molecular phylogeny of genus Vigna subgenus Ceratotropis based on rDNA ITS and atpB-rbcL intergenic spacer of cpDNA sequences. Genetica. 114: 129-145.
- Felsenstein J. 1985. Confidence limits on phylogenies: An approach using the bootstrap. Evolution. 39: 783-791.
- Gao T, Yao H, Song J, Liu C, Zhu Y, Ma X, Pang X, Xu H, Chen S. 2010. Identification of medicinal plants in the family Fabaceae using a potential DNA barcode ITS2. Journal of Ethnopharmacology. 130: 116-121.
- Group CPW, Hollingsworth PM, Forrest LL, Spouge JL, Hajibabaei M, Ratnasingham S, van der Bank M, Chase MW, Cowan RS, Erickson DL, et al. 2009. A DNA barcode for land plants. Proceedings of the National Academy of Sciences. 106: 12794-12797.
- Hollingsworth PM, Graham SW, Little DP. 2011. Choosing and Using a Plant DNA Barcode. PLoS One. 6(5):
- Javadi F, Tun YT, Kawase M, Guan KY, Yamaguchi H. 2011. Molecular phylogeny of the subgenus Ceratotropis (genus Vigna, Leguminosae) reveals three eco-geographical groups and Late Pliocene-Pleistocene diversification: evidence from four plastid DNA region sequences. Ann Bot-London. 108: 367-380.
- Kimura M. 1980. A simple method for estimating evolutionary rates of base substitutions through comparative studies of nucleotide sequences. Journal of molecular evolution. 16: 111-120.
- King MG, Roalson EH. 2008. Exploring evolutionary dynamics of nrDNA in Carex subgenus Vignea (Cyperaceae). Syst Bot. 33: 514-524.
- Kress WJ, Erickson DL. 2007. A Two-Locus Global DNA Barcode for Land Plants: The Coding rbcL Gene Complements the Non-Coding trnH-psbA Spacer Region. PLoS One. 2(6):
- Li DZ, Gao LM, Li HT, Wang H, Ge XJ, Liu JQ, Chen ZD, Zhou SL, Chen SL, Yang JB, et al. 2011. Comparative analysis of a large dataset indicates that internal transcribed spacer (ITS) should be incorporated into the core barcode for seed plants. P Natl Acad Sci USA. 108: 19641-19646.
- Maxted N, Mabuza-Diamini P, Moss H, Padulosi S, Jarvis A, Guarino L. 2004. An ecogeographic study. African Vigna. Rome (Italy): International Plant Genetic Resources Institute.
- Mimura M, Yasuda K, Yamaguchi H. 2000. RAPD variation in wild, weedy and cultivated azuki beans in Asia. Genet Resour Crop Ev. 47: 603-610.
- Moe KT, Chung JW, Cho YI, Moon JK, Ku JH, Jung JK, Lee J, Park YJ. 2011. Sequence Information on Simple Sequence Repeats and Single Nucleotide Polymorphisms through Transcriptome Analysis of Mungbean. J Integr Plant Biol. 53: 63-73.
- Perrino P. 1988. The diversity inVavilov’s Mediterranean Gene Center. Die Kulturpflanze. 36: 85-105.
- Schultz J, Maisel S, Gerlach D, Muller T, Wolf M. 2005. A common core of secondary structure of the internal transcribed spacer 2 (ITS2) throughout the Eukaryota. Rna. 11: 361-364.
- She CW, Jiang XH, Ou LJ, Liu J, Long KL, Zhang LH, Duan WT, Zhao W, Hu JC. 2015. Molecular cytogenetic characterisation and phylogenetic analysis of the seven cultivated Vigna species (Fabaceae). Plant Biology. 17: 268-280.
- Starr JR, Naczi RF, Chouinard BN. 2009. Plant DNA barcodes and species resolution in sedges (Carex, Cyperaceae). Molecular ecology resources. 9: Suppl s1. 151-163.
- Tamura K, Stecher G, Peterson D, Filipski A, Kumar S. 2013. MEGA6: Molecular Evolutionary Genetics Analysis Version 6.0. Mol Biol Evol. 30: 2725-2729.
- Tomooka N, Yoon MS, Doi K, Kaga A, Vaughan D. 2002. AFLP analysis of diploid species in the genus Vigna subgenus Ceratotropis. Genet Resour Crop Ev. 49: 521-530.
- Velazquez ER, Silva L, Alvaro P. 2010. Legumes: a healthy and ecological source of flavonoids. Curr Nutr Food Sci. 6: 109-144.
- Vijayan K, Tsou CH. 2010. DNA barcoding in plants: taxonomy in a new perspective. Curr Sci India. 99: 1530-1541.
- Vijaykumar A, Saini A, Jawali N. 2010. Phylogenetic analysis of subgenus vigna species using nuclear ribosomal RNA ITS: evidence of hybridization among Vigna unguiculata subspecies. The Journal of heredity. 101: 177-188.
- Yao H, Song JY, Liu C, Luo K, Han JP, Li Y, Pang XH, Xu HX, Zhu YJ, Xiao PG, Chen SL. 2010. Use of ITS2 Region as the Universal DNA Barcode for Plants and Animals. PLoS One. 5(10):
- Yasuda K, Yamaguchi H. 1996. Phylogenetic analysis of the Subgenus Ceretotropis (genus Vigna) and an assumption of the progenitor of azuki bean using isozyme variation. Breeding Sci. 46: 337-342.