Abstract
Through high throughput shotgun proteomics approach, the proteome of seedling leaf of Brassica rapa L. was identified. From three biological replications, a total of 2,122 non-redundant proteins of Brassica rapa L seedling leaf were identified, with a wide range and unbiased physiochemical properties. Their pI values ranged from pH 4.27 (Bra004590) to pH 11.81 (Bra013905). Their molecular weight (MW) ranged from 5.6 kDa (Bra006908) to 534.5 kDa (Bra028068). Gene ontology enrichment analysis revealed that these proteins were associated with cellular process, metabolic process, and enriched catalytic activity compared to whole brassica proteins. The highest presented protein in Brassica rapa seedling leaf was RuBisCO, accounting for 11.56% of total leaf proteins. Also, many ribosomal proteins were identified. The relative amount of all ribosomal proteins comprised 8.47% of total leaf proteins. The relative amount of two RuBisCO and ribosomal proteins was about 20% of total leaf proteins. Thus to detect proteins presenting low abundance, additional fractionating procedure to remove RuBisCO and ribosomal proteins is required.
-
Key words: Brassica rapa, Shotgun proteomics, Cabbage, Plant leaf, Spectral count
INTRODUCTION
Brassica is an economically important vegetable in the world. Some brassica such as
Brassica napus L,
Brassica Carinata, and
Brassica rapa produce fatty acids widely used as vegetable oil (
Harvey and Downey 1964) or biodiesel-fuel (
Cardone et al. 2003).
Brassica rapa is intensively consumed as a fresh vegetable in East Asia (
Crawford 2006). Research on
Brassica rapa L. (Inbred line ‘Chiifu’) has been progressed (
Vanjildorj et al. 2009;
Wang et al. 2010). However, its full genome sequence is currently unknown. Recently, the whole genome sequencing of Brassica of a Chinese cabbage has been completed (
Wang et al. 2011). Omics research such as proteomics using its genome data is ongoing (
Liu et al. 2013).
For proteomic analysis, two-dimensional polyacrylamide gel electrophoresis (2D-PAGE) technique has been used over 30 years since its introduction (
O’Farrell 1975). It is simple and fast. However, it has some weakness in identifying proteins that are less abundant, hydrophobic, or very basic (p
I >10). In addition, proteins with very small or very large molecular weight are hardly identified (
Harry et al. 2000). Nowadays, advanced technique has been emerged to identify proteins. Shotgun proteomic method (
Haynes and Roberts 2007), also known as multidimensional protein identification technology (MudPIT), is a non-gel based method to overcome the limitation of protein resoling on a gel. This method requires a much shorter time than 2D-PAGE (
Lee and Cooper 2006). It can identify proteins in large scale with high throughput (
Agrawal et al. 2009). Therefore, shotgun proteomics is regarded as complementary to 2D-PAGE.
The benefit of shotgun proteomics in crops has been only applied for rice because shotgun proteomic analysis highly relies on a complete genome. Proteomic analysis with 2D-PAGE for
Brassica rapa are also limited (
Giavalisco et al. 2006;
Wang et al. 2010). In this study, we identified the proteome of
Brassica rapa leaf in large-scale with high throughput shotgun proteomic analysis using the complete genome database of
Brassica rapa L. (Inbred line ‘Chiifu’).
MATERIALS AND METHODS
Plant materials
Brassica rapa L. (Inbred line ‘Chiifu’) seeds were used to identify seedling leaf proteins. Seeds were germinated in water and transplanted to soil at the density of one plant in one pot (90 nm inner diameter X 90 nm height). Brassica rapa L. plants were grown for 3 weeks in a growth chamber at 25°C under 16 h day/8 h night with 40–70% relative humidity (RH) and sufficient water provided daily. Leaves of 3 weeks old seedling were harvested.
Protein extraction
Collected samples were ground in liquid nitrogen and added to 1.5 ml Eppendorf tube. Proteins were extracted with extraction buffer (8M Urea/5mM DTT/1% LDS/100 mM Tris-HCl pH 8.5). The suspension was incubated at room temperature for 30 minutes with vortex. After centrifugation at 14,000 g for 15 minutes, the supernatant containing extracted protein was collected. Proteins were precipitated overnight with 20% (v/v) trichloroacetic acid (TCA), washed several times with cold acetone until pigments (including chlorophyll) were removed. The protein pellet was dissolved in 8M Urea/100 mM Tris-HCl pH 8.5. Protein concentration was assayed with 2D-Protein Quant Kit (GE Healthcare, Piscataway, Nj, USA) using published method (
Lee et al. 2007).
One-dimension LDS-PAGE and in-gel trypsin digestion were performed using published method (
Lee et al. 2007). Briefly, a total of 50 μg of protein sample was prepared with NuPage
® LDS Sample Buffer (4X)/NuPAGE
® Reducing Agent(10X)/Deionized Water (Invitrogen, Carlsbad, CA, USA). Proteins were loaded into 4–12% NuPAGE
® Novex Bis-Tris Mini Gels (Invitrogen, Carlsbad, CA, USA) and separated by electrophoresis. After fixing the protein gel with 100 mL of fixing solution (40 ml deionized water, 50 ml methanol, and 10 ml acetic acid) for 10 minutes, the fixing solution was drained. Staining solution (55 ml deionized water, 20 ml methanol, 20 ml stainer A and 5 ml of stainer B of NOVEX
® Colloidal Blue Stain Kit, Invitrogen, Carlsbad, CA, USA) was used to stain protein bands. Each lane of stained protein bands were divided into 7 equal-sized pieces. Bands in each piece were sliced into smaller sizes of regular hexahedron cube (approximate size 1 mm
3) and pooled together into a 1.5 ml Eppendorf
® tube.
In each tube, destaining buffer (50% acetonitrile [ACN] in 50 mM ammonium bicarbonate [ABC], pH 7.8) was poured to remove Coomassie blue stain. The samples were reduced with reduction buffer (10 mM DTT in 25 mM ABC) for 45 minutes at 56°C and alkylated for 30 minutes with alkylation buffer (55 mM iodoacetamide in 25 mM NH4HCO3) at room temperatures under dark. Gels were dried with SpeedVac. Dried gels were mixed with trypsin (trypsin 12.5 ng/μl in 50 mM ABC) and digested at 36°C overnight. Tryptic peptides were harvested from gels using harvest buffer (5% formic acid in 50% ACN). After vortexing for a few seconds, samples were centrifuged with 21,000 g at room temperature for 20 minutes. Supernatants were then dehydrated with SpeedVac. Samples were then desalted with Pierce® C18 spin columns (Thermo Scientific, Rockford, IL, USA). Desalted samples were then subjected to LC MS/MS.
LC MS/MS analysis with Q exactive
Nanoflow HPLC instrument (Easy nLC, Thermo Fisher Scientific, San Jose, CA, USA) was connected on-line to a Q Exactive mass spectrometry (Thermo Fisher Scientific, Bremen, Germany). Columns (12 cm, 75 μm inner diameter) used for analysis were packed in-house with Alltima C18-AQ 5 μm resin. For reversed phase chromatography, binary buffer system consisting of 0.1% formic acid (Buffer A) and acetonitrile in 0.1% formic acid (buffer B) was used. Chromatography was performed for each sample with a linear gradient of 3–50% buffer B at a flow rate of 270 nL/min. The total run time for one LC MS/MS sample was 120 minutes.
MS data were acquired using a data-dependent top 8 method that dynamically chose the most abundant precursor ions from survey scan (300–2,000 Da) for higher-energy collisional dissociation (HCD) fragmentation. Dynamic exclusion duration was 60 seconds. The isolation window of precursors was 4. Survey scans were acquired at a resolution of 70,000 with m/z at 200. The resolution for HCD spectra was set at 17,500 with m/z at 200.
Analysis of proteomic data
Proteome Discoverer (version 1. 3) software (Thermo Fisher Scientific) was used to identify proteins and spectral count for each identified protein with pI value and MW. Fragmentation spectra were searched against protein database of Brassica rapa (Brassica v 1.2, BRAD). Precursor and fragment mass tolerances were set at 10 ppm and 0.8 Da, respectively, with up to two missed cleavages. Carbamidomethylation of cysteine was set as a fixed modification. Oxidation of methionine was set as a variable modification for data searching. Both identifications were filtered at false discovery rate of 1%.
Comparative analysis of relative protein abundances
Proteome Discoverer (version 1.3) data of LC MS/MS analysis were exported to Microsoft Excel to calculate normalized spectral count (NSpC). NSpC of each protein k was calculated with the following formula:
where the total number of MS/MS spectra matching peptides from protein k (SpC) was divided by protein’s length (L) which was then divided by SpC/L for all N proteins in the experiment.
Bioinformatics analysis of proteomic data
Gene Ontology annotations for
Brassica rapa seedling leaf proteins were retrieved from BRAD Brapa genome data V1.2. Gene ontology (GO) enrichment analysis was performed with agriGO (
http://bioinfo.cau.edu.cn/agriGO/) using
Brassica rapa whole genome as background/reference.
RESULTS
Identified proteins from Brassica rapa seedling leaf
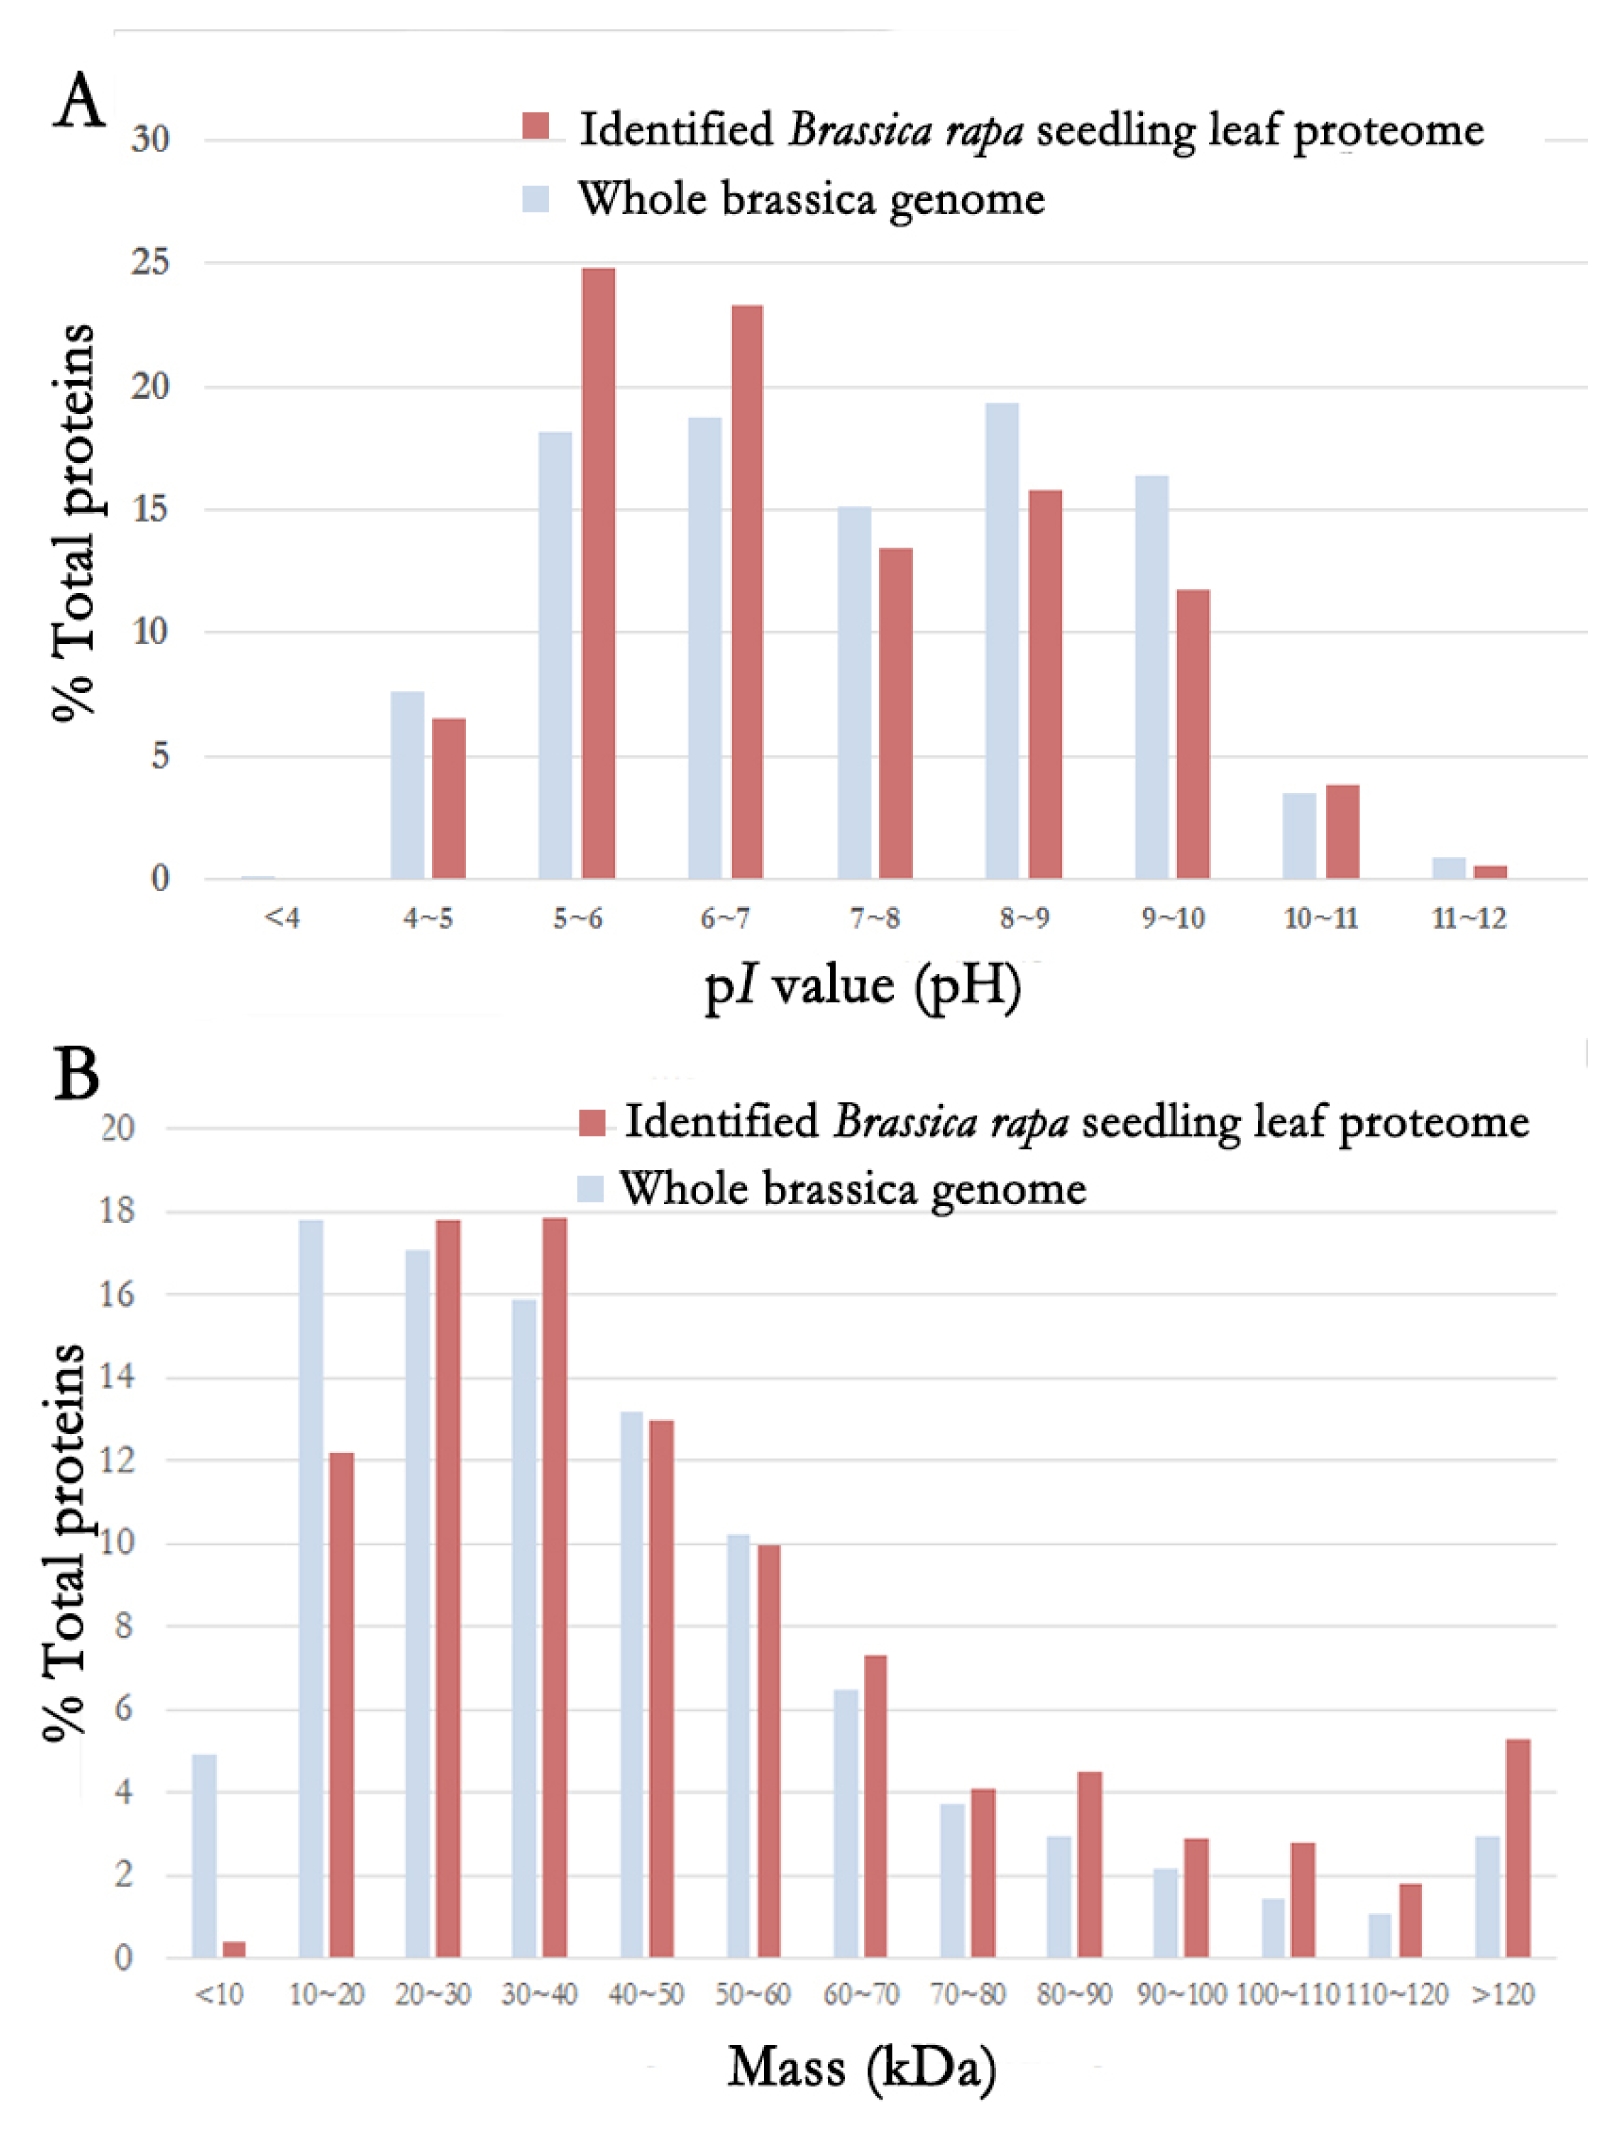
A total of 2,122 non-redundant proteins were identified by MudPIT runs. The physiochemical properties of these 2,122 identified proteins were analyzed. Their p
I values and molecular weights were compared to those of whole brassica genome (
Fig. 1). Bra004590 (disproportionating enzyme 2) had the lowest p
I value at pH 4.27. Bra013905 (fibrillarin 2) had the highest p
I value at pH 11.81. Based on the p
I value, the distribution of identified proteins was similar to that of the entire brassica proteins, although more proteins were identified from
Brassica rapa seedling leaf in the range of pH5–6 and pH6–7 compared to those in the whole genome. The molecular weight (MW) of identified proteins from
Brassica rapa seedling leaf ranged from 5.6 kDa (Bra006908: dual specificity protein phosphatase or DsPTP1 family protein) to 534.5 kDa (Bra028068: GF14 protein phi chain). Based on the MW, the distribution of identified proteome was similar to that of whole genome. However, for proteins whose MW was 20 kDa, less proteins were identified from
Brassica rapa seedling leaf compared to those from the whole genome. However, for proteins with MW in the range of 80 kDa to over 120 kDa, more proteins were identified from
Brassica rapa seedling leaf compared to those from the whole genome.
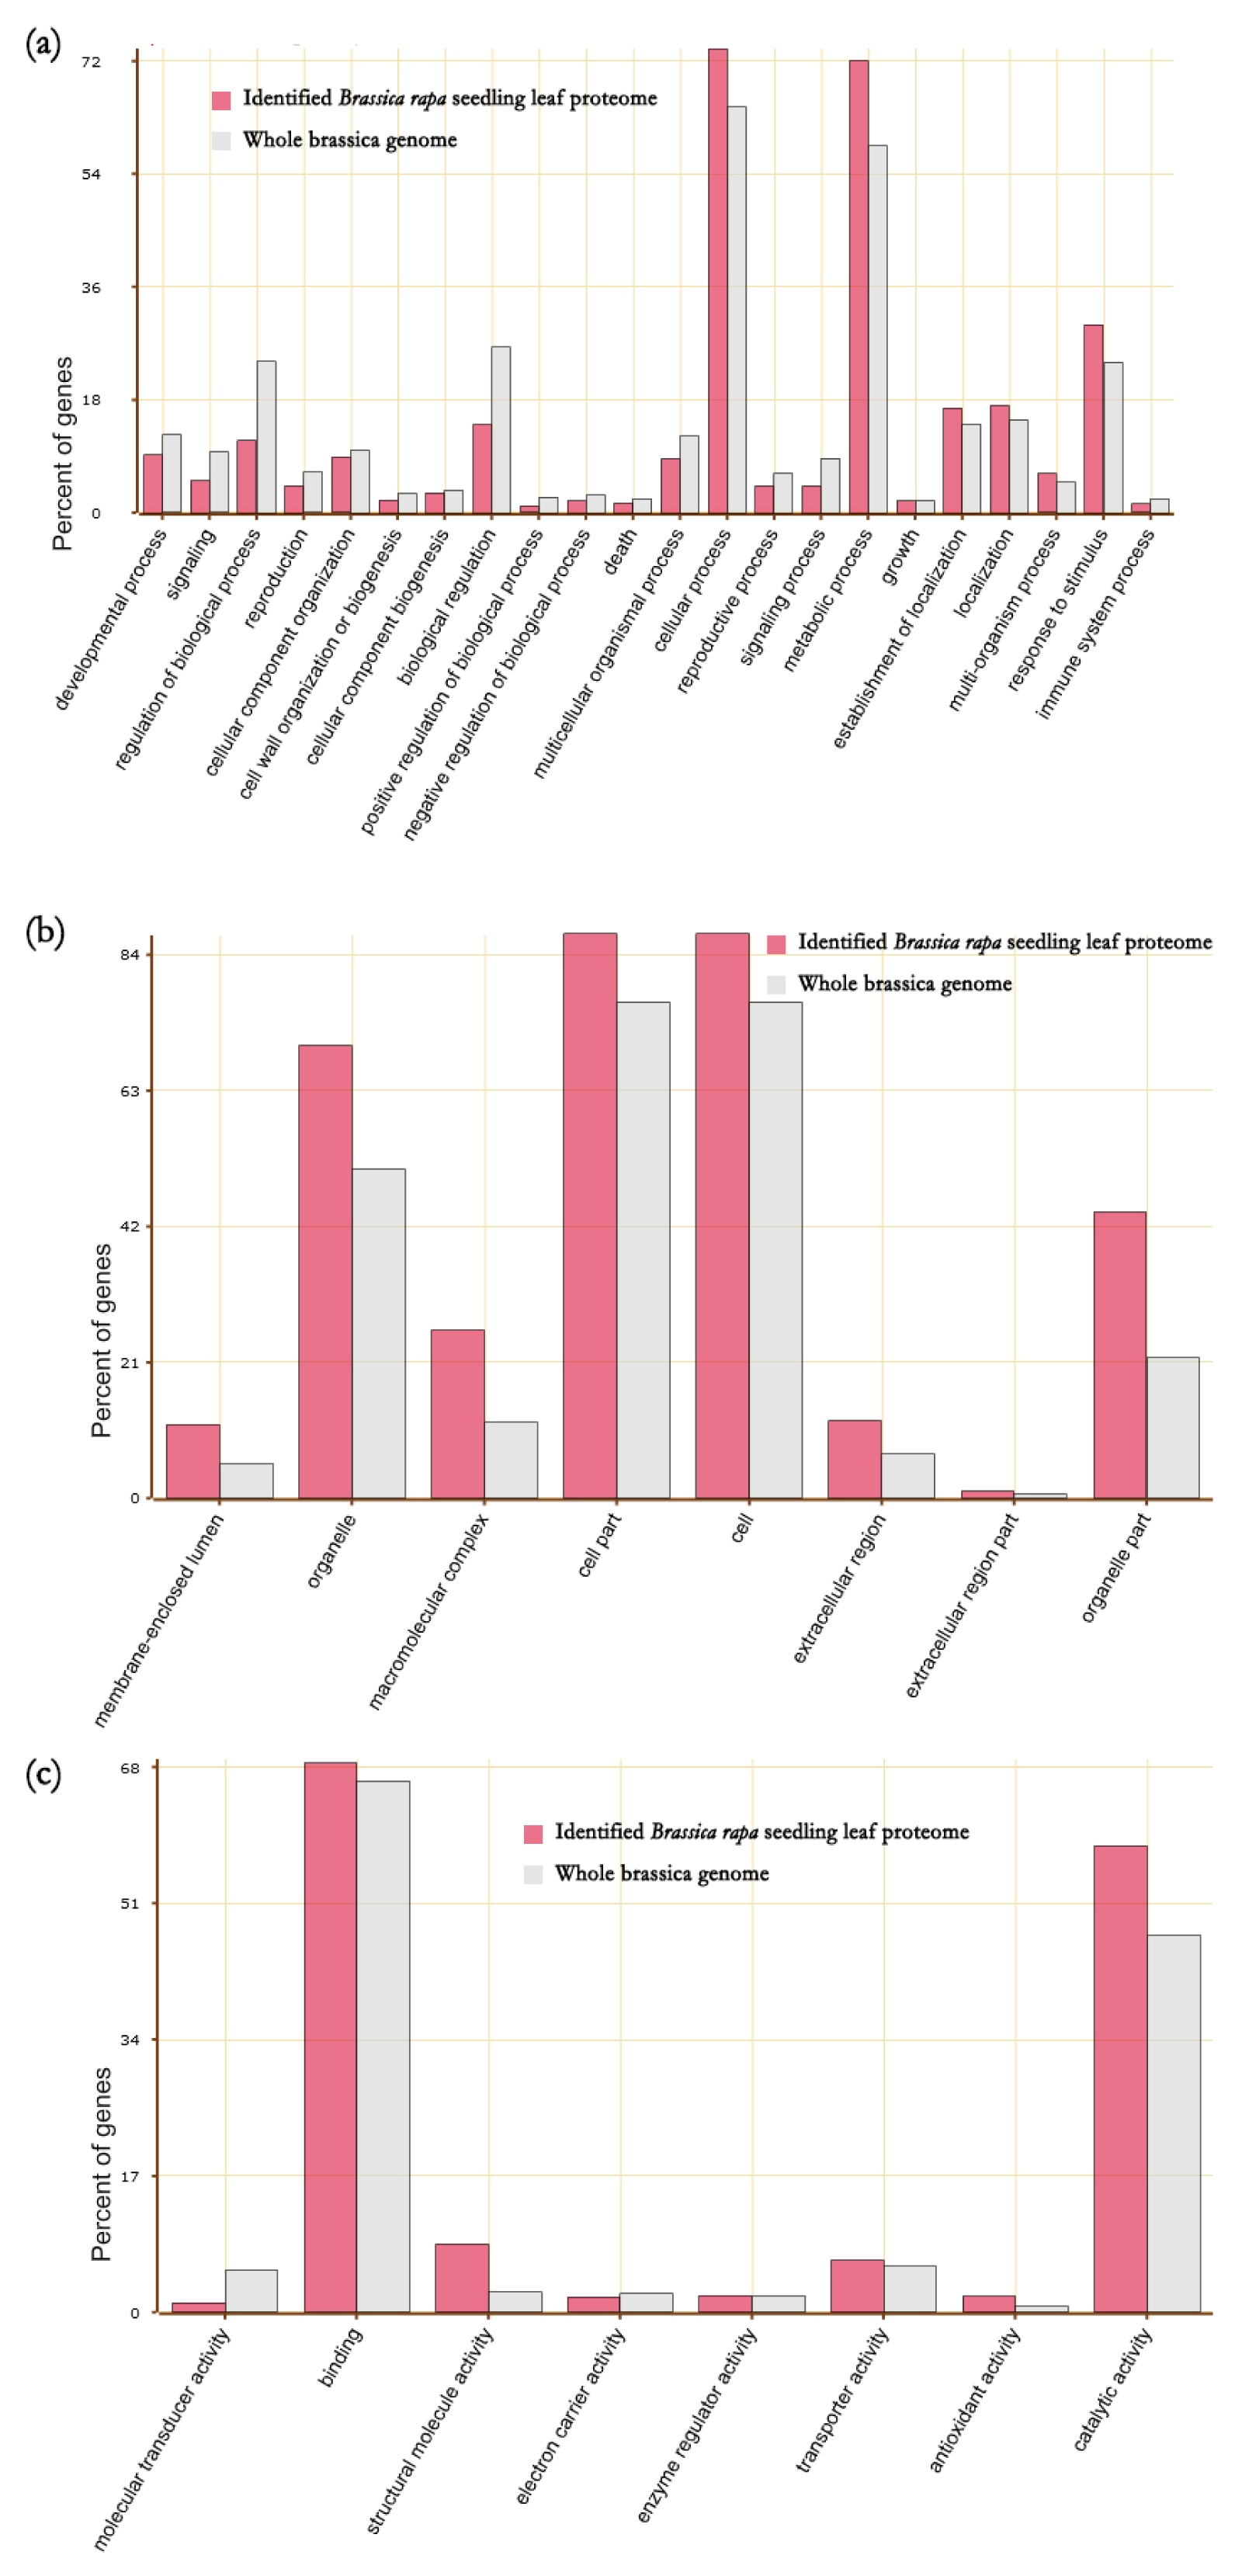
To study the proteome feature of seedling leaf of
Brassica rapa, Gene Ontology (GO) enrichment analysis was performed for these 2,122 identified proteins. Twenty two GO terms of biological processes (
Fig. 2), 8 GO terms of cellular components, and 8 GO terms of molecular functions were enriched in these 2,122 proteins. For the GO term of biological processes, proteins associated with cellular process and signaling processes were present in high proportions while proteins associated with regulation of biological process and biological regulation had less proportion. For cellular components, proteins associated with organelle, macromolecular complex, cell parts, and organelle part had high proportions. In molecular functions, proteins associated with catalytic activity had high proportion (
Fig. 2).
To quantify protein amounts, spectra counts in MudPIT have recently been developed (
Liu et al. 2004;
Washburn et al. 2002). The spectra counts of the 2,122 proteins were estimated from the MS/MS spectra. The relative amount of proteins in one sample was estimated and the NSpC from the three replicates was averaged (
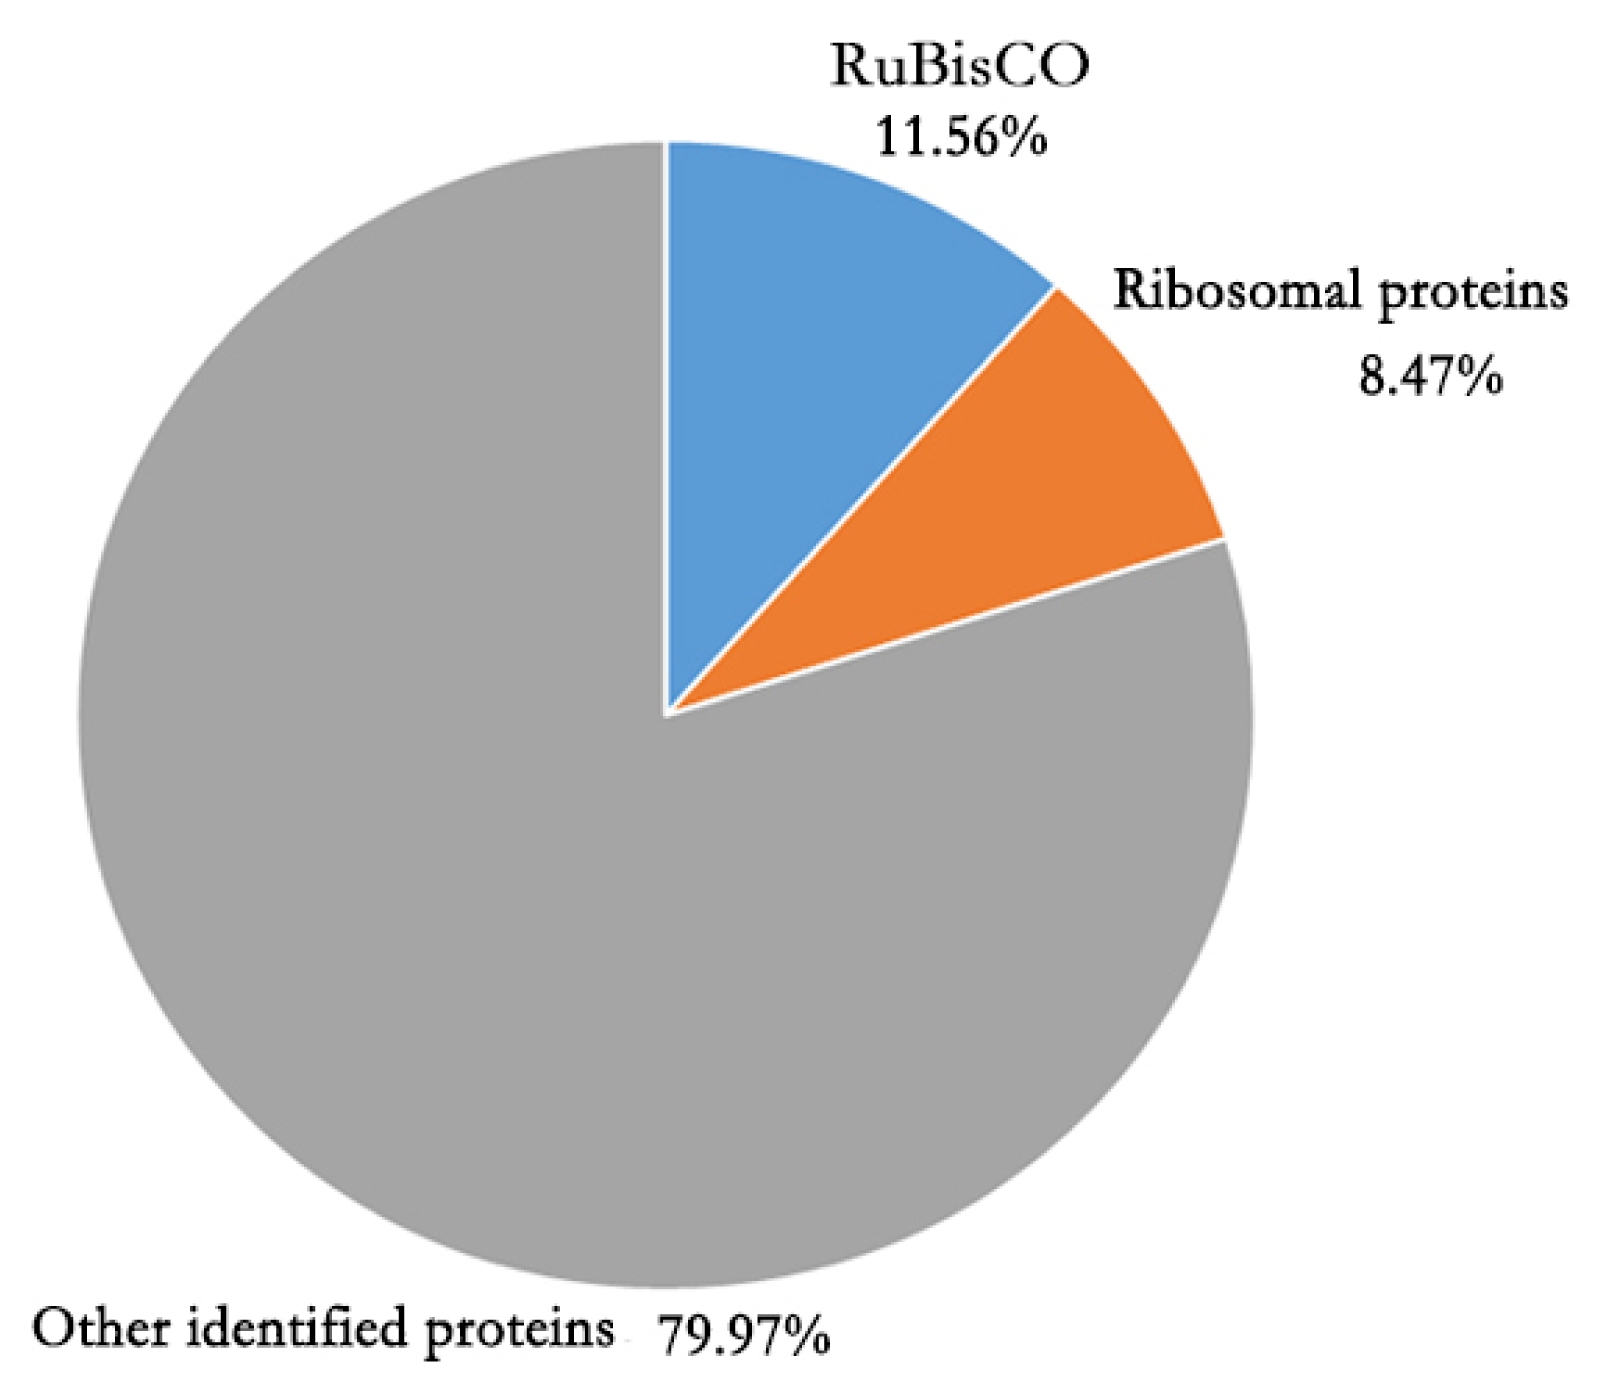
Supplementary file 1). The most abundant protein was RuBisCO (
Fig. 3). In addition, most proteins in the top 20 highly presented proteins were subunits of RuBisCO and other proteins associated with photosynthesis (
Table 1). Excluding these highly abundant photosynthesis associated proteins, tubulin and histone were abundant. One unknown protein (Bra 037380) was presented in high amount. Based on BLAST search, most Bra 037380 homologue proteins were uncharacterized in a few species as a hypothetical protein.
DISCUSSION
In this study, we identified 2,122 non-redundant
Brassica rapa seedling leaf proteins through shotgun proteomic approach. Some of the identified proteins were not identified in all three replicates. This could be due to the fact that only a portion of samples were analyzed from the highly complex mixtures of peptides. A single analytical run may only recognize a fraction of total peptides in random (
Wilkins et al. 2006). This result might also represent the complexity of leaf proteome. Proteins identified in this study may not completely cover all proteins in the leaf. However, there was no bias in the identification. The distribution of proteins identified in the seedling leaf of
Brassica rapa was similar to that of the entire
Brassica rapa proteome encoded by the whole genome. Unlike 2D-PAGE gel where basic proteins are hardly resolved or detected, ~50 % of proteins identified in this study showed over pH 7. The GO enrichment analysis results revealed that proteins associated with organelle, macromolecular complex, cell parts, and organelle part were presnt in the seedling leaf in high proportion. This result implies that the status of seedling leaf is in active growth stage when proteins for constructing cell components are highly activated. Of the identified leaf proteins, RuBisCO proteins had the highest amount. High abundance of RuBisCO proteins are common features of green leaf in plant (
Krishnan and Natarajan 2009). Our results revealed that the relative amount of all RuBisCO proteins comprised of 11.56% of total amount of leaf proteins. In addition, many ribosomal proteins were identified. The relative amount of all ribosomal proteins comprised 8.47% of total leaf proteins. The relative amount of two RuBisCO and ribosomal proteins was about 20% of total leaf proteins, making it difficult to identify low abundant proteins. Besides proteins associated with photosynthesis, histone and tubulin proteins were also present in high amounts. Histone is a nucleoprotein located in the nucleus while tubulin is a monomer of microtubule as components of cytoskeleton (D E
Fosket and Morejohn 1992;
Hansen et al. 1998). Because harvested leaf contained whole part of the shoot, our result indicated active cell division in seedling leaf. In conclusion, with high throughput shotgun proteomic approach, we identified
Brassica rapa seedling leaf proteins in high depth. We analyzed cellular status based on GO enrichment analysis. We also determined the relative amounts of these proteins based on spectra counts.
Supplementary Information
ACKNOWLEDGEMENTS
This research was supported by a grant (NRF-2012-R1A1A1004138) of the Basic Science Research Program through National Research Foundation of Korea (NRF) funded by the Ministry of Education, Republic of Korea. This research was also supported by “Cooperative Research Program for Agriculture Science & Technology Development (Mapping/Detection of genes conferring resistance to rice brown plant hopper and cold stress and development of breeding materials PJ01104202)” funded by the Rural Development Administration, Republic of Korea.
Fig. 1Distribution of physiochemical properties of the identified Brassica rapa seedling leaf proteome.

Fig. 2Enriched GO terms Brassica rapa seedling leaf proteins. (a) biological process, (b) cellular components and (c) molecular functions.

Fig. 3Proportion of the amount of RuBisCO and ribosomal proteins in the total amount of Brassica rapa seedling leaf proteins.

Table 1Highly existed proteins in Brassica rapa seedling leaf.
Table 1
|
Accession |
Description |
AAsa)
|
MW [kDa]b)
|
calc. pI c)
|
NSpCd)
|
|
Bra028181 |
Ribulose bisphosphate carboxylase (small chain) family protein |
162 |
18.4 |
8.05 |
0.029727 |
|
Bra028087 |
ribulose-bisphosphate carboxylases |
479 |
52.9 |
6.29 |
0.027695 |
|
Bra028406 |
Ribulose bisphosphate carboxylase (small chain) family protein |
181 |
20.2 |
8.05 |
0.018456 |
|
Bra010807 |
chlorophyll A/B-binding protein 2 |
267 |
28.1 |
5.12 |
0.011255 |
|
Bra005425 |
light-harvesting chlorophyll-protein complex II subunit B1 |
266 |
28.1 |
5.43 |
0.011079 |
|
Bra030182 |
chlorophyll A/B binding protein 1 |
267 |
28.2 |
5.66 |
0.010266 |
|
Bra025431 |
Ribulose bisphosphate carboxylase (small chain) family protein |
181 |
20.2 |
8.05 |
0.009049 |
|
Bra039070 |
photosystem II light harvesting complex gene 2.3 |
265 |
28.6 |
5.9 |
0.008711 |
|
Bra017055 |
rubisco activase |
443 |
48.5 |
7.72 |
0.008354 |
|
Bra005019 |
rubisco activase |
475 |
51.8 |
7.18 |
0.006594 |
|
Bra037913 |
light harvesting complex of photosystem II 5 |
281 |
30.2 |
6.8 |
0.006187 |
|
Bra013183 |
photosystem II light harvesting complex gene 2.1 |
265 |
28.6 |
5.66 |
0.006153 |
|
Bra038863 |
photosystem II subunit O-2 |
333 |
35.4 |
6.62 |
0.00595 |
|
Bra010717 |
fructose-bisphosphate aldolase 2 |
393 |
42.5 |
6.62 |
0.004833 |
|
Bra039342 |
phosphoglycerate kinase 1 |
480 |
50.1 |
7.47 |
0.004732 |
|
Bra029732 |
light harvesting complex photosystem II |
288 |
31.1 |
5.94 |
0.004683 |
|
Bra002999 |
light-harvesting chlorophyll B-binding protein 3 |
265 |
28.6 |
5.12 |
0.004627 |
|
Bra000708 |
light harvesting complex of photosystem II 5 |
280 |
30 |
6.81 |
0.004626 |
|
Bra000481 |
Histone superfamily protein |
103 |
11.4 |
11.47 |
0.004543 |
|
Bra030660 |
photosystem II subunit P-1 |
261 |
27.9 |
6.58 |
0.004431 |
|
Bra018184 |
tubulin beta chain 3 |
449 |
50.6 |
4.81 |
0.002642 |
|
Bra000687 |
ATP synthase delta-subunit gene |
234 |
25.5 |
9.23 |
0.002443 |
|
Bra039648 |
tubulin alpha-2 chain |
450 |
49.6 |
5.1 |
0.002405 |
|
Bra004989 |
light harvesting complex photosystem II |
276 |
30.1 |
5.36 |
0.002155 |
|
Bra009710 |
tubulin beta 8 |
449 |
50.6 |
4.81 |
0.002152 |
|
Bra006429 |
Cobalamin-independent synthase family protein |
765 |
84.4 |
6.55 |
0.002142 |
|
Bra037380 |
unknown protein; |
162 |
17.6 |
9.14 |
0.002014 |
References
- Agrawal GK, Jwa NS, Rakwal R. 2009. Rice proteomics: ending phase I and the beginning of phase II. Proteomics. 9: 935-963.
- Cardone M, Mazzoncini M, Menini S, Rocco V, Senatore A, Seggiani M, Vitolo S. 2003. Brassica carinata as an alternative oil crop for the production of biodiesel in Italy: agronomic evaluation, fuel production by transesterification and characterization. Biomass and Bioenergy. 25: 623-636.
- Crawford GW. 2006. East Asian plant domestication. archaeology of asia. 77-95.
- Fosket a DE, Morejohn LC. 1992. Structural and Functional Organization of Tubulin. Annual Review of Plant Physiology and Plant Molecular Biology. 43: 201-240.
- Dong MQ, Venable JD, Au N, Xu T, Park SK, Cociorva D, Johnson JR, Dillin A, Yates JR 3rd. 2007. Quantitative mass spectrometry identifies insulin signaling targets in C. elegans. Science. 317: 660-663.
- Giavalisco P, Kapitza K, Kolasa A, Buhtz A, Kehr J. 2006. Towards the proteome of Brassica napus phloem sap. Proteomics. 6: 896-909.
- Hansen JC, Tse C, Wolffe AP. 1998. Structure and Function of the Core Histone N-Termini: More Than Meets the Eye. Biochemistry. 37: 17637-17641.
- Harry JL, Wilkins MR, Herbert BR, Packer NH, Gooley AA, Williams KL. 2000. Proteomics: Capacity versus utility. ELECTROPHORESIS. 21: 1071-1081.
- Harvey BL, Downey RK. 1964. The inheritance of erucic acid content in rapeseed (brassica napus). Canadian Journal of Plant Science. 44: 104-111.
- Haynes PA, Roberts TH. 2007. Subcellular shotgun proteomics in plants: looking beyond the usual suspects. Proteomics. 7: 2963-2975.
- Krishnan HB, Natarajan SS. 2009. A rapid method for depletion of Rubisco from soybean (Glycine max) leaf for proteomic analysis of lower abundance proteins. Phytochemistry. 70: 1958-1964.
- Lee J, Cooper B. 2006. Alternative workflows for plant proteomic analysis. Molecular bioSystems. 2: 621-626.
- Lee J, Garrett WM, Cooper B. 2007. Shotgun proteomic analysis of Arabidopsis thaliana leaves. Journal of separation science. 30: 2225-2230.
- Liu B, Wang Y, Zhai W, Deng J, Wang H, Cui Y, Cheng F, Wang X, Wu J. 2013. Development of InDel markers for Brassica rapa based on whole-genome re-sequencing. Theoretical and Applied Genetics. 126: 231-239.
- Liu H, Sadygov RG, Yates JR 3rd. 2004. A model for random sampling and estimation of relative protein abundance in shotgun proteomics. Analytical chemistry. 76: 4193-4201.
- O’Farrell PH. 1975. High resolution two-dimensional electrophoresis of proteins. Journal of Biological Chemistry. 250: 4007-4021.
- Vanjildorj E, Song S, Yang Z, Choi J, Noh Y, Park S, Lim W, Cho K, Yun H, Lim Y. 2009. Enhancement of tolerance to soft rot disease in the transgenic Chinese cabbage (Brassica rapa L. ssp. pekinensis) inbred line, Kenshin. Plant Cell Rep. 28: 1581-1591.
- Wang X, Wang H, Wang J, Sun R, Wu J, Liu S, Bai Y, Mun JH, Bancroft I, Cheng F, et al. 2011. The genome of the mesopolyploid crop species Brassica rapa. Nat Genet. 43: 1035-1039.
- Wang Z, Wang Z, Shi L, Wang L, Xu F. 2010. Proteomic alterations of Brassica napus root in response to boron deficiency. Plant Mol Biol. 74: 265-278.
- Washburn MP, Ulaszek R, Deciu C, Schieltz DM, Yates JR 3rd. 2002. Analysis of quantitative proteomic data generated via multidimensional protein identification technology. Analytical chemistry. 74: 1650-1657.
- Wilkins MR, Appel RD, Van Eyk JE, Chung MC, Gorg A, Hecker M, Huber LA, Langen H, Link AJ, Paik YK, et al. 2006. Guidelines for the next 10 years of proteomics. Proteomics. 6: 4-8.