Abstract
Plants adapt to hostile environmental condition through specialized cellular processes which require coordinated regulation of multiple transport mechanisms. Low-affinity cation transporter (LCT) 1 is a membrane transporter gene exclusive only to members of the grass family, and the rice genome contained only one copy of the gene. Accumulating evidence highlighted the important role of this gene in the regulation of various cations transport into the plant cells including heavy metals. To further characterize the role of this membrane transporter in planta, we overexpressed the OsLCT1 in japonica rice using CaMV 35S and screened the transgenic plants for high salt toxicity at the seedling stage. A striking difference in the phenotype of OsLCT1-overexpression plants and the wild-type was observed at seven days after treatment, where transgenic plants exhibited moderate tolerance reaction to salinity stress. Our findings suggest that OsLCT1 gene can be useful to develop new resistant varieties against salinity stress.
-
Key words: OsLCT1, Low-affinity cation transporter, Salinity stress, Rice
INTRODUCTION
One way that plants adapt to harsh environmental conditions is by employing effective membrane transport mechanism. This is particularly necessary when the acquisition of essential mineral nutrients from soils becomes difficult for plants such as when the soil solution contains very low concentrations of available macro and micronutrients or contains high concentrations of toxic metal ions such as Na
1 or Al
31 (
Schachtman et al. 1997). Classical tracer flux data and molecular evidence show that higher plants have multiple K
1 and Na
1 uptake mechanisms in the plasma membrane for acquisition (
Epstein and Rains 1965;
Rains and Epstein 1967). Extensive application of phosphate fertilizers, sludge, and irrigation water containing some trace of Cd made most arable soils moderately contaminated with Cd (
di Toppi and Gabbrielli 1999;
McGrath et al. 2001;
Kikuchi et al. 2007). One viable and promising approach to reducing the Cd concentration in rice grains is through breeding or engineering low-Cd-accumulating cultivars (
Uraguchi et al. 2009). Understanding the mechanism of heavy metal transport across plant membranes has been proposed to aid in engineering plants with enhanced or decreased uptake (
Raskin 1996). The uptake of heavy metal ions, including Cd
2+, by agricultural plants, is a major cause for the accumulation of these toxic cations in the human body (
Van Bruwaene et al. 1984;
Wagner 1994) hence overwhelming approaches in dissecting the molecular and genetic basis of Cd transportation in plants have been demonstrated. Among the major graminaceous crops, a series of studies on durum wheat (
Triticum turgidum L. var. durum) have been conducted to characterize Cd uptake, root-to-shoot Cd translocation, and grain Cd accumulation (
Hart et al. 1998,
2006;
Harris and Taylor 2001,
2004). Accumulating evidence suggested three accumulations by transport mechanisms in rice plants including uptake by roots, xylem-loading-mediated translocation to shoots, and further translocation to seeds through phloem (
Clemens et al. 2002). Among the three, phloem transport is responsible for the accumulation of most Cd.
Uraguchi et al. (2011) identified a rice Cd transporter, low-affinity cation transporter (LCT), which transports Cd to the grains. Further, their findings indicated that this transporter gene functions at the nodes in Cd transport into grains and that in a standard japonica cultivar, the regulation of
LCT1 enables the generation of low-Cd rice without negative effects on agronomical traits (
Uraguchi et al. 2011).
Rice has been identified as a salt susceptible cereal especially during young stage (
Lutts et al. 1995). Salinity stress affects stomatal closure in plants which in turn causes increase in leaf temperature, inhibition of shoot elongation, and interferes rice growth and development hence the capacity to tolerate salinity is a key factor in plant productivity (
Momayezi et al. 2009;
Rajendran et al. 2009;
Sirault et al. 2009;
Reddy 2017). Essential parameters to effectively assess salt tolerance in plants include biomass production percentage in salinity versus the control conditions over a prolonged period of time (
Munns 2002). Several evidence highlighted that rice plants generally tolerate salt by mainly two mechanisms including ion exclusion and osmotic tolerance, the former being shown as inhibition of growth over a period of time and premature senescence of older leaves in response to the extended salinity phase (
Munns and Tester 2008). High salinity can also lead to osmotic stress that resembles physiologically with drought, and high salt deposition makes it hard for plants to access water and nutrients from soils (
Verslues et al. 2006). Findings on the experiments involving excised roots of higher plants suggest that there may be multiple low-affinity carrier sites with different affinities for various cations (
Epstein and Rains 1965;
Elzam et al. 1964). The presence of multiple loci associated with salt tolerance and Na
+ exclusion is consistent with the idea of multiple pathways for uptake regulation of Na
+ (
Omielan et al. 1991). Indeed, physiological as well as genetic studies implicated that there is more than one pathway involved in the Na
+ uptake across the plasma membrane of plant roots (
Epstein and Rains 1965;
Omielan et al. 1991;
Schroeder et al. 1994). Studies performed by
Schachtman et al. (1997) indicated that
LCT1 may encode one of the molecular components of low-affinity Na
+ uptake
in planta. Further interference by other ions has been demonstrated where an influx of Rb
+ through
LCT1 was sensitive to interference by Zn
2+, Ca
2+, Mg
2+, and Na
+, but less sensitive to K
+ (
Schachtman et al. 1997).
To further characterize the role of this membrane transporter in planta, we generated OsLCT1-overexpressing japonica rice plants and screened them for high salinity stress during the seedling stage. The response of overexpression lines provides an interesting perspective on the possible additional biological process augmented by low-affinity cation transporter 1 in rice.
MATERIALS AND METHODS
In silico analysis of the gene
Deduced amino acid (AA) sequence of
OsLCT1 was obtained from the NCBI database. The sequence homology was computed using the ClustalX program (
Thompson et al. 1997) and the phylogenetic tree was constructed using MEGA7 (
Kumar et al. 2016). Prediction of the number of transmembrane helices in protein was performed using the TMHMM Server v.2.0.
Total RNA was isolated from the young leaves of
japonica rice cv. ‘Jinbaek’ using the RNAiso Plus extraction reagent (Takara Bio Inc. Tokyo, Japan) as per manufacturer’s instruction. About 1 μg of high-quality total RNA in a 20-μL reaction volume containing Superscript III Synthesis Kit (Invitrogen, Carlsbad, CA, USA) was used to synthesize the first strand cDNA. The full-length cDNA of
OsLCT1 PCR was then amplified using the primer pair, (forward 5′-3′) ATGACCGGCG AGGCAAGCAAAG and (reverse 5′-3′) TCTAGACTAT GACTTCATAACTTCGACGC, in the following PCR conditions: denaturation at 95°C for 5 minutes; 35 cycles of 95°C for 30 seconds, 55°C for 30 seconds, 72°C for 2 minutes; and a final extension at 72°C for 10 minutes. The amplicon with the right band size detected on 1% (w/v) agarose gel was eluted using the gel purification kit (Bioneer, Alameda, CA, USA) and sub-cloned into the pGEMT-easy vector (Promega, Madison, WI, USA) for sequencing analysis. Ligation of
OsCLT1 into the
SacI and
XbaI sites of pCAMBIA1300 (
Fig. 1) was achieved using the T4 ligase kit (Promega, Madison, WI, USA) which was then transformed into
Agrobacterium strain EHA105 and eventually into rice seed calli of
japonica rice cv. ‘Dongjin’ as described (
Lee et al. 2011;
Niño et al. 2015). Regenerated plants were transplanted to soil in the greenhouse.
Confirmation of OsLCT1 insertion in transgenic plants was performed by genomic PCR assay using a forward primer (5′-3′), CGCAAGACCCTTCCTCTATATAAGG, which was designed to include 50 bp of promoter region and reverse primer (5′-3′), GCGTCGAAGTTATGAA GTCATAG in a 20 μL reaction with the Takara ExTaq kit (Takara, Shiga, Japan). The PCR reaction cocktail was then subjected to the same condition as previously described. The PCR product was electrophoresed on 1% (w/v) agarose gel stained with ethidium bromide and viewed under UV light. Further, 10 ng of purified genomic DNA was used to determine the copy number of the transgene in overexpression plants using TaqMan RT-qPCR reagents (Applied Biosystems, Foster city, CA, USA) according to manufacturer’s instructions. The qPCR reactions were run in three replicates on an ABI 7900HT instrument (Applied Biosystems, Foster city, CA, USA) using the following conditions: enzyme activation at 95°C for 10 minutes, denaturation at 95°C for 15 seconds, and annealing at 60°C for 60 seconds. After amplification, data files were analyzed using CopyCaller® Software v 2.0 (Applied Biosystems, Foster city, CA, USA) to obtain the calculated gene copy number.
Relative mRNA expression of OsLCT1
To examine the abundance of OsLCT1 transcripts in different growth stages and tissues, the total RNA was isolated from the rice during germination, 3-leaf stage, maximum tillering, and panicle initiation, and from roots, stem, leaf sheath, leaf, and flag leaf. Moreover, to check the relative expression of mRNA in response to salicylic acid (SA) and jasmonic acid (JA), the total RNA of plants sprayed with 100 uM salicylic acid and 100 uM jasmonic acid was extracted from leaf tissues sampled at 0, 6, 12, and 24 hours post inoculation (hpi). RNA extraction and cDNA synthesis were conducted as described above. RT-qPCR was carried out using the OsLCT1-specific internal primer pair, Fw (5′-3′) AGCAAAGGTCGGAGTGGAG and Rv (5′-3′) CGGAGCTTGATGCTTCTTGT, mixed in 20 μL reaction containing iQ SYBR Green Supermix (Bio-Rad, Hercules, CA, USA). The samples were run on the CFX Connect Real-time system (Bio-Rad, Hercules, CA, USA) set at the following running condition: 5 minutes at 95°C followed by 45 cycles of amplification with denaturation for 5 seconds at 95° C, annealing for 30 seconds at 55°C, and extension for 20 seconds at 72°C. Each reaction was replicated three times.
Agronomic characterization of OsLCT1-transgenic plants
The seedlings of each T
1 plant were established in the field in three plots arranged in Randomized Complete Block Design (RCBD). At mature grain stage, agronomic data were gathered as described (
IRRI 1996). The plant height, which was measured from the soil surface to tip of the tallest panicle, along with culm length, and panicle length were measured in centimeters (cm); the grain length and grain width were measured in millimeters (mm), and the number of productive tillers was counted.
Evaluation of tolerance to salinity was conducted in the greenhouse at seedling stage. Each of the three biological replicates was composed of 20 T
1 seedlings. The two-week-old seedlings of transgenic plants together with salt tolerant control ‘Hwayeong’ and the susceptible wild-type ‘Dongjin’ were treated with a freshly prepared 200 mM NaCl solution. The plants were scored before and seven days after treatment. The seedlings were evaluated using the scales described in
IRRI (1996) as follows: 1 = normal growth and no leaf symptoms, 3 = nearly normal growth but leaf tips of few leaves discolored and rolled, 5 = growth is severely retarded with most leaves rolled and only a few are elongating, 7 = complete cessation of growth along with drying of some leaves and some plants died, and 9 = almost all plants died. The ion leakage was measured before and after autoclaving a 10 ml distilled water containing an approximately 5mm excised discs of 2
nd and 3
rd youngest leaves, using multi-range EC meter (HANNA Instruments, Woonsocket, RI, USA). The plants were oven-dried at 60°C to a constant weight to obtain the shoot biomass and percent moisture content.
Data were analyzed using the SAS 9.4m5 (SAS Institute Inc,
https://www.sas.com). For agronomic traits, the significant
P value was further analyzed using the two-sided Dunnett’s multiple comparisons with the wild-type as the control. Quantitative data for salinity screening were analyzed using Duncan’s multiple range test (DMRT).
RESULTS
Sequence and structural analysis of OsLCT1
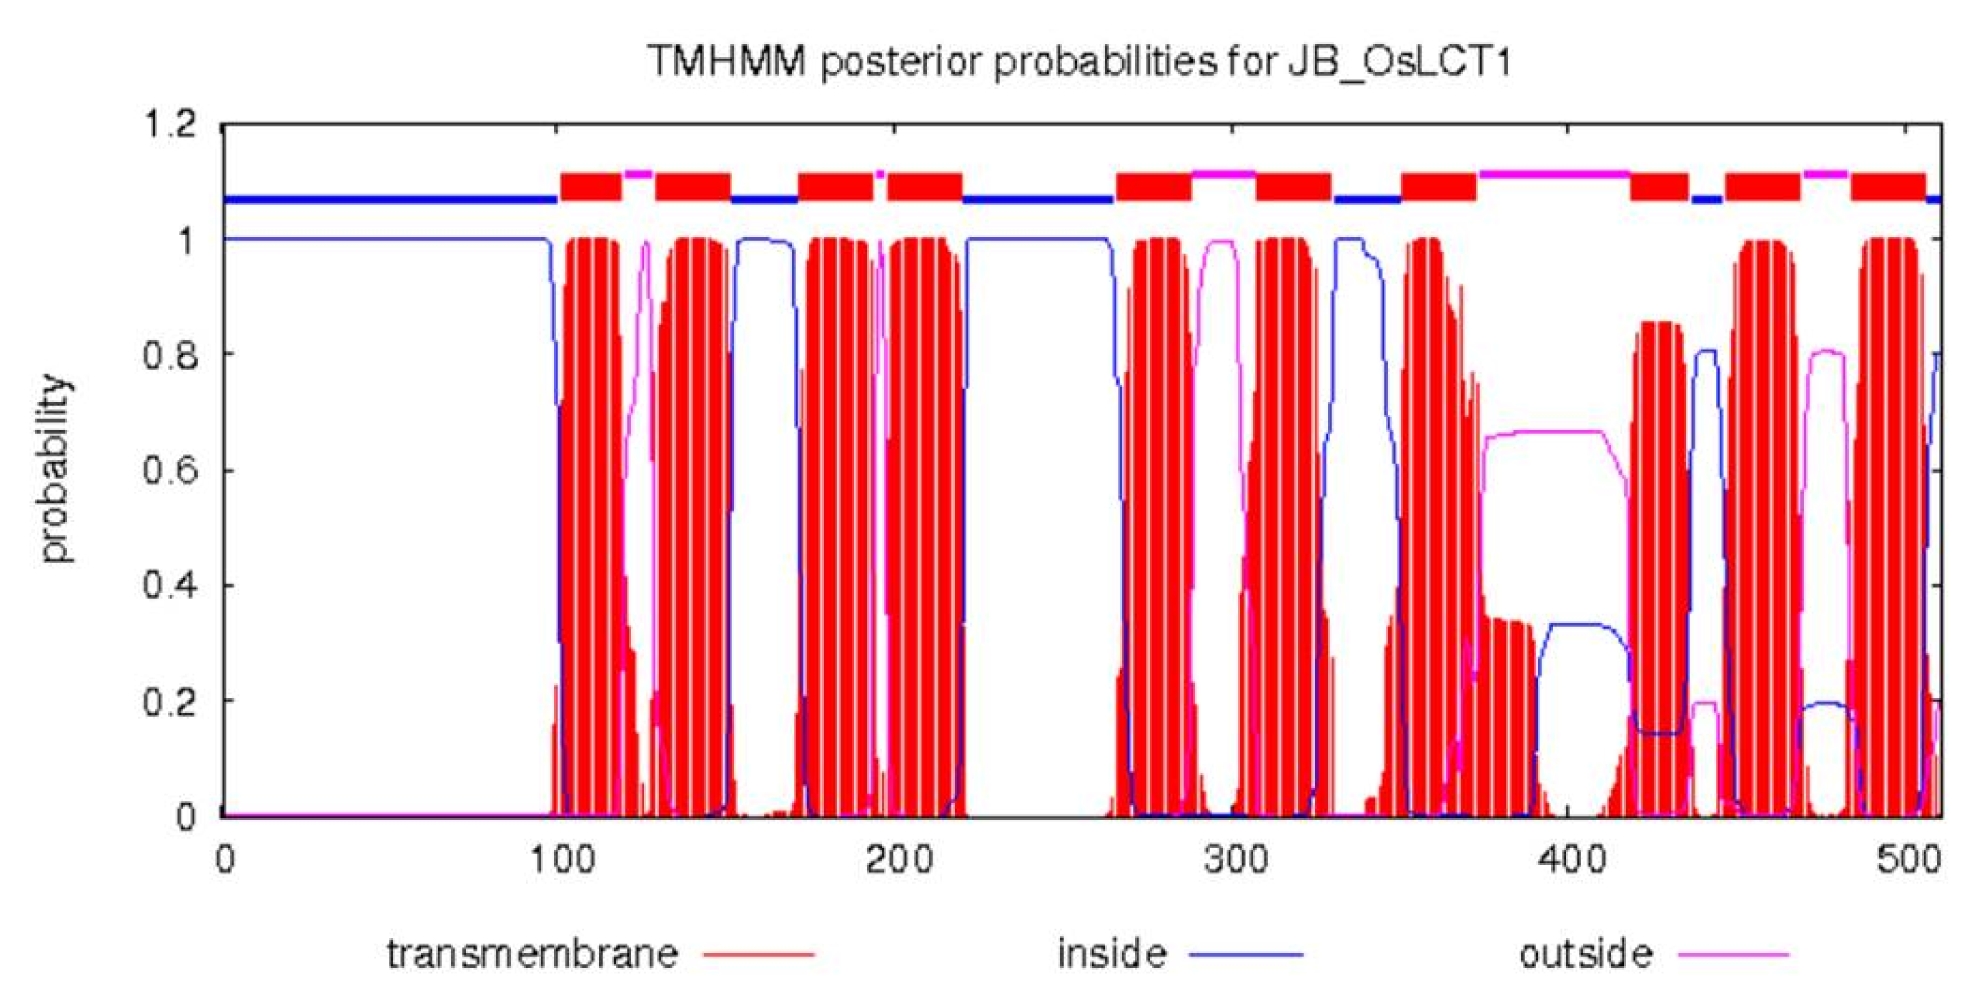
OsLCT1 is located on the long arm of chromosome 6 of the rice genome. It has an open reading frame (ORF) of 1,536 bp which encodes 512 amino acid residues. Analysis of the secondary structure of this protein suggests it contained 10 transmembrane helices (
Fig. 2). Alignment of the query (Jinbaek) and the reference (Nipponbare)
LCT1 sequence revealed a single base nucleotide substitution or a missense type of mutation (TTG → TCG), which resulted in one amino acid (Leu → Ser) change in a protein (data not shown). To determine the relationship of the representative members of grass plants, estimates of evolutionary divergence (
Table 1) was computed and a phylogenetic tree (
Fig. 3) was constructed. ‘Nipponbare’ and ‘Jinbaek’, both
japonica cultivars, were indeed highly related (d = 0.002). The highest number of polymorphism was found between
O. punctate and
O. meridionalis, whilst ‘Jinbaek’ was found to be distantly related to
S. officinarum (d = 1.199). The tree showed that all entries fell into three groups. Moreover, the rice groups (African rice,
japonica,
indica) were found to be closely associated with
S. italica than the other members of the Poaceae.
Generation of OsLCT1-overexpression lines
The full-length cDNA of
OsLCT1 was overexpressed into the genome of
japonica rice cv. ‘Dongjin’ using the CaMV 35S promoter. A total of 26 T
0 plants were regenerated on a Murashike-Skoog (MS) medium treated with 1,000 ng/L hygromycin. Results of genomic PCR confirmed the presence of the inserted gene in 17 lines (
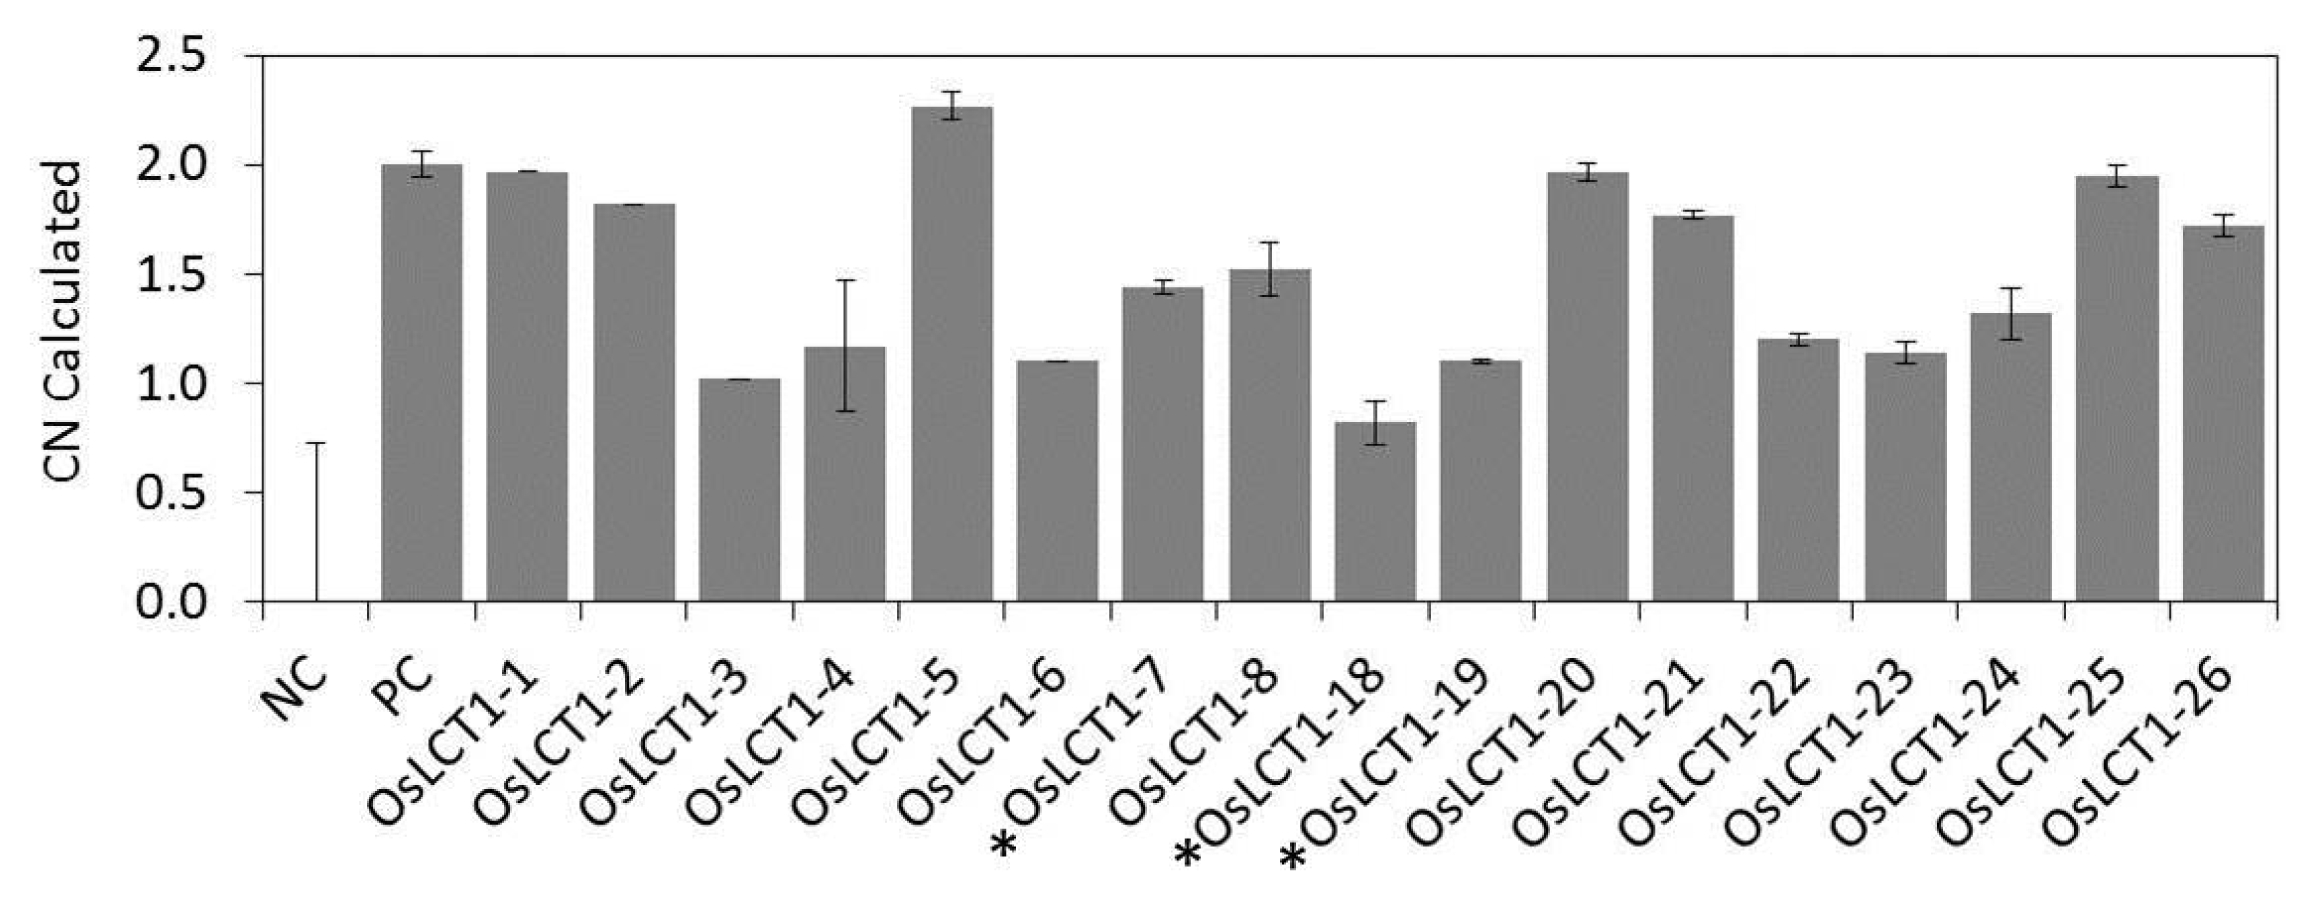
Fig. 4). The gene copy number of these lines was investigated using TaqMan RT-qPCR. It was shown that 9 lines carried a single gene copy (calculated copy number ranges from 0.82 ± 0.10 to 1.44 ± 0.03) and the remaining 8 lines contained two gene copies (1.52 ± 0.12 to 2.27 ± 0.06) (
Fig. 5). Lines with single gene copy were then transplanted into soil in the greenhouse and acclimatized for two weeks for transplanting in the field.
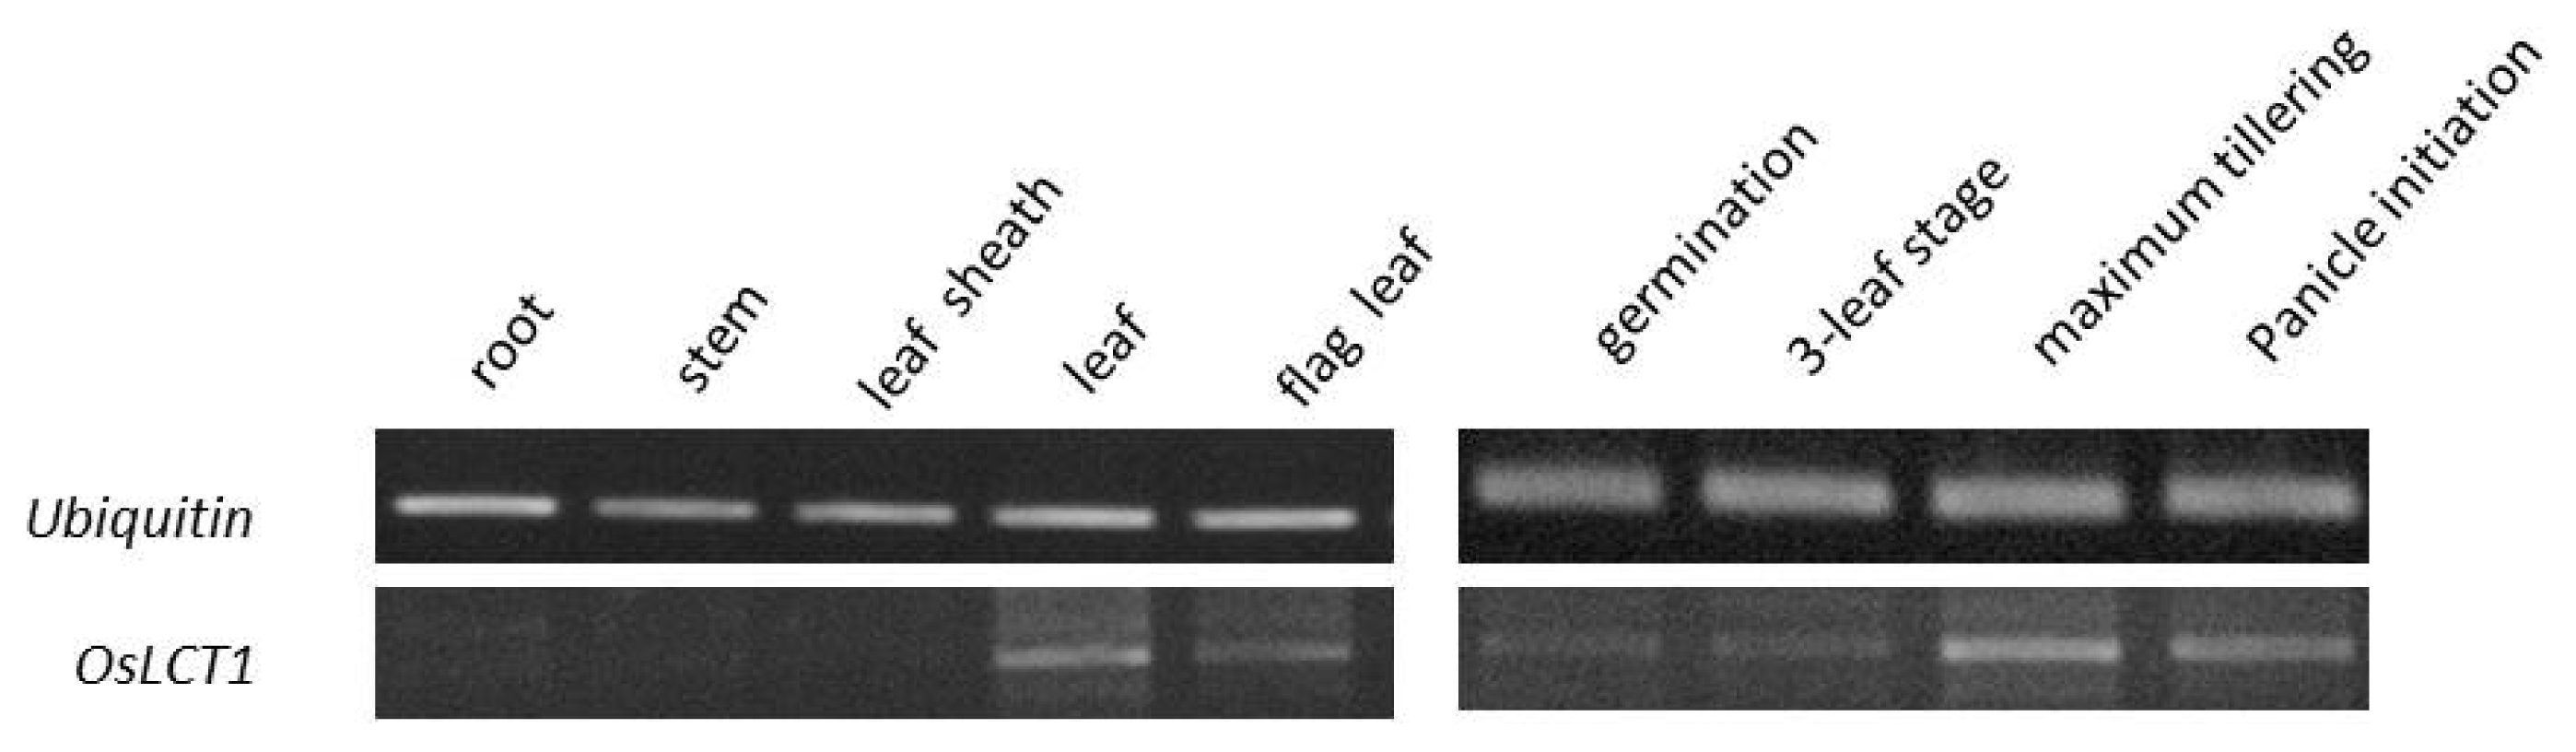
Results of RT-PCR assay revealed that
OsLCT1 was expressed in the leaf and flag leaf tissues, whereas no trace of expression was observed in the root, stem, and leaf sheath. Moreover, the gene was more expressed during the late stage, at maximum tillering and panicle initiation (
Fig. 6).
A significant increase in height was observed in two transgenic plants (OsLCT1-18, -19). The plant OsLCT1-7 showed a significant lower culm length than the wild-type. Plants OsLCT1-18 and -19 showed longer culm length and panicle length than the wild-type, but the difference was not significant. Differences in the number of productive tiller and grain width were also found non-significant. A significant increase in the grain length was observed in OsLCT1-18 and -19 (
Table 2,
Fig. 7).
A striking difference in the phenotypic reaction of the
OsLCT1-overexpression plants and the wild-type was observed against salt stress. At 7 days after treatment, a complete cessation of plant growth of the wild-type ‘Dongjin’ was observed, and most leaves have wilted. The three transgenic plants (7, 18, 19) exhibited a better condition than the wild-type although rolling and wilting were noted in few leaves, unlike in ‘Hwayeong’ which showed a relatively healthy growth with only very few leaves started to show the stress symptoms (
Table 3,
Fig. 8). Using the SES rating scale, the transgenic plants were moderately tolerant, the wild-type was susceptible, whereas ‘Hwayeong’ was highly tolerant. The observed phenotypes were found correlated with biomass, moisture content, and electrical conductivity. The shoot biomass and the moisture content of all three transgenic plants were significantly intermediate of the wild-type Dongjin, which showed the lowest value, and ‘Hwayeong’, which was the highest. A significant lower ion leakage (μS/cm) was also observed in all transgenic plants than in wild-type. Although a significant difference was noted between the overexpression plants, all three were significantly higher compared with ‘Hwayeong’
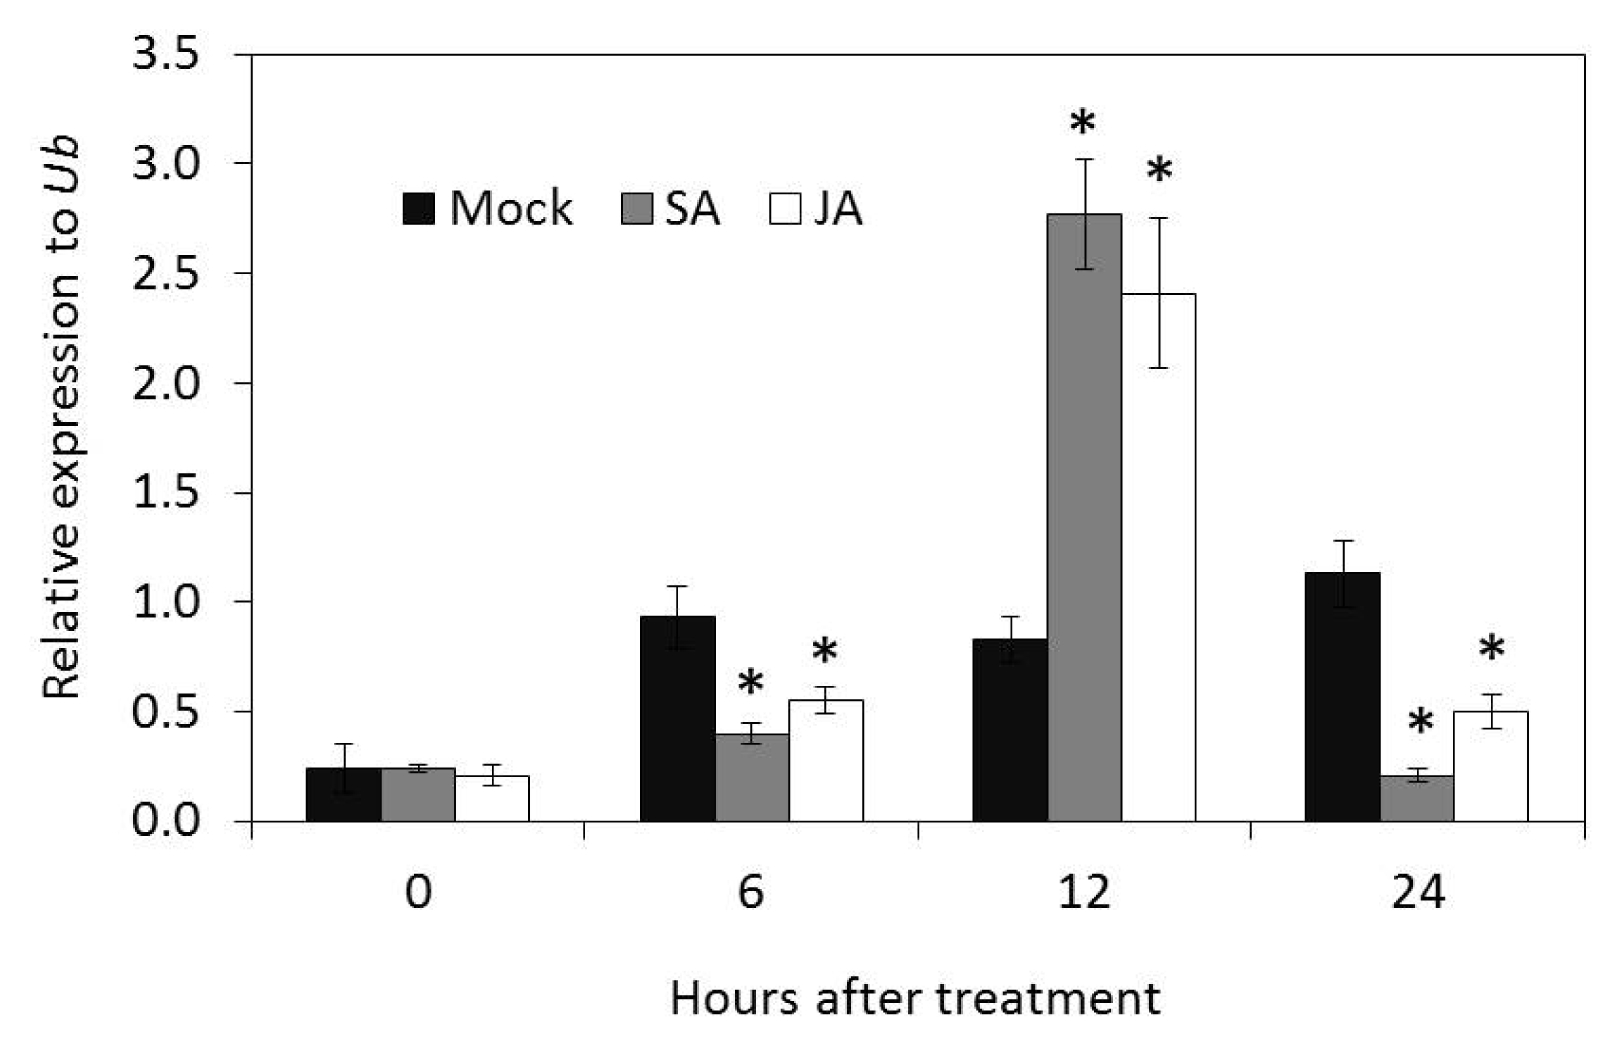
The mRNA expression of
OsLCT1 was relatively induced by exogenous application of SA and JA in rice plants. The relative optimum expression value in response to both treatments was observed at 12 hours after treatment which also marked the onset of induction of transcripts. The fold expression value was slightly higher in SA treatment, but both were inhibited at 24 hours after treatment (
Fig. 9).
DISCUSSION
In higher plants, the coordinated expression of transport mechanisms is essential for specialized cellular processes and for adaptation to variable environmental conditions (Schactman
et al. 1997).
Low-affinity cation transporter 1 (
LCT1) has been previously demonstrated to play as a Cd transporter gene responsible for Cd accumulation in the grain of Nipponbare (
Uraguchi et al. 2014). The functional annotation has classified
OsLCT1 as an integral component of membrane predicted to contain 10 membrane helices. The non-synonymous substitution of amino acid sequence (Leu → Ser) in
LCT1 locus among highly closely related
japonica cultivars (Jinbaek, Nipponbare) may possibly render the resulting protein variable or nonfunctional. In a similar report, a single amino acid substitution (position 80) in OsHMA3, a vacuolar Cd transporter in roots, is suggested as crucial for the loss-of-function of this allele in Anjana Dhan, a high-Cd containing cultivar (
Ueno et al. 2010;
Miyadate et al. 2011). However, the absence of such polymorphism in Habataki, a high-Cd accumulating
indica (
Takahashi et al. 2011), disproved the former (
Uraguchi et al. 2014).
Investigation of transcript abundance of
OsLCT1 in different tissues and growth stages in rice revealed that activation of this gene is restricted particularly to a specific developmental stage such as during maximum tillering and reproductive. Moreover, this gene is actively transcribed in a tissue-specific manner such as in the leaves and flag leaf. It has been suggested that strong expression of this gene during reproductive stages in the shoots particularly leaves and nodes suggests its crucial function in the translocation of Cd from the leaves and/or redirecting it in the nodes via intervascular transfer (
Uraguchi et al. 2011;
Uraguchi et al. 2014).
Evaluation of the agronomic traits of transgenic plants in the field revealed that overexpression of OsLCT1 significantly increased the height and grain length of the rice plant. The phenotypic aberration, particularly in height, was attributed to the combined increase in the culm length and panicle length. The phenotypes shown by the overexpression lines in the current study can be ascribed to the enriched physiological processes that are directly affected by the improved transport system of cations across membranes in plants including mineral nutrition and cell expansion (Schactman et al. 1997).
The abundance of membrane transport mechanisms in the plasma and vacuole membranes of higher plants ensures mineral uptake from soils even under challenging environmental conditions (
Marschner 1995). However, non-essential metals also cross plasmalemma and internal membranes through cation transporters with a broad substrate specificity or use pathways reserved for other ions (
Williams et al. 2000;
Clemens 2001;
Antosiewicz and Hennig 2004).
OsLCT1-mediated transport of Cd in rice which results in accumulation in rice grain had been previously characterized (
Uraguchi et al. 2011). In another functional genetic analysis involving
LCT1 from
Triticum aestivum being employed to complement a yeast mutant deficient in potassium (K
+) uptake, it was shown that
LCT1 mediated low-affinity uptake of the cations including Rb
+ and Na
+, and possibly allowed Ca
2+ but not Zn
2+ uptake (Schactman
et al. 1997). To evaluate if overexpressing this gene will alter the physiological response of transgenic
japonica rice to salt toxicity, we performed salt screening at seedling stage. Interestingly, our results showed that overexpression of
OsLCT1 ameliorated tolerance of
japonica rice to salt toxicity. Further tests revealed that the transgenic plants contained more water content and shoot biomass than the wild-type. Accumulating evidence suggested that the electrolyte leakage from plants cells is mainly related to plasma membrane cation conductance-mediated K
+ efflux (
Vadim et al. 2013).
Nassery (1975,
1979) demonstrated that NaCl of more than 50mM concentration induces K
+. A follow-up investigation provided strong evidence that salt-induced K
+ is a rapidly activating process that results in a significant decline of K
+ activity in the cytosol (
Shabala et al. 2006;
Vadim et al. 2013). Furthermore, it has been reported that maintaining high cytosolic K
+ activity is crucial for plant tolerance to high NaCl (
Maathuis and Amtmann 1999;
Demidchik and Maathuis 2007;
Shabala and Cuin 2008;
Velarde-Buendía et al. 2012;
Vadim et al. 2013). In the current study, the electrolyte conductance was significantly lower in all transgenic plants than in wild-type, although the level was relatively higher than in salt tolerant standard ‘Hwayeong’, which was consistent with the previous reports.
Plant hormones have been demonstrated to play conserved and divergent roles in fine-tuning plant’s adaptation to environmental changes. The activity of JA responses is regulated by antagonistic cross-talk with salicylic acid (SA) signaling (
Lorenzo and Solano 2005;
Balbi and Devoto 2008). In the current study, exogenous application of salicylic acid and jasmonic acid induced the expression of
LCT1 at 12 hours after treatment. The expression profiling and physiological characterization conducted by
Walia et al. (2007) on salinity stress response in barley implicate JA-mediated adaptation to salinity stress.
Zhao et al. (2014) also showed that a wheat allene oxide cyclase (AOC) gene improves tolerance to salt toxicity via JA signaling pathway. Our mRNA expression analysis may be insufficient, but the induction of
LCT1 by these phytohormones probably suggests possible regulation of membrane transporter by plant hormone signaling pathways although this requires further analysis.
In summary, results from salinity screening at seedling stage showed an interesting physiological response to high salt stress. Although the current study lacks in-depth molecular and genetic component to highlight the specific function of rice LCT1 in ameliorating salt toxicity, our results provide a new perspective on the possible additional biological process enriched by low-affinity cation transporter in plants. Yet overall, our findings suggest that the OsLCT1 gene can be useful to develop new resistant varieties against salinity stress.
ACKNOWLEDGEMENTS
This research was supported by the Next-Generation BioGreen 21 Program (The Agricultural Genome Center, No. PJ01330201), Rural Development Administration, Republic of Korea.
Fig. 1Schematic diagram of pCAMbia1300 containing the full-length cDNA of OsLCT1 from japonica rice ‘Jinbaek’. The ORF was ligated into the SacI and XbaI enzyme sites of the vector.
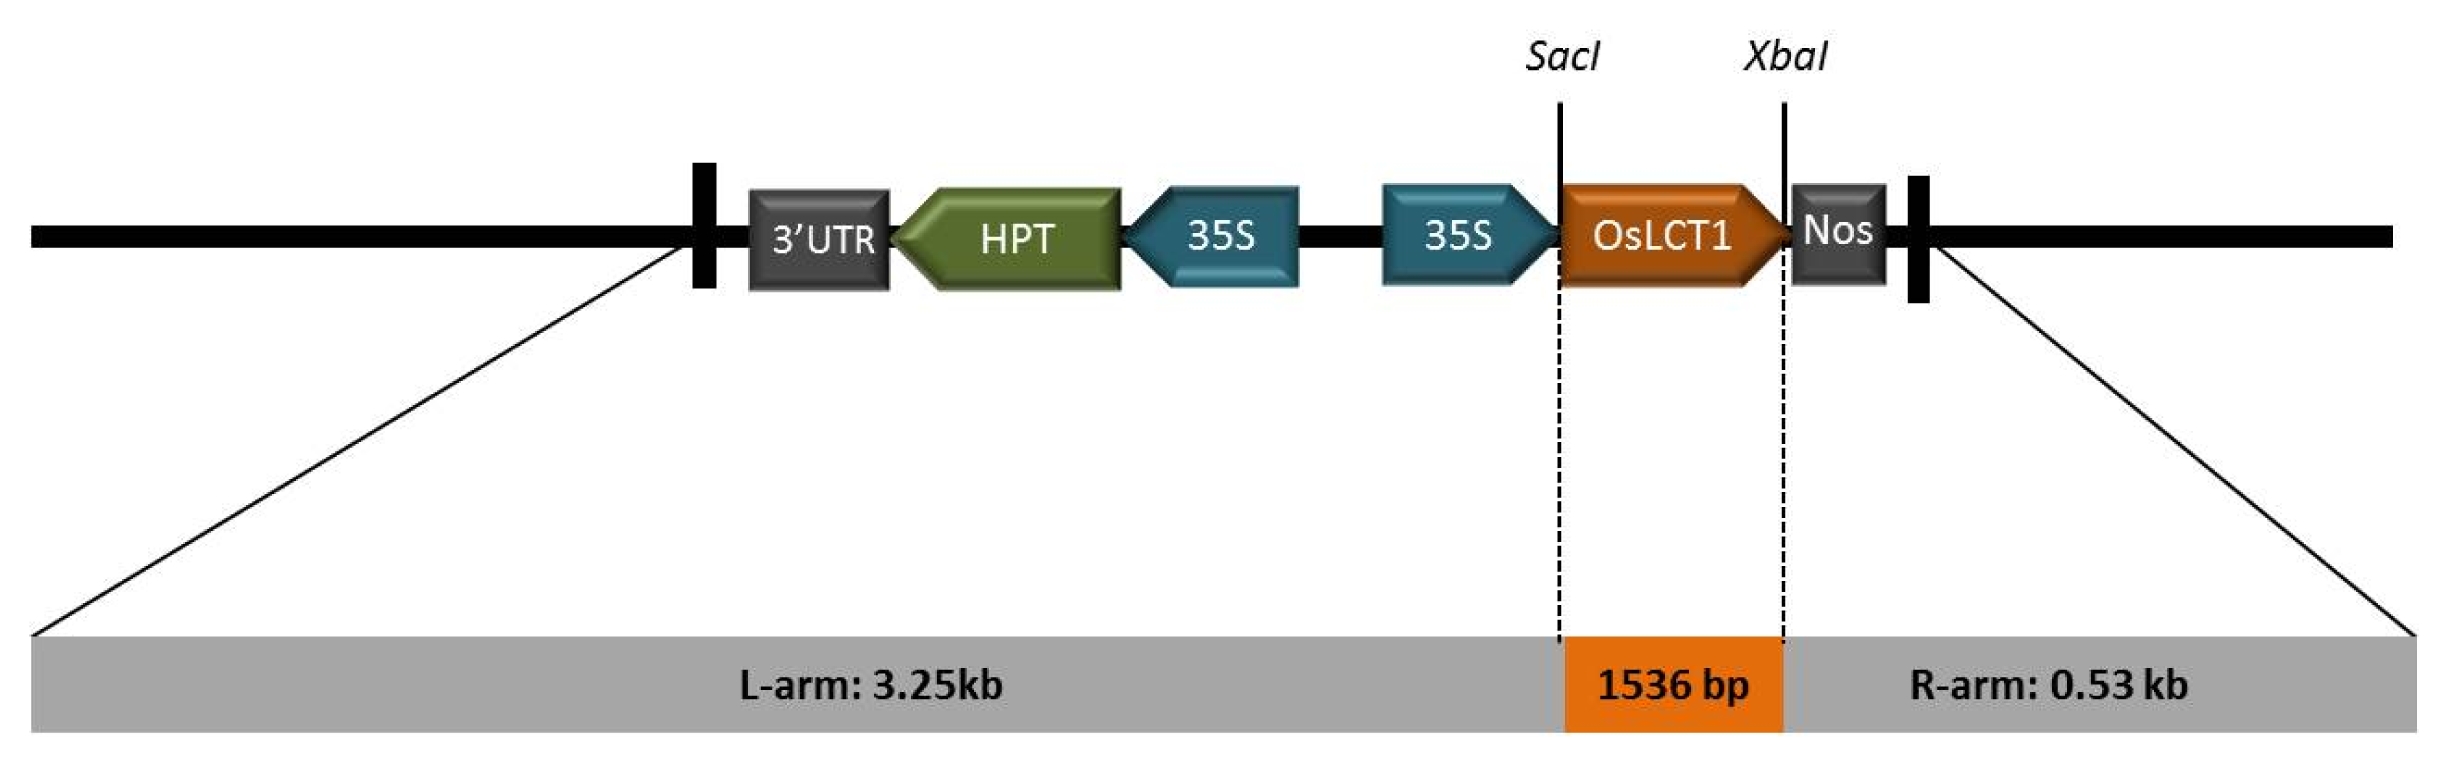
Fig. 2Secondary structure of protein OsLCT1. The protein contains 10 transmembrane helices.

Fig. 3Evolutionary relationship of 13 representative members of monocot plants based on the amino acid sequence of
OsLCT1. The evolutionary history was inferred using the Neighbor-Joining method. The optimal tree with the sum of branch length = 3.44 is shown. The percentage of replicate trees in which the associated taxa clustered together in the bootstrap test (1000 replicates) is shown next to the branches. The evolutionary distances were computed using the Poisson correction method (
Zuckerkandl and Pauling 1965) and are in the units of the number of amino acid substitutions per site. The analysis involved 13 amino acid sequences. All ambiguous positions were removed for each sequence pair. There were a total of 659 positions in the final dataset. Evolutionary analyses were conducted in MEGA7 (
Kumar et al. 2016).
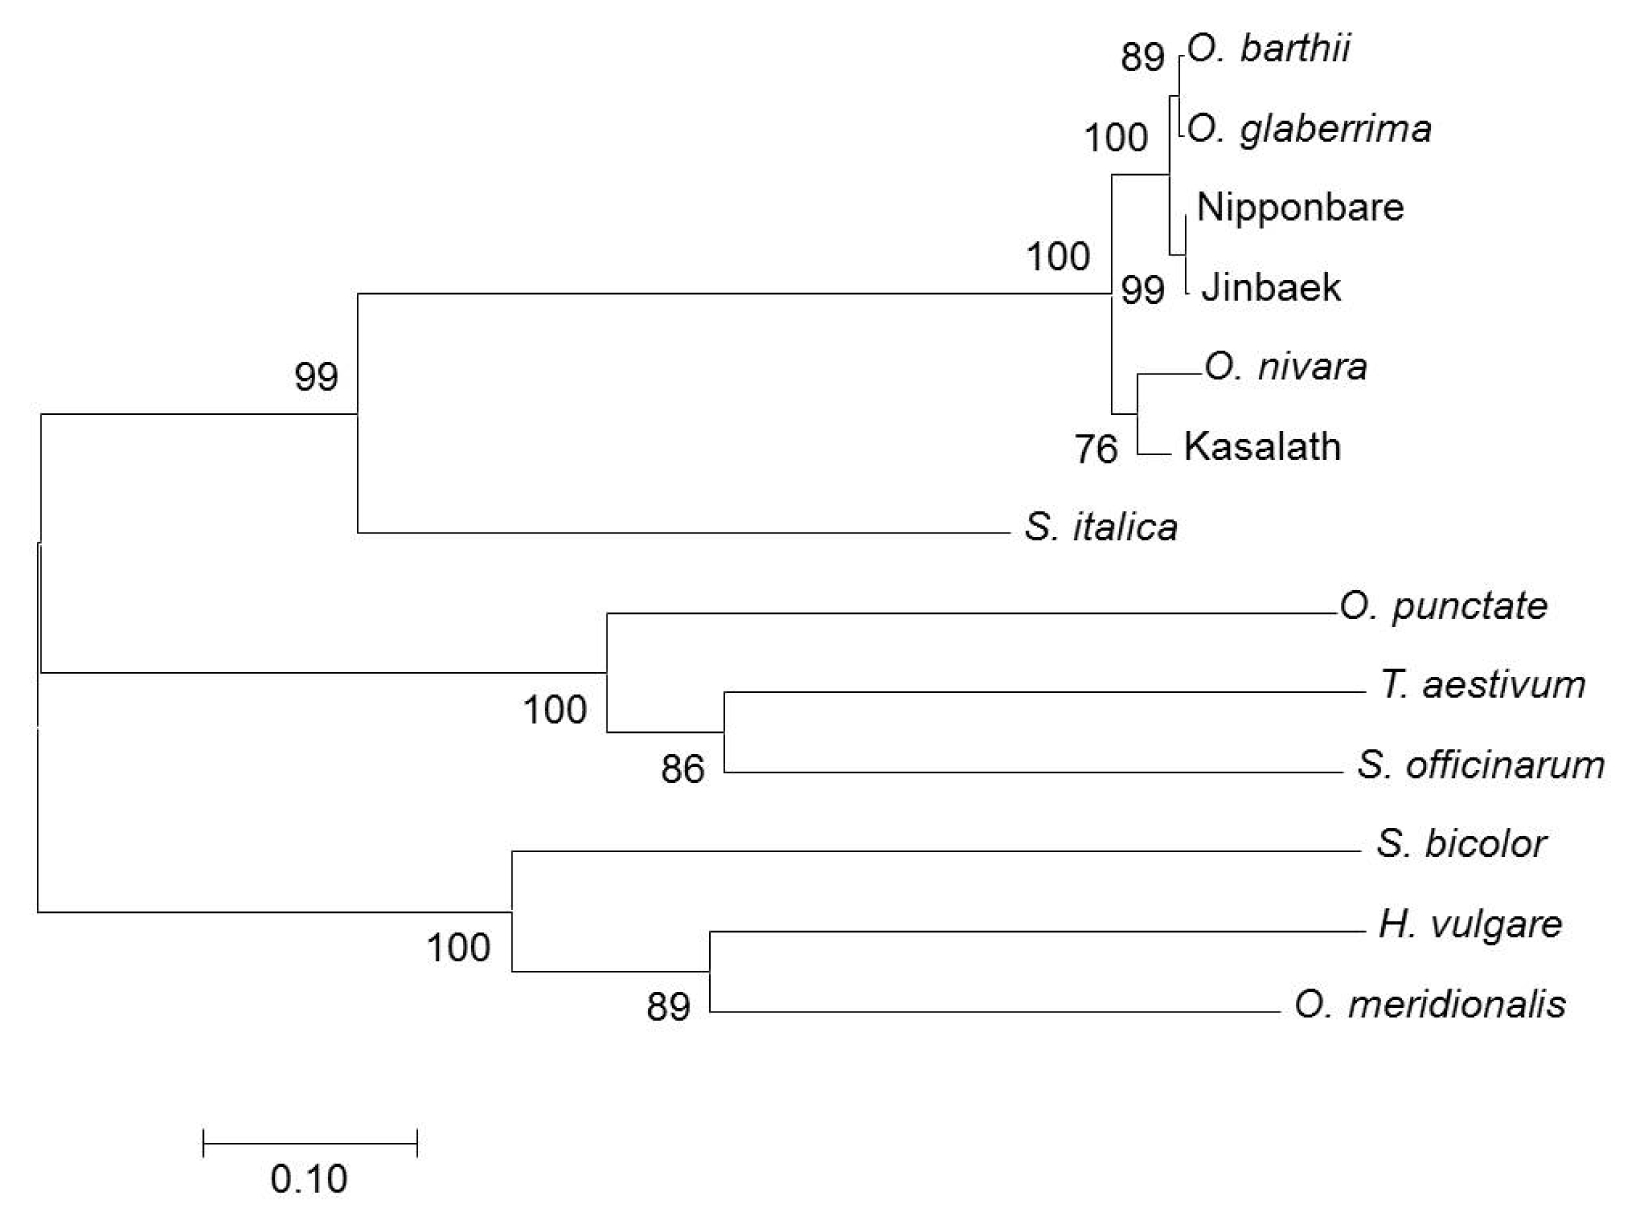
Fig. 4Genomic PCR amplification of the OsLCT1 gene. Bands of approximately 1.6 kb indicate OsLCT1 amplicon. The first lane was wild-type, the second lane (pDNA) was plasmid DNA as a positive control containing the gene, and 3rd to 26th lanes were regenerated T0 plants.
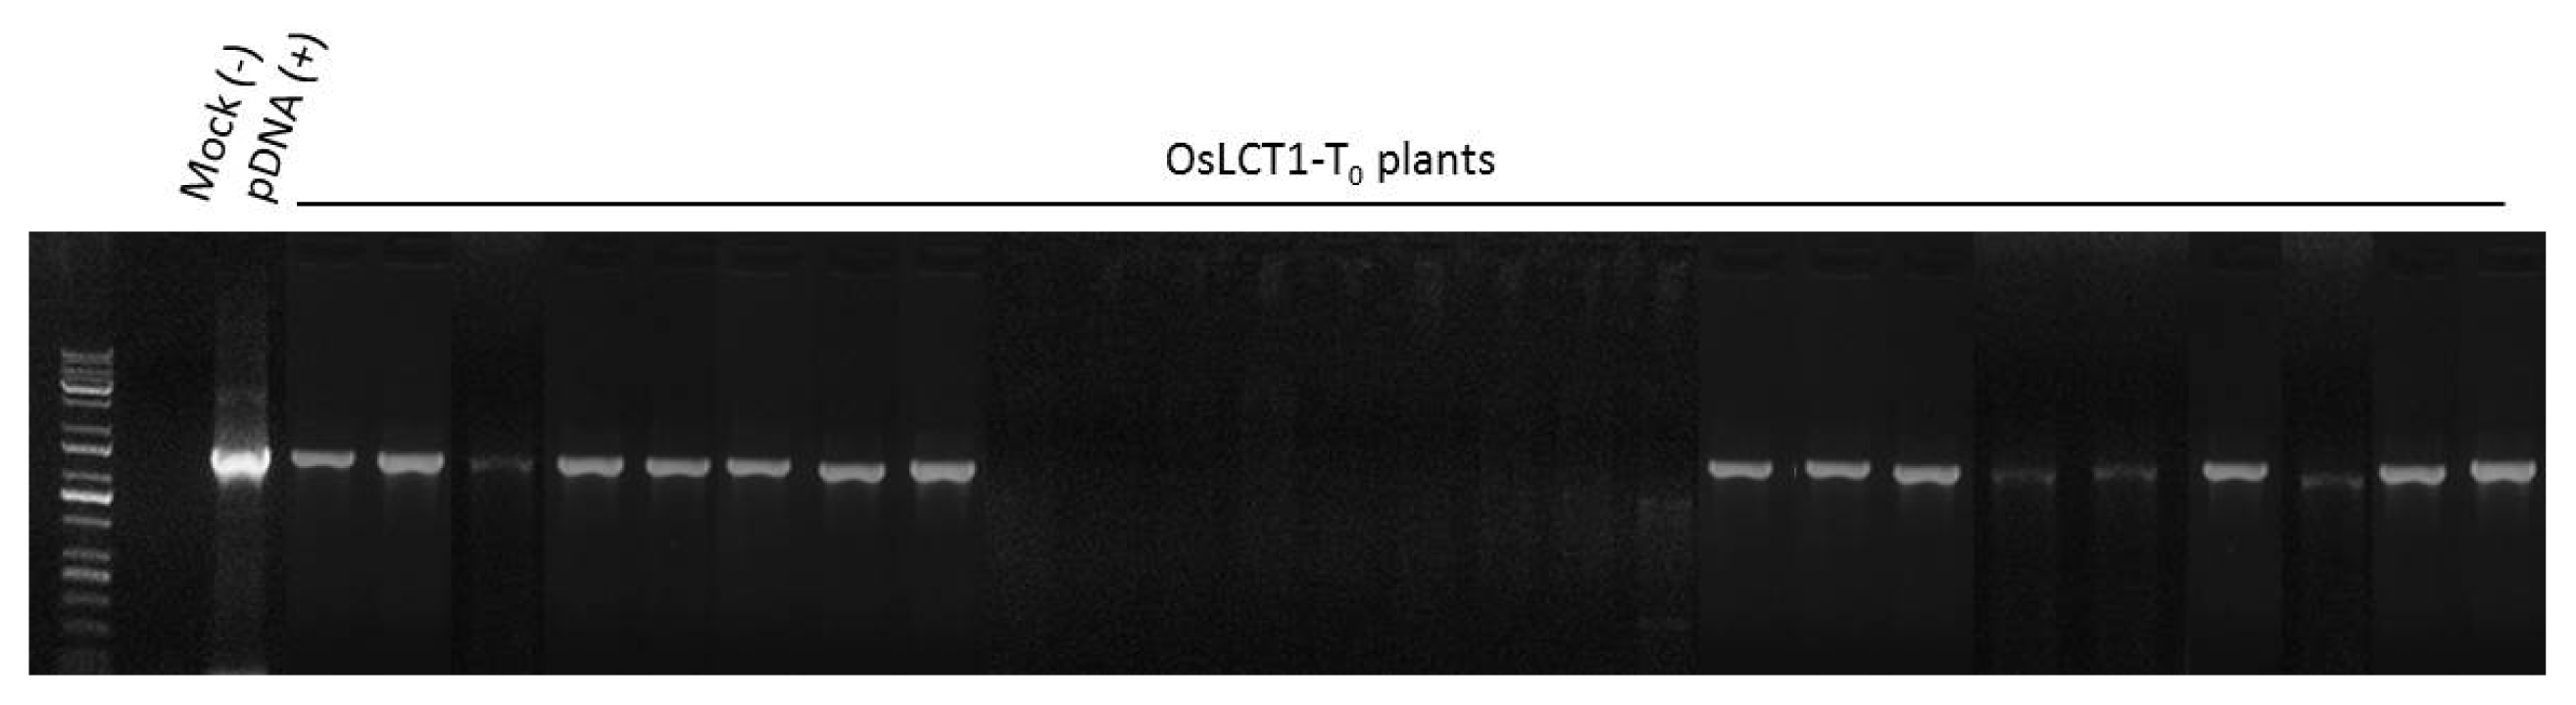
Fig. 5The calculated copy number (CN) of T0 OsLCT1-overexpression rice plants assayed using TaqMan RT-qPCR. Data presented were means ± SD from three replications. Plants with asterisk (*) were selected for further experiments. NC = negative control, PC = double copy positive control.

Fig. 6Expression of OsLCT1 in different tissues and growth stages of the rice plant.

Fig. 7The phenotype of wild-type ‘Dongjin’ and representative of three overexpression plants in T1 generation during the mature stage in the field.
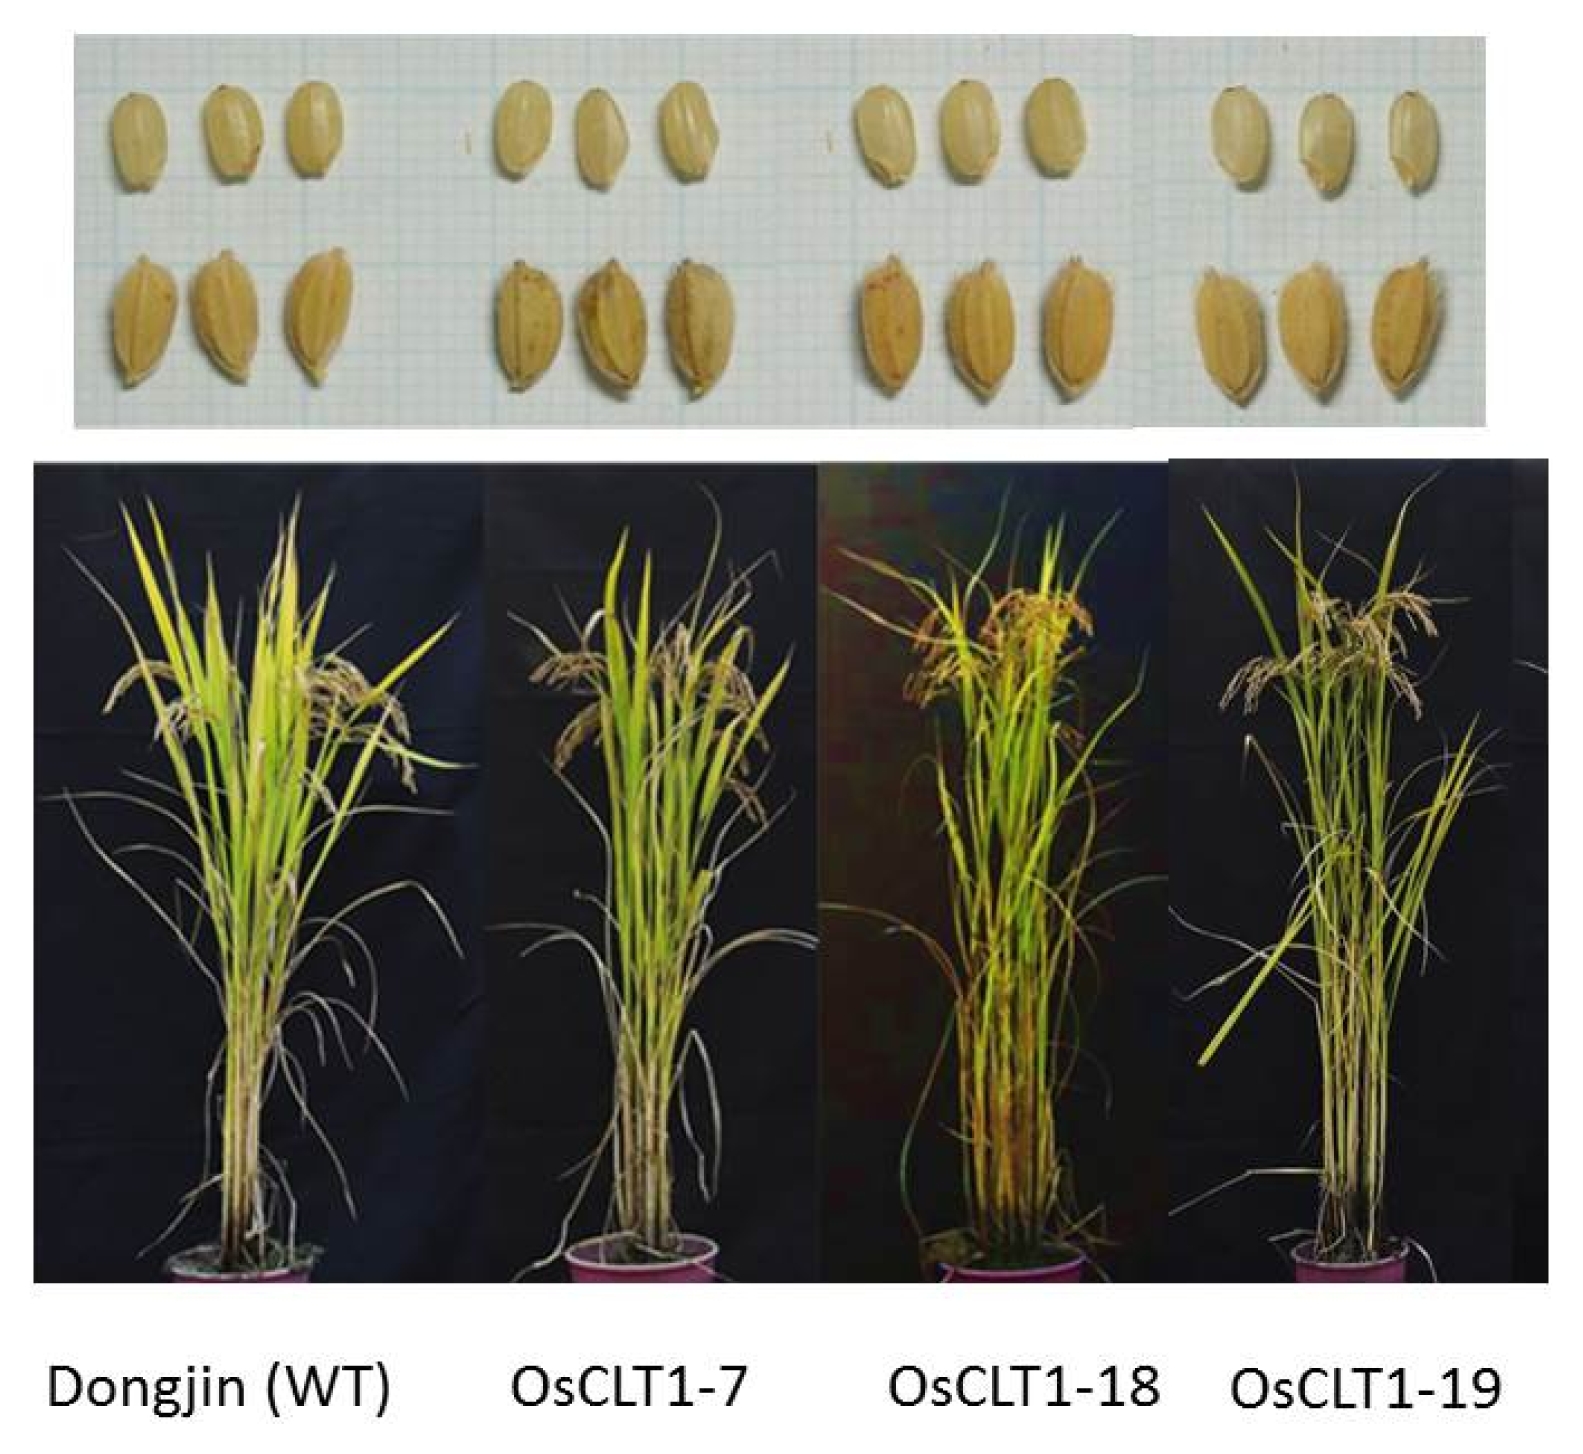
Fig. 8Phenotypic responses of OsLCT1–overexpression rice evaluated against salinity stress (200 mM NaCl). Hwayeong = tolerant (T) control; Dongjin = susceptible (S), wild-type (WT).
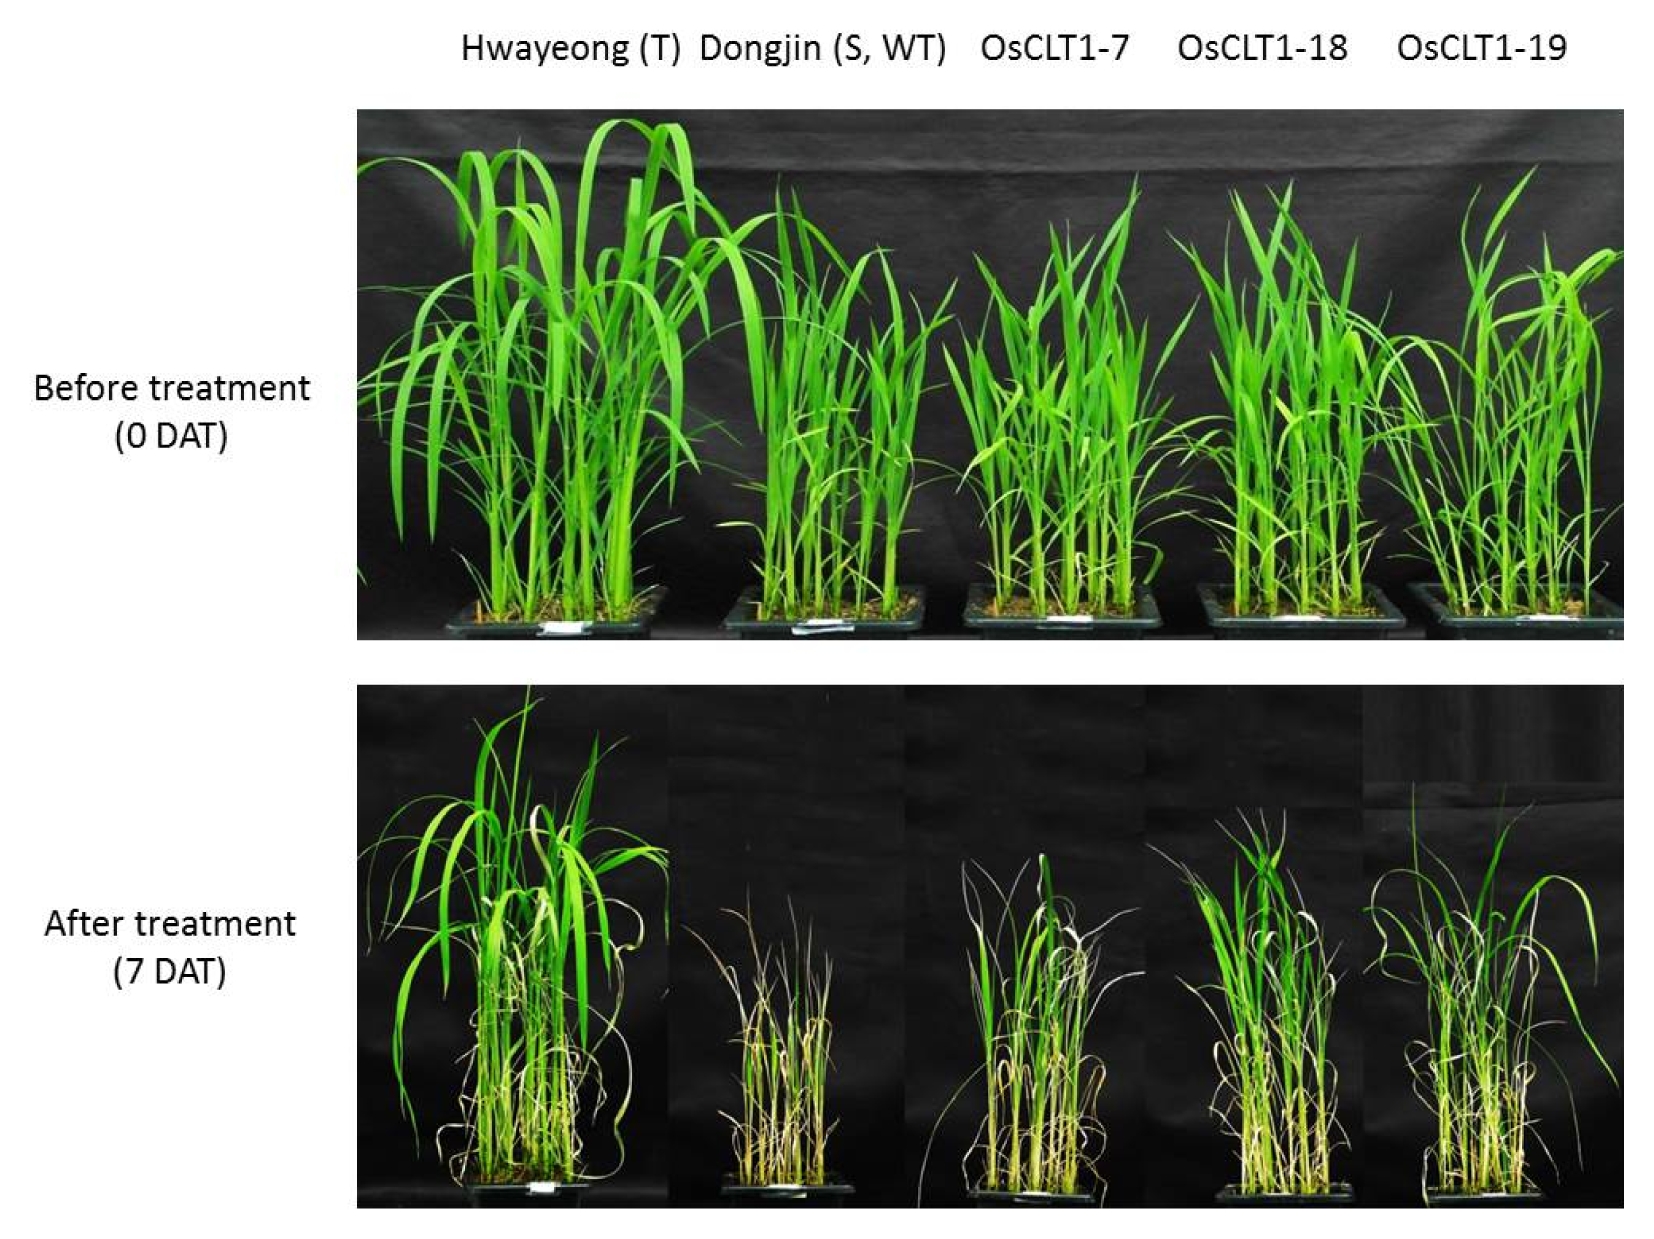
Fig. 9Induction of transcripts level of OsLCT1 after treatment with 100 mM salicylic acid and 100 mM jasmonic acid. Data presented were relative expression means ± SD from three replicates after normalization by Ubiquitin (Ub) expression. Mock = water, SA = salicylic acid, JA = jasmonic acid.

Table 1Estimates of evolutionary divergence between OsLCT1 amino acid sequences of representative members of grass family. The number of amino acid substitutions per site from between sequences are shown. Standard error estimate(s) are shown above the diagonal. Analyses were conducted using the Poisson correction model (
Zuckerkandl and Pauling 1965). The analysis involved 13 amino acid sequences. All ambiguous positions were removed for each sequence pair. There were a total of 659 positions in the final dataset. Evolutionary analyses were conducted in MEGA7 (
Kumar et al. 2016).
Table 1
|
T. aestivum
|
H. vulgare
|
S. officinarum
|
O. nivara
|
O. punctata
|
O. meridionalis
|
O. barthii
|
O. glaberrima
|
S. italica
|
S. bicolor
|
Nipponbare |
Kasalath |
Jinbaek |
|
T. aestivum
|
|
0.071 |
0.060 |
0.069 |
0.046 |
0.066 |
0.065 |
0.065 |
0.069 |
0.126 |
0.065 |
0.064 |
0.065 |
|
H. vulgare
|
1.180 |
|
0.103 |
0.073 |
0.074 |
0.042 |
0.066 |
0.066 |
0.072 |
0.090 |
0.066 |
0.068 |
0.066 |
|
S. officinarum
|
0.588 |
1.174 |
|
0.108 |
0.067 |
0.098 |
0.097 |
0.097 |
0.095 |
0.130 |
0.098 |
0.102 |
0.098 |
|
O. nivara
|
1.127 |
1.125 |
1.1204 |
|
0.065 |
0.071 |
0.015 |
0.015 |
0.053 |
0.134 |
0.014 |
0.011 |
0.014 |
|
O. punctata
|
0.717 |
1.242 |
0.661 |
1.069 |
|
0.074 |
0.059 |
0.060 |
0.065 |
0.123 |
0.060 |
0.060 |
0.060 |
|
O. meridionalis
|
1.153 |
0.573 |
1.109 |
1.071 |
1.269 |
|
0.068 |
0.068 |
0.073 |
0.078 |
0.069 |
0.069 |
0.069 |
|
O. barthii
|
1.168 |
1.144 |
1.184 |
0.081 |
1.135 |
1.124 |
|
0.003 |
0.049 |
0.109 |
0.005 |
0.011 |
0.006 |
|
O. glaberrima
|
1.175 |
1.144 |
1.184 |
0.081 |
1.142 |
1.124 |
0.004 |
|
0.049 |
0.109 |
0.005 |
0.011 |
0.006 |
|
S. italica
|
1.053 |
1.129 |
0.999 |
0.730 |
1.032 |
1.099 |
0.680 |
0.680 |
|
0.135 |
0.050 |
0.049 |
0.050 |
|
S. bicolor
|
1.305 |
0.845 |
1.116 |
1.070 |
1.262 |
0.707 |
1.142 |
1.142 |
1.079 |
|
0.111 |
0.113 |
0.111 |
|
Nipponbare |
1.161 |
1.137 |
1.199 |
0.075 |
1.129 |
1.117 |
0.014 |
0.014 |
0.685 |
1.180 |
|
0.01 |
0.002 |
|
Kasalath |
1.153 |
1.169 |
1.210 |
0.045 |
1.124 |
1.126 |
0.063 |
0.061 |
0.677 |
1.200 |
0.057 |
|
0.011 |
|
Jinbaek |
1.161 |
1.137 |
1.199 |
0.078 |
1.129 |
1.117 |
0.016 |
0.016 |
0.690 |
1.180 |
0.002 |
0.059 |
|
Table 2Evaluation of morpho-agronomic characteristics of OsLCT1-overexpression and wild-type plants under field condition.
Table 2
|
Plants |
Height (cm) |
Culm length (cm) |
Panicle length (cm) |
Tiller |
Grain length (mm) |
Grain width (mm) |
|
Dongjin |
1,098.17 ± 43.76 |
841 ± 45.18 |
199.33 ± 3.88 |
11.5 ± 0.00 |
7.35 ± 0.14 |
3.09 ± 0.06 |
|
OsLCT1-7 |
1,053.67 ± 38.26 |
750.33 ± 55.5* |
188.17 ± 12.98 |
11.17 ± 1.26 |
7.45 ± 0.11 |
3.15 ± 0.09 |
|
OsLCT1-18 |
1,169.83 ± 21.51* |
876.67 ± 19.05 |
200 ± 3.28 |
8.83 ± 1.26 |
7.65 ± 0.05* |
3.22 ± 0.11 |
|
OsLCT1-19 |
1,212.33 ± 42.03* |
877.5 ± 43.37 |
201 ± 31.75 |
12 ± 2.78 |
7.79 ± 0.15* |
3.16 ± 0.04 |
|
|
CV (%) |
3.30 |
5.13 |
8.79 |
15.19 |
1.55 |
2.54 |
Table 3Response of two-week-old seedlings of OsLCT1-overexpression and wild-type plants seven days after treatments with 200 mM NaCl stress.
Table 3
|
Plants |
Shoot Biomass (g) |
% Moisture Content |
EC (μS/cm) |
Salinity Score |
|
|
7 DAT |
7 DAT |
7 DAT |
7DAT |
Reaction |
|
Dongjin |
1.84 ± 0.44c
|
61.20 ± 4.03c
|
89.89 ± 0.23a
|
8.27 ± 0.21a
|
S |
|
Hwayeong |
5.82 ± 0.94a
|
75.27 ± 0.26a
|
33.16 ± 0.82d
|
1.77 ± 0.25c
|
HT |
|
OsLCT1-7 |
3.11 ± 0.10b
|
69.12 ± 1.27b
|
52.91 ± 0.39c
|
4.63 ± 0.25b
|
MT |
|
OsLCT1-18 |
3.08 ± 0.19b
|
70.97 ± 1.71b
|
53.74 ± 0.26bc
|
4.27 ± 0.32b
|
MT |
|
OsLCT1-19 |
2.98 ± 0.34b
|
71.48 ± 1.70b
|
54.22 ± 0.38b
|
4.43 ± 0.35b
|
MT |
|
|
CV (%) |
9.94 |
3.13 |
0.82 |
6.83 |
|
References
- Antosiewicz DM, Hennig J. 2004. Overexpression of LCT1 in tobacco enhances the protective action of calcium against cadmium toxicity. Environ Pollut. 129: 237-245.
- Balbi V, Devoto A. 2008. Jasmonate signaling network in Arabidopsis thaliana: crucial regulatory nodes and new physiological scenarios. New Phytol. 177: 301-318.
- Clemens S. 2001. Molecular mechanisms of plant metal tolerance and homeostasis. Planta. 212: 475-486.
- Clemens S, Palmgren MG, Kramer U. 2002. A long way ahead: understanding and engineering plant metal accumulation. Trends Plant Sci. 7: 309-315.
- Demidchik V, Maathuis FJM. 2007. Physiological roles of nonselective cation channels in plants: from salt stress to signaling and development. New Phytol. 175: 387-405.
- di Toppi LS, Gabbrielli R. 1999. Response to cadmium in higher plants. Environmental and Experimental Botany. 41: 105-130.
- Elzam OE, Rains DW, Epstein E. 1964. Ion transport kinetics in plant tissue: complexity of the chloride absorption isotherm. Biochem Biophys Res Commun. 15: 273-276.
- Epstein E, Rains DW. 1965. Carrier-mediated cation transport in barley roots: kinetic evidence for a spectrum of active sites. Proc Natl Acad Sci USA. 53: 1320-1324.
- Harris NS, Taylor GJ. 2001. Remobilization of cadmium in maturing shoots of near-isogenic lines of durum wheat that differ in grain cadmium accumulation. J Exp Bot. 52: 1473-1481.
- Harris NS, Taylor GJ. 2004. Cadmium uptake and translocation in seedlings of near-isogenic lines of durum wheat that differ in grain cadmium accumulation. BMC Plant Biol. 4: 4
- Hart JJ, Welch RM, Norvell WA, Sullivan LA, Kochian LV. 1998. Characterization of cadmium binding, uptake, and translocation in intact seedlings of bread and durum wheat cultivars. Plant Physiol. 116: 1413-1420.
- Hart JJ, Welch RM, Norvell WA, Kochian LV. 2006. Characterization of cadmium uptake, translocation and storage in near-isogenic lines of durum wheat that differ in grain cadmium concentration. New Phytol. 172: 261-271.
- IRRI.1996. Standard evaluation system for rice. 4th Edition. IRRI. The Philippines.
- IRRI.2007. Standard evaluation system for rice. IRRI. Los Baños, Laguna, The Philippines: pp. 56.
- Kikuchi T, Okazaki M, Toyota K, Motobayashi T, Kato M. 2007. The input-output balance of cadmium in a paddy field of Tokyo. Chemosphere. 67: 920-927.
- Kumar S, Stecher G, Tamura K. 2016. MEGA7: Molecular Evolutionary Genetics Analysis version 7.0 for bigger datasets. Mol Biol Evol. 33: 1870-1874.
- Lee HJ, Abdula SE, Jee MG, Jang DW, Cho YG. 2011. High-efficiency and Rapid Agrobacterium-mediated genetic transformation method using germinating rice seeds. J Plant Biotechnol. 38: 251-257.
- Lorenzo R, Solano R. 2005. Molecular players regulating the jasmonate signaling network. Curr Opin Plant Biol. 8: 532-540.
- Lutts S, Kinet JM, Bouharmont J. 1995. Changes in plant response to NaCl during the development of rice (Oryza sativa L.) varieties differing in salinity resistance. J Exp Bot. 46: 1843-1852.
- Marschner H. 1995. Mineral Nutrition of Higher Plants. 2nd ed. Academic Press. San Diego.
- Maathuis FJM, Amtmann A. 1999. K+ nutrition and Na+ toxicity: the basis of cellular K+/Na+ ratios. Annals of Botany. 84: 123-133.
- McGrath SP, Zhao FJ, Lombi E. 2001. Plant and rhizosphere processes involved in phytoremediation of metal-contaminated soils. Plant and Soil. 232: 207-214.
- Miyadate H, Adachi S, Hiraizumi A, Tezuka K, Nakazawa N, Kawamoto T, et al. 2011. OsHMA3, a P1B-type of ATPase affects root-to-shoot cadmium translocation in rice by mediating efflux into vacuoles. New Phytol. 189: 190-199.
- Momayezi MR, Zaharah AR, Hanafi MM, Mohd Razi I. 2009. Agronomic characteristics and proline accumulation of Iranian rice genotypes at early seedling stage under sodium salts stress. Malaysian Journal of Soil Science. 13: 59-75.
- Munns R. 2002. Comparative physiology of salt and water stress. Plant Cell Environ. 25: 239-250.
- Munns R, Tester M. 2008. Mechanisms of salinity tolerance. Annu Rev Plant Biol. 59: 651-681.
- Nassery H. 1975. The effects of salt and osmotic stress 0n the retention of potassium by excised barley and bean roots. New Phytol. 75: 63-67.
- Nassery H. 1979. Salt induced loss of potassium from plant roots. New Phytol. 83: 23-27.
- Niño MC, Lee HJ, Kim JK, Abdula SE, Jung YJ, Kang KK, et al. 2015. Enhancement of rice resistance to bacterial blight by overexpressing BrCP3 gene of Brassica rapa. Plant Breed Biotech. 3: 355-365.
- Omielan JA, Epstein E, Dvořák J. 1991. Salt tolerance and ionic relations of wheat as affected by individual chromosomes of salt-tolerant Lophopyrum elongatum. Genome. 34: 961-974.
- Rajendran K, Tester M, Roy SJ. 2009. Quantifying the three main components of salinity tolerance in cereals. Plant Cell Environ. 32: 237-249.
- Rains DW, Epstein E. 1967. Sodium absorption by barley roots: role of the dual mechanisms of alkali cation transport. Plant Physiol. 42: 319-323.
- Raskin I. 1996. Plant genetic engineering may help with environmental cleanup. Proc Natl Acad Sci USA. 93: 3164-3166.
- Reddy INBL, Kim BK, Yoon IS, Kim KH, Kwon TR. 2017. Salt tolerance in rice: focus on mechanisms and approaches. Rice Science. 24: 123-144.
- Schachtman DP, Kumar R, Schroeder JI, March EL. 1997. Molecular and functional characterization of a novel low-affinity cation transporter (LCT1) in higher plants. Proc Natl Acad Sci USA. 94: 11079-11084.
- Shabala S, Cuin TA. 2008. Potassium transport and plant salt tolerance. Physiol Plant. 133: 651-669.
- Shabala S, Demidchik V, Shabala L, Cuin TA, Smith SJ, Miller AJ, et al. 2006. Extracellular Ca2+ ameliorates NaCl-induced K+ loss from Arabidopsis root and leaf cells by controlling plasma membrane K+-permeable channels. Plant Physiol. 141: 1653-1665.
- Schroeder JI, Ward JM, Gassmann W. 1994. Perspectives on the physiology and structure of inward-rectifying K+ channels in higher plants: biophysical implications for K+ uptake. Annu Rev Biophys Biomol Struct. 23: 441-471.
- Sirault XRR, James RA, Furbank RT. 2009. A new screening method for osmotic component of salinity tolerance in cereals using infrared thermography. Funct Plant Biol. 36: 970-977.
- Takahashi R, Ishimaru Y, Senoura T, Shimo H, Ishikawa S, Arao T, et al. 2011. The OsNRAMP1 iron transporter is involved in Cd accumulation in rice. J Exp Bot. 62: 4843-4850.
- Thompson JD, Gibson TJ, Plewniak F, Jeanmougin F, Higgins DG. 1997. The CLUSTAL_X windows interface: flexible strategies for multiple sequence alignment aided by quality analysis tools. Nucleic Acids Res. 25: 4876-4882.
- Ueno D, Yamaji N, Kono I, Huang CF, Ando T, Yano M, et al. 2010. Gene limiting cadmium accumulation in rice. Proc Natl Acad Sci USA. 107: 16500-16505.
- Uraguchi S, Kamiya T, Clemens S, Fujiwara T. 2014. Characterization of OsLCT1, a cadmium transporter from indica rice (Oryza sativa). Physiol Plant. 151: 339-347.
- Urugachi S, Mori S, Kuramata M, Kawasaki A, Arao T, Ishikawa S. 2009. Root-to-shoot Cd translocation via the xylem is the major process determining shoot and grain cadmium accumulation in rice. J Exp Bot. 60: 2677-2688.
- Urugachi S, Kamiya T, Sakamoto T, Kasai K, Sato Y, Nagamura Y, et al. 2011. Low-affinity cation transporter (OsLCT1) regulates cadmium transport into rice grains. Proc Natl Acad Sci USA. 108: 20959-20964.
- Van Bruwaene R, Kirchmann R, Impens R. 1984. Cadmium contamination in agriculture and zootechnology. Experientia. 40: 43-52.
- Vadim D, Straltsova D, Medvedev SS, Pozhvanov GA, Sokolik A, Yurin V. 2013. Stress-induced electrolyte leakage: the role of K+-permeable channels and involvement in programmed cell death and metabolic adjustment. J Exp Bot. 65: 1259-1270.
- Velarde-Buendía AM, Shabala S, Cvikrova M, Dobrovinskaya O, Pottosin I. 2012. Salt-sensitive and salt-tolerant barley varieties differ in the extent of potentiation of the ROS-induced K+ efflux by polyamines. Plant Physiol Biochem. 61: 18-23.
- Verslues PE, Agarwal M, Katiyar-Agarwal S, Zhu JH, Zhu JK. 2006. Methods and concepts in quantifying resistance to drought, salt and freezing, abiotic stresses that affect plant water status. Plant J. 45: 523-539.
- Wagner GJ. 1994. Accumulation of cadmium in crop plants and its consequences to human health. Advances in Agronomy. 51: 173-212.
- Walia H, Wilson C, Condamine P, Liu X, Ismail AM, Close TJ. 2007. Large-scale expression profiling and physiological characterization of jasmonic acid-mediated adaptation of barley to salinity stress. Plant Cell Environ. 30: 410-421.
- Williams LE, Pittman JK, Hall JL. 2000. Emerging mechanisms for heavy metal transport in plants. Biochim Biophys Acta. 1465: 104-126.
- Zhao Y, Dong W, Zhang N, Ai X, Wang M, Huang Z, et al. 2014. A wheat allene oxide cyclase gene enhances salinity tolerance via jasmonate signaling. Plant Physiol. 164: 1068-1076.
- Zuckerkandl E, Pauling L. 1965. Evolutionary divergence and convergence in proteins. pp. 97-166. Bryson V, Vogel HJ, editors. Evolving Genes and Proteins. Academic Press. New York: