Abstract
We evaluated genetic diversity and population structure in 32 Canadian maize inbred lines and performed association analysis for five agronomical traits and 50 simple sequence repeat (SSR) markers. Genetic diversity analysis revealed a total of 381 alleles at the 50 SSR loci. The average number of alleles per locus was 7.6. The average genetic diversity and polymorphic information content values were 0.709 and 0.676, respectively. The average major allele frequency was 0.414. Population structure analysis indicated that these maize inbred lines were comprised of four major groups and one admixed group based on a membership probability threshold of 0.80. A general linear model showed 20 marker-trait associations involving 12 SSR markers associated with the four agronomic traits except for leaf length. For these marker-trait associations, phi056, mmc0022, bnlg1621, bnlg1695, phi116, and bnlg1028 were associated with only one trait. The other nc005, bnlg1012, phi065, and umc1982 were associated with two traits. Two SSR markers, mmc0111 and umc1038, were associated with three traits. These results will help in optimizing the choice of parents for crossing combinations, as well as in selecting markers for marker-assisted selection for maize improvement.
-
Key words: Maize inbred line, Genetic diversity, Association analysis, Population structure, Marker-trait association
INTRODUCTION
Maize (
Zea mays L.) is one of the most important agricultural crops serving food for humans and livestock feed, biofuel in the world. In Korea, waxy or sweet maize is mainly used for edible fresh maize, while normal maize is used for food as seed or powder and livestock feed. Today, maize consumption in Korea is increasing as the population transitions from a traditional diet based on rice to a Western diet based on meat. However, most of the maize consumed in Korea depends on imports except for waxy maize. To reduce maize imports, it is necessary to develop new varieties that are suitable for the environment in Korea and have excellent yield and quality. Korean maize breeding program is mainly carried out using inbred lines derived from domestic landrace (
Park et al. 2012). Due to the limitations of breeding materials, genetic background is narrow, and development of elite varieties is limited (
Park et al. 2012). Therefore, to improve the diversity of maize genetic resources, it is urgent to collect and introduce maize resources from abroad.
Classification of collected inbred lines from others allows the maize breeders to choose the most suitable and best hybrid combination and may reduce field testing cost and time (
Reid et al. 2011). Crosses among inbred lines derived from different genetic background are known to have better-combining ability (
Barata and Carena 2006). Therefore, information for the genetic variation among maize inbred lines have a significant impact on the improvement of new varieties because it is useful in planning crosses for the hybrid and development of inbred line, assigning lines to heterotic groups, and protecting the plant variety (
Hallauer et al. 1988;
Pejic et al. 1998). In traditional breeding, genetic diversity and relationships among inbred lines are usually evaluated based on the morphological and pedigree data, and heterosis. However, there are some limitations that the morphological characteristics often were influenced by environment interactions. Additionally, the pedigree record requires accurate records and is consumed many resources and time for the testing of pedigree. Therefore, to increase the efficiency of hybrid combinations, the assignment of inbred lines and assessment of genetic diversity and population structure among breeding materials is required for maize breeding programs.
Collected inbred lines can be classified by pedigree, quantitative genetic analysis, heterosis and molecular data (
Mumm and Dudley 1994;
Fan et al. 2003). Out of these, the use of molecular marker-based techniques in genetic studies like the estimation of genetic diversity and population structure has advanced remarkably in recent years. Among diverse molecular markers, such as RFLPs, RAPDs, AFLPs, SNPs, and simple sequence repeats (SSRs), also called microsatellites, are considered to be one of the most useful markers for estimating genetic variation because of their reliability, reproducibility, and discrimination among maize inbred lines (
Akagi et al. 1997;
Enoki et al. 2002). In plant breeding programs, identifying the genetic basis of agronomic traits is a fundamental scientific problem for crop improvement (
Pasam et al. 2012). Recently, association mapping analysis using linkage disequilibrium (LD) is identified to analyze agronomic traits and molecular markers has advantages that reduce the experimental time and costs (
Flint-Garcia et al. 2005;
Yu and Buckler 2006). Therefore, association analysis is widely used to analyze a variety of crops such as rice (
Borba et al. 2010), maize (
Xue et al. 2013), and soybeans (
Hu et al. 2014).
In this study, 32 maize inbred lines were introduced from Canada to obtain a diversity of breeding materials for the development of new elite maize hybrids. Therefore, our objective was to evaluate the genetic diversity of 32 Canadian maize inbred lines from Eastern Cereal and Oilseed Research Center using SSR markers and to investigate their population structure and clustering patterns. This study also tried to confirm the association between 5 agronomic traits and 50 SSR markers. These results will help to further Korean maize breeding programs.
MATERIALS AND METHODS
Plant materials and phenotypic evaluation
The entry number and pedigree of 32 Canadian maize inbred lines are listed in
Table 1. All maize accessions were obtained from Eastern Cereal and Oilseed Research Center of Canada. To assess the morphological variation of the Canadian maize inbred lines, ten individuals of each accession were evaluated using completely randomized design with two replicates and 70 × 25 cm of planting density for 5 agronomic traits at the College of Agriculture and Life Sciences, Kangwon National University, Chuncheon, Gangwon-do in 2017. This study assessed 5 agronomic traits, including stem thickness (ST), plant height (PH), ear height (EH), leaf width (LW), and leaf length (LL) (
Table 2). Basic statistics and correlation analysis were performed using Microsoft Office Excel 2010.
The genomic DNA was extracted from maize young leaves with the protocol of
Dellaporta et al. (1983), with minor modifications. Fifty SSR primers (5 loci per chromosome) were used to evaluate genetic variations and association analysis in 32 Canadian maize inbred lines from Eastern Cereal and Oilseed Research Center in Canada. The SSR primers used in this study were obtained from MaizeGDB (
http://www.maizegdb.org/).
SSR amplifications were conducted in a total volume of 30 μL and consisted of 20 ng genomic DNA, 1× PCR buffer, 0.3 μM forward and reverse primers, 0.2 mM dNTPs, and 1 U Taq DNA polymerase (Biotools, Valie de Tobalina, Madrid, Spain). The PCR cycling conditions were as follows, pre-denaturation at 94°C for 5 minutes, followed by two 1-minute denaturation cycles at 94°C, a 1-minute annealing cycle at 65°C, and one 2-minute extension at 72°C. After the two cycle, the annealing temperature was decreased in 1°C increments every two cycles until a final temperature of 55°C was reached. The last cycle was then repeated 20 times. The final cycle included 10-minute extension at 72°C to ensure full extension.
Electrophoresis and fragment detection
The final reaction product (5 μL) was mixed with 10 μL electrophoresis loading buffer (98% formamide, 0.02% Bromophenol blue, 0.02% Xylene cyanol, and 5 mM NaOH). After denaturation and immediate cooling, 2 μL sample was loaded on a 6% denaturing (7.5 M urea) acrylamide-bisacrylamide gel (19:1) in 1× TBE buffer, and electrophoresed at 1800 V and 60 W for 120 minutes. The separated fragments were visualized using a silver-staining kit (Promega, USA).
Data analysis
PowerMarker 3.25 program (
Liu and Muse 2005) was used to calculate the number of alleles, allele frequency, major allele frequency (MAF), gene diversity (GD), and polymorphic information content (PIC). The genetic similarities (GS) were calculated for each pair of accessions using the Dice similarity index (
Dice 1945). The similarity matrix was used to construct an Unweighted Pair Group Method with Arithmetic Mean Algorithm (UPGMA) dendrogram with the help of SAHN-clustering from NTSYSpc version 2.1 (
Rohlf 1998).
We used model-based program STRUCTURE 2.2 (
Pritchard and Wen 2003) to analyze population structure (Q matrix), where the membership coefficient for each individual in each subpopulation was run five times for each cluster (
K), ranging from 1 to 10, using the admixture model with a burn-in of 100,000 and a replication of 100,000. Because the estimated log probability of data [LnP(D)] overestimated the number of subgroups, the ad hoc criterion (Δ
K) described by
Evanno et al. (2005) was used to determine the most probable value of K. The run of the estimated numbers of subgroups showing the maximum likelihood was used to assign maize inbred lines with membership probabilities ≥ 0.80 to subgroups. The maize inbred lines with membership probabilities < 0.80 were assigned to an admixed group (
Wang et al. 2008). TASSEL 3.0 (
Bradbury et al. 2007) was used to evaluate marker-trait associations using a Q general linear model (GLM). The Q GLM method was performed using a Q-matrix derived from the STRUCTURE program. The number of permutation runs was set to 10,000 to obtain a marker significance value of
P ≤ 0.05.
RESULTS
Phenotypic analysis and correlation analysis
Phenotypic variations for five agronomic traits in 32 Canadian maize inbred lines are shown in
Table 2. The average of ST value was 1.8 ± 0.2, ranging from 1.2 to 2.4. The PH value ranged from 93.4 to 214.6, with an average of 158.3 ± 28.3. The average EH value was 51.6 ± 16.4, ranging from 4.8 to 83.8. The LW value ranged from 2.8 to 10.2, with an average of 7.9 ± 1.2. The average LL value was 57.4 ± 7.6, ranging from 36.6 to 76.8. We also confirmed correlation coefficients among five agronomic traits in 32 maize inbred lines. All combinations, except of PH and LW, showed significant correlation with the significance level at 0.05. Among them, PH and EH (0.700**), EH and LL (0.676**), and PH and LL (0.621**) showed relatively higher correlation coefficients than the other combinations (
Table 2).
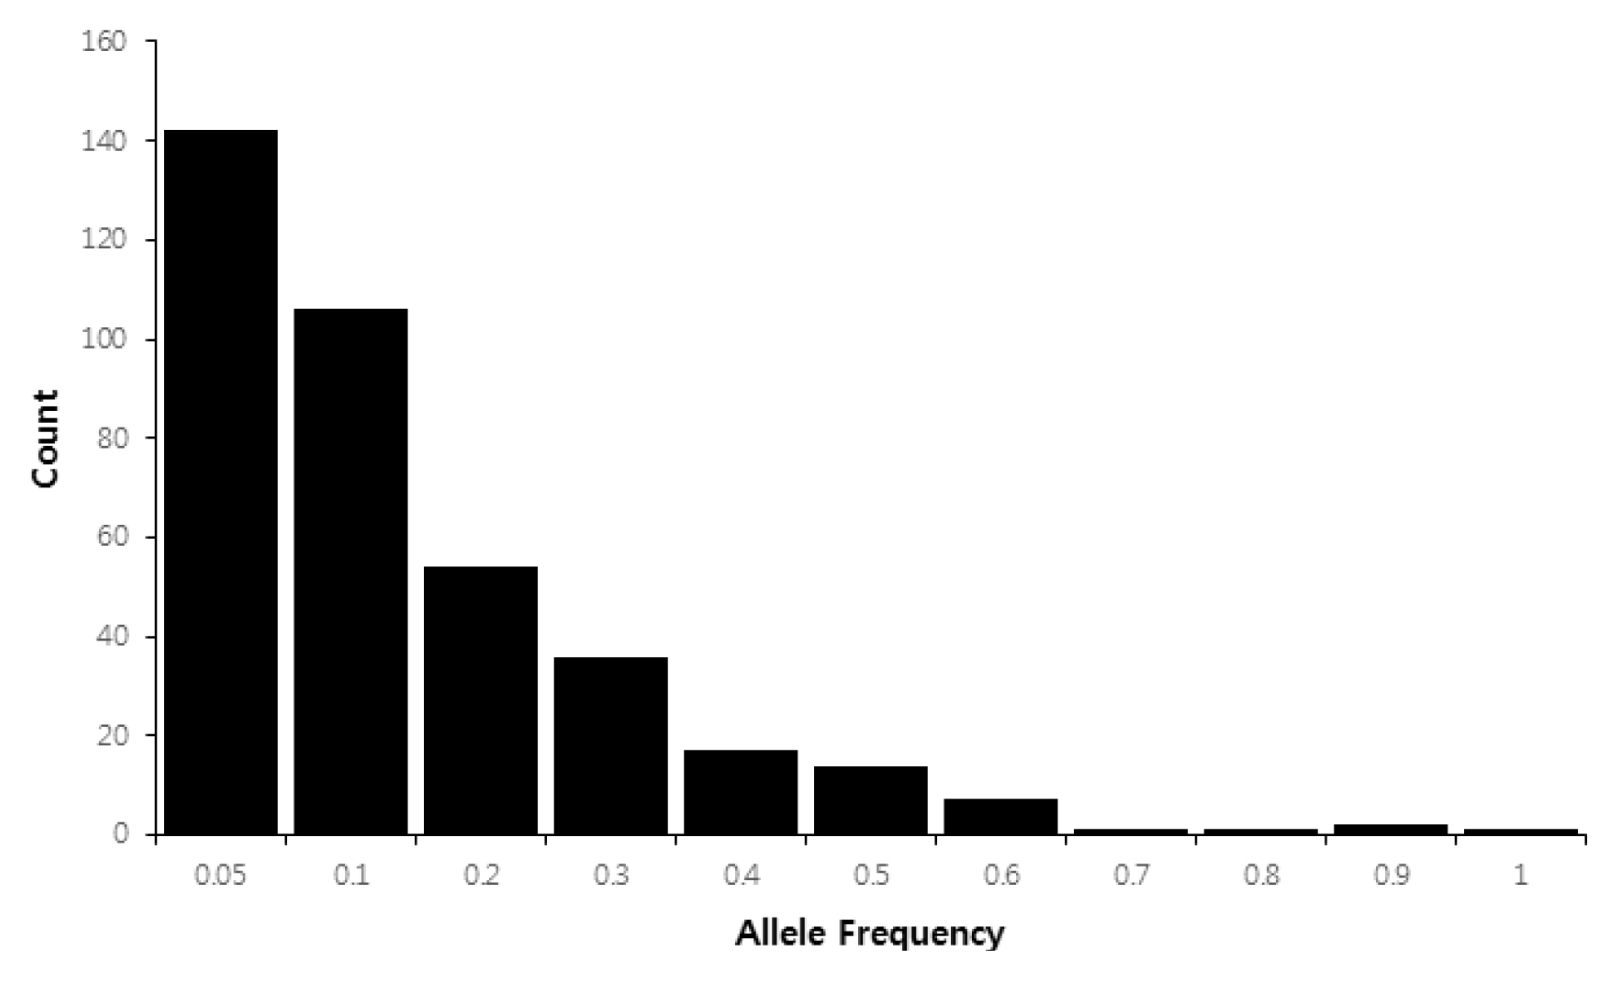
This study used a total of 50 SSR loci to evaluate the genetic diversity among 32 Canadian maize inbred lines (
Fig. 1,
Table 3). A total of 381 alleles were detected in 32 maize inbred lines. The number of alleles per locus ranged from 3.0 to 15, and the average number of alleles per locus was 7.6 (
Table 3). The average MAF was 0.414 with a range of 0.156 to 0.906. Also, the average GD value was 0.709 with a range of 0.176 to 0.910. The average PIC was 0.676 with a range of 0.171 to 0.903 (
Table 3). Of the 381 alleles, 142 private alleles (37.3%) were detected in 32 maize accessions. The frequency of rare alleles (frequency < 0.1) was 65.1% (248 of 381 alleles), whereas intermediate (frequency 0.1–0.5) and abundant alleles (frequency > 0.5) comprised 31.8% (121 alleles) and 3.1% (12 alleles) of 381 alleles, respectively (
Fig. 1).
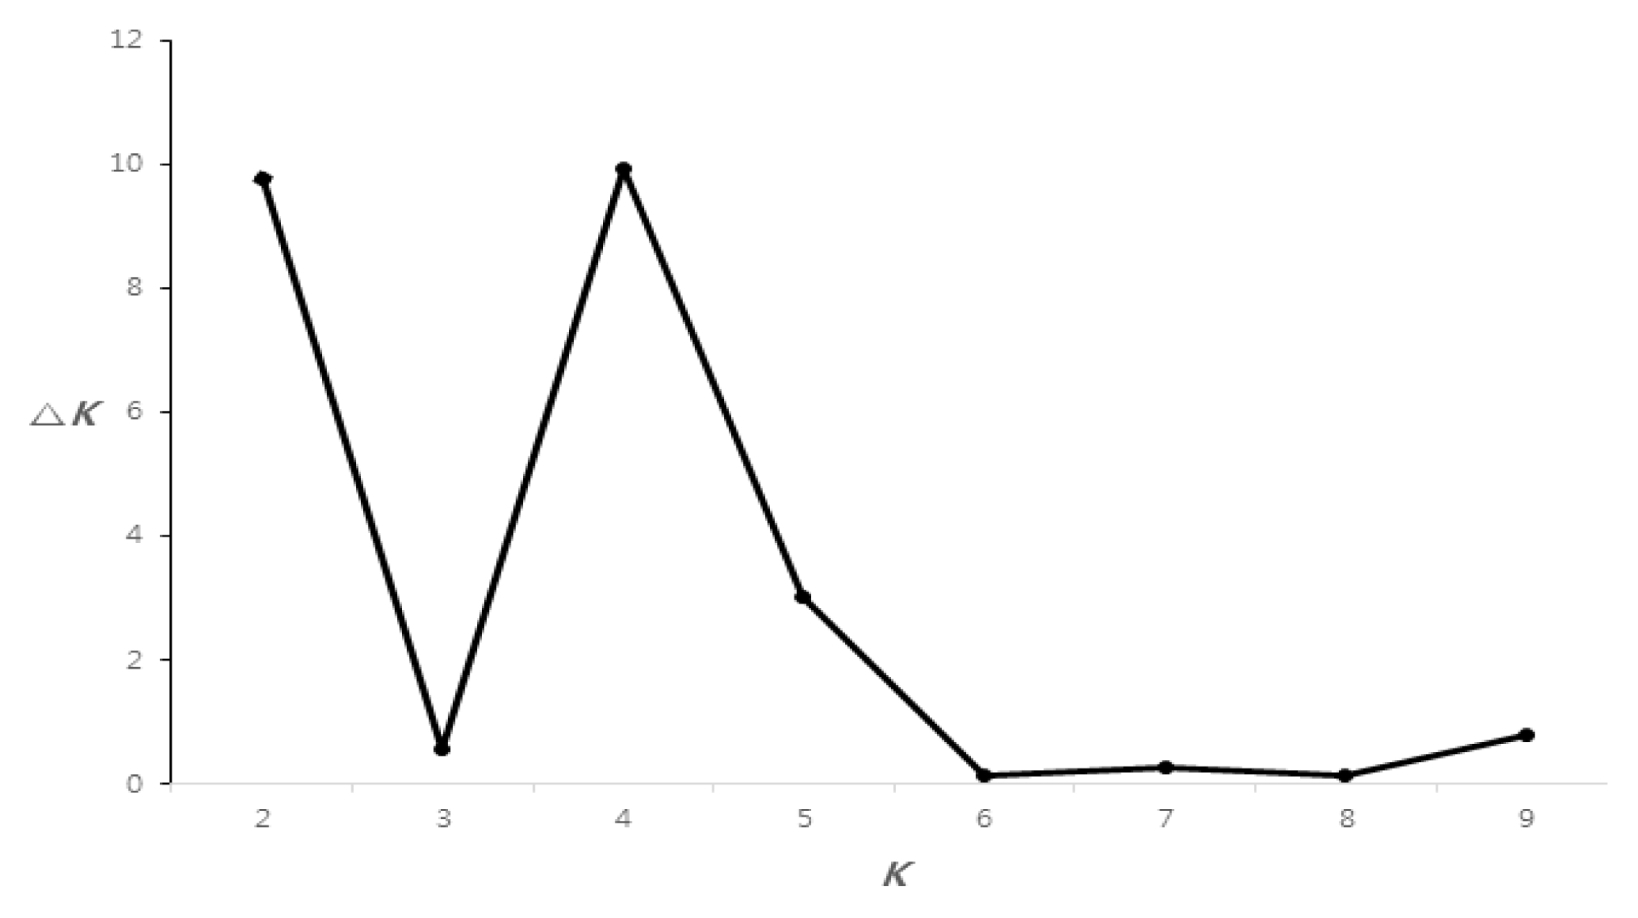
For whole maize inbred lines, the highest Δ
K value was confirmed for
K = 4 (
Fig. 2). Based on a membership threshold of 0.8 (
Wang et al. 2008), the maize inbred lines were divided into group I, group II, group III, group IV, and the admixed group. Twelve maize inbred lines (CO417, CO419, CO420, CO421, CO423, CO428, CO438, CO439, CO442, CO444, CO445, and CO450) were assigned to group I. Group II contained two maize inbred lines (CO446, CO451). Group III also contained two maize inbred lines (CO436 and CO437). The six maize inbred lines were assigned to group IV (CO430, CO431, CO432, CO433, CO441, and CO449). The admixed group contained ten maize inbred lines (CO416, CO418, CO425, CO429, CO434, CO435, CO440, CO443, CO447, and CO448) composed of line with membership lower than 0.8 (
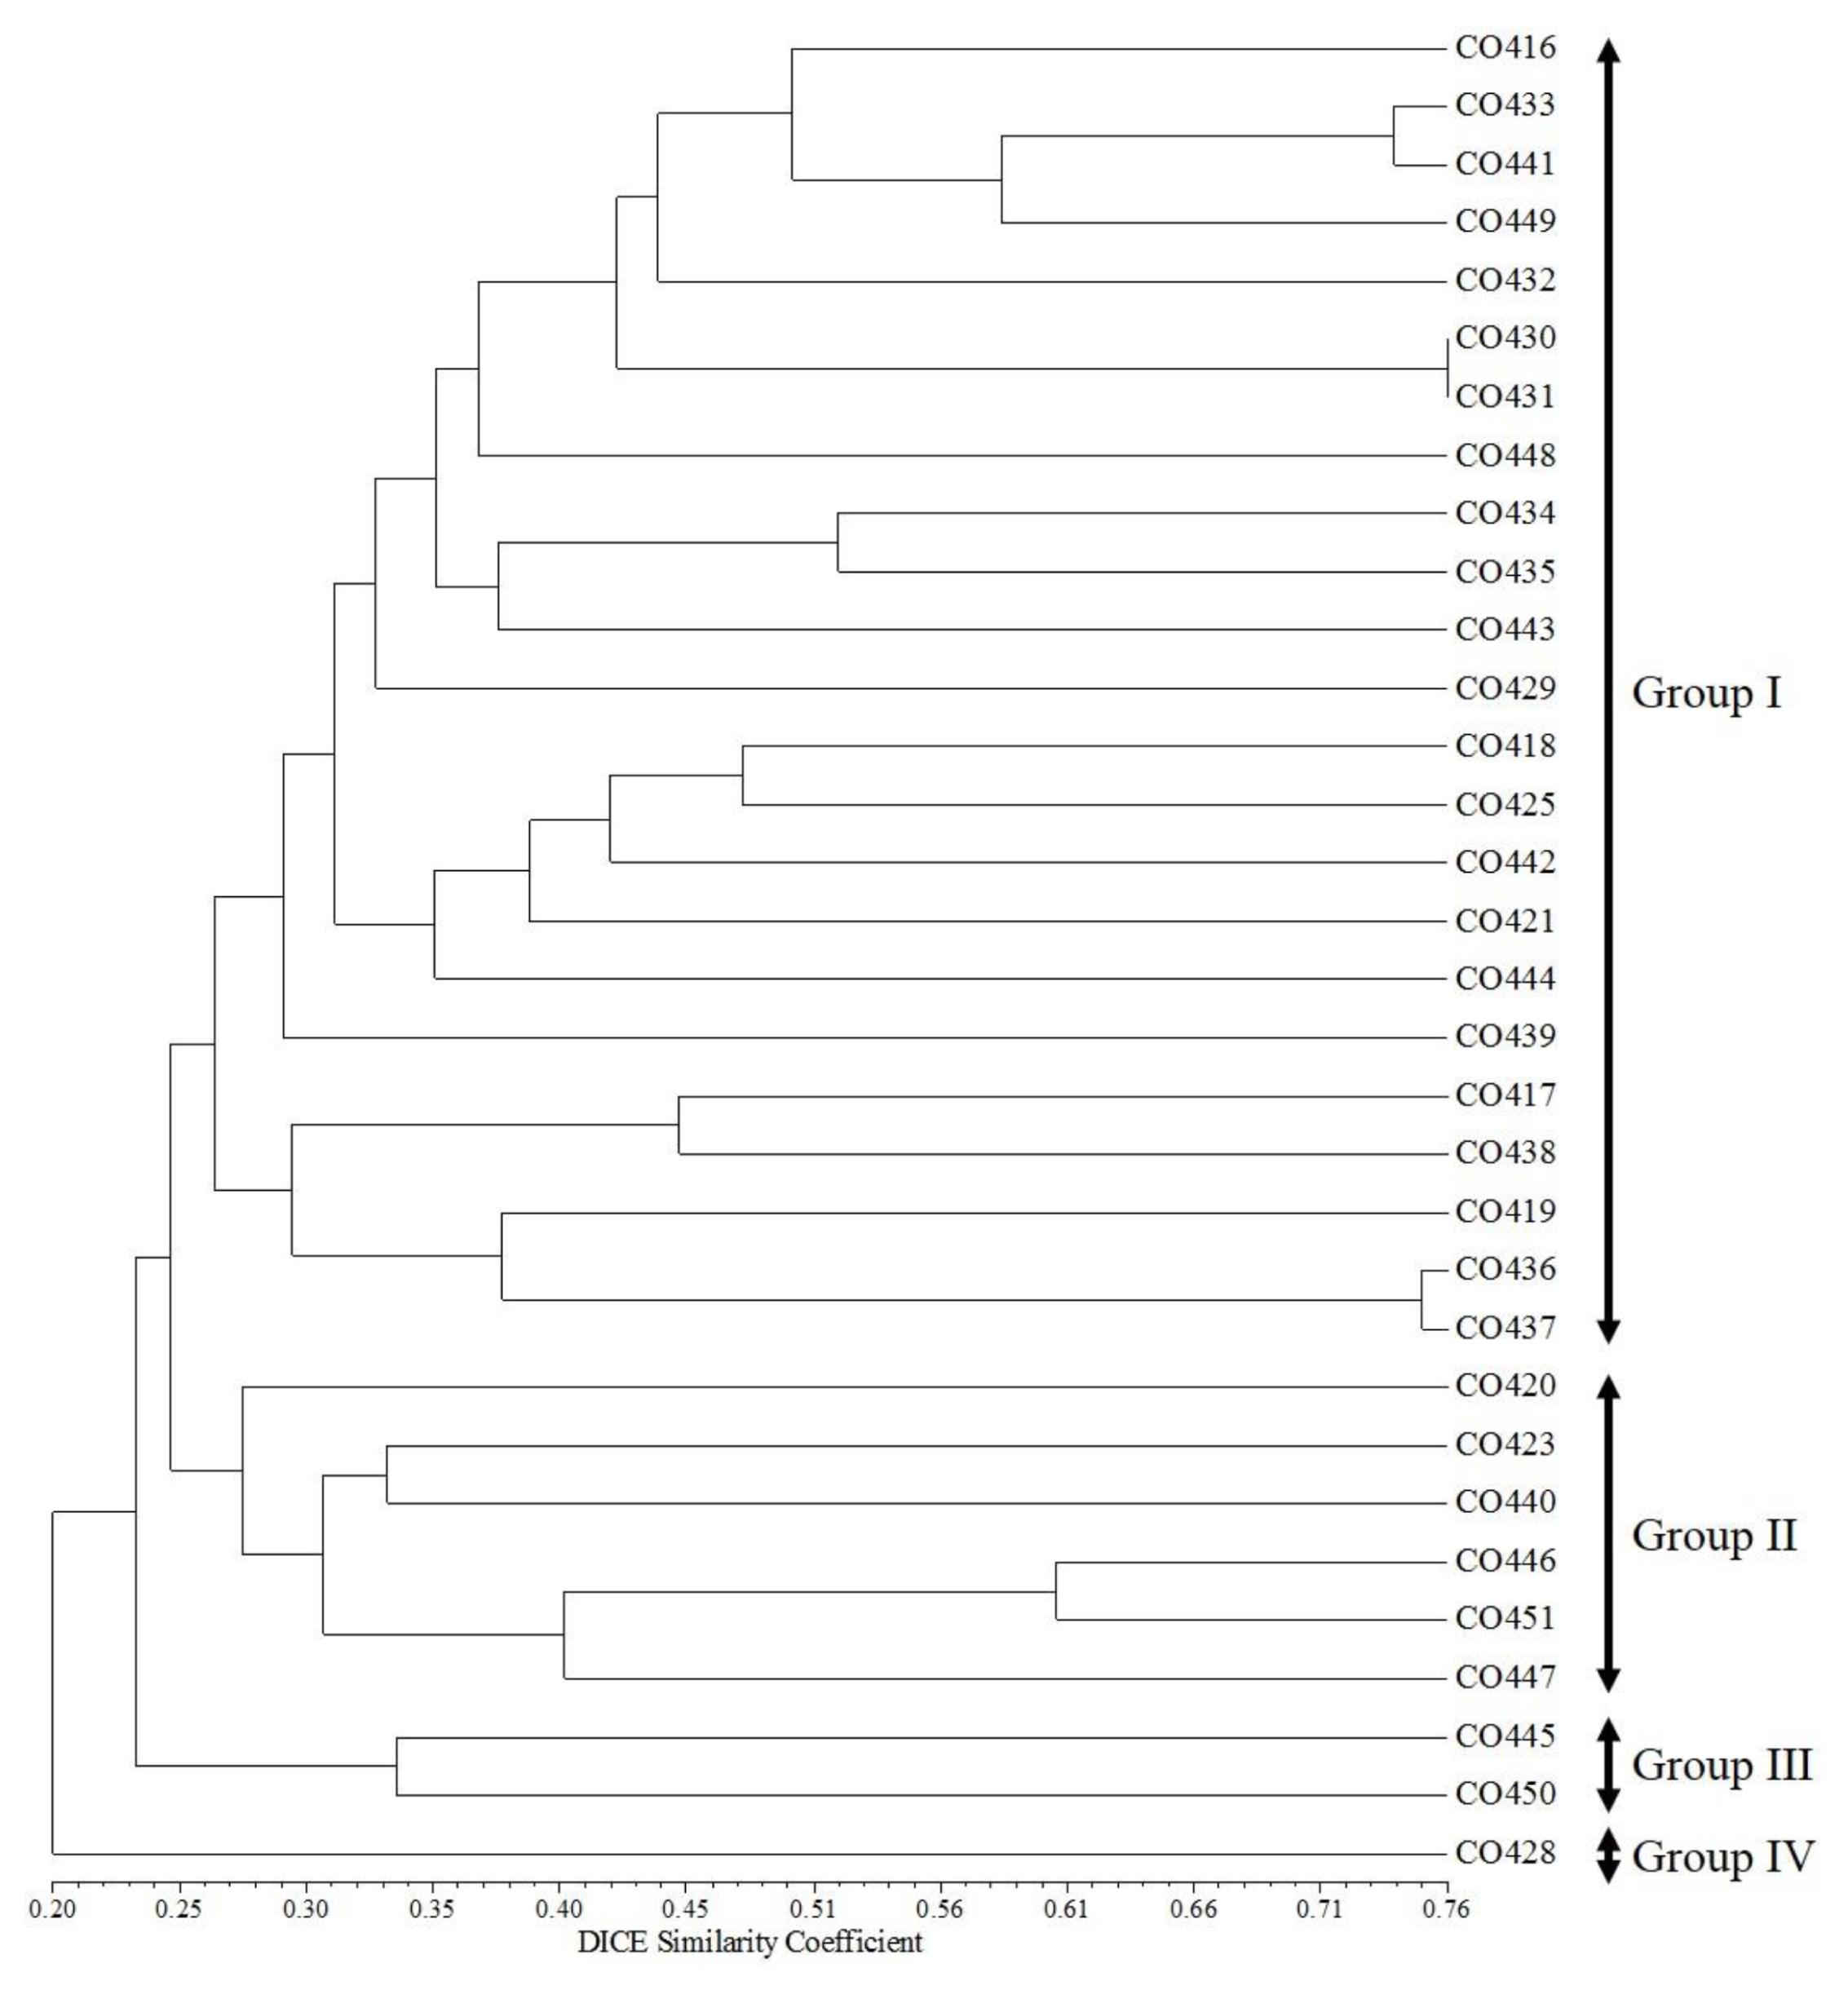
Fig. 3). A dendrogram of the 32 maize inbred lines using UPGMA is presented in
Fig. 4, which shows four clusters with a GS value of about 25%. Group I contained 23 inbred lines (CO416, CO433, CO441, CO449, CO432, CO430, CO431, CO448, CO434, CO435, CO443, CO429, CO418, CO425, CO442, CO421, CO444, CO439, CO417, CO438, CO419, CO436, and CO437). Group II contained six inbred lines (CO420, CO423, CO440, CO446, CO451, and CO447). Group III contained two inbred lines (CO445 and CO450), and Group IV contained only one inbred line (CO428) (
Fig. 4).
Association analysis between sets of 50 SSR markers and five phenotypic traits in 32 maize inbred lines were performed by Q GLM. Twenty marker-trait associations involving 12 SSR markers associated with the four agronomic traits except LL trait using Q GLM (
Table 4) were detected. Among 20 marker-trait associations, six SSR markers, phi056, mmc0022, bnlg1621, bnlg1695, phi116, and bnlg1028, were associated with only one trait. Meanwhile, four SSR markers, nc005, bnlg1012, phi065, and umc1982, were associated with two traits. Moreover, two SSR markers, mmc0111 and umc1038, were associated with three traits.
DISCUSSION
Evaluation of genetic variation is a prerequisite not only in understanding the genetic diversity and genetic relationship of a species, but also in the development of new cultivars in crops. Particularly, the information on morphological variation in breeding materials is important to develop new inbred lines in maize crop. In this study, five agronomic traits were evaluated in 32 Canadian maize inbred lines. Lodging resistance is an important phenotypic variation in maize breeding program. Phenotypic traits such as SD, PH, EH, and PH/EH ratio are important for determining lodging resistance (
Kashiwagi et al. 2008;
Cai et al. 2012). The PH is associated with biomass, lodging resistance, grain yield (
Teng et al. 2013), and lower EH is most significantly contribute to lodging resistance (
Cai et al. 2012). Also, the ratio of PH to EH under 50% is associated with high lodging resistance (Lee
et al. 2009). The PH/EH ratio for all inbred lines in our study was under 50% suggesting high lodging resistance.
Information on genetic diversity and genetic relationships for the developed breeding materials is important for breeding programs. In addition, analysis of population structure of breeding materials is essential for association analysis (
Flint-Garcia et al. 2005). To estimate genetic diversity and population structure in 32 Canadian maize inbred lines, 50 SSR loci (5 loci per chromosome) covering the whole maize genome were analyzed. This study detected a total of 381 alleles, with an average number of 7.6 alleles per locus in 32 Canadian maize inbred lines, and average GD along with PIC of 0.709 and 0.676, respectively (
Table 3). Genotyping 129 maize inbred lines with 105 SSR loci in previous study, including some of the same inbred lines used in this study, they observed genetic diversity with an average of 3.62 alleles per locus with an average PIC of 0.68 (
Reid et al. 2011). In another study,
Sa et al. (2011) confirmed genetic diversity with an average of 5.38 alleles per locus and an average PIC of 0.587 in 40 normal maize inbred lines using 50 SSR markers. In comparison, the average allele number and PIC value in our study was on higher side. Therefore, the Canadian maize inbred lines with high genetic variability were considered to have high value as breeding material in the future maize breeding program in Korea.
In our study, the population structure of 32 Canadian maize inbred lines was investigated two different methods using a model-based clustering method (STRUCTURE) and distance-based phylogenetic methods (NTSYs). The model-based clustering method revealed the maximum Δ
K value for
K = 4, based on the method described by
Evanno et al. (2005) (
Figs. 2 and
3). 32 Canadian maize inbred lines were divided into four groups I, II, III, and IV by the distance-based phylogenetic method (
Fig. 4). Although all maize inbred lines were divided into four subgroups by two different methods, the population structure patterns were not clearly distinguished based on their pedigree and heterotic groups. The information for population structure identified in this study should be useful in the selection of potentially successful crosses between these Canadian maize inbred lines.
Determining genes controlling agronomic traits is important for effective corn breeding programs. Association analysis is a powerful tool to detect marker-trait associations using linkage disequilibrium (
Mezmouk et al. 2011;
Sa et al. 2011). The Q GLM using population structure identified 20 marker-trait associations between 12 SSR markers and four traits in this study (
P < 0.05) (
Table 4). Some of the SSR primers in our study have been used in another previous QTL mapping studies. In a previous study, mmc0111 and phi065 were a flanking marker for QTL of plant height (
Teng et al. 2013). The mmc0022 was associated with EH in this study, was a flanking marker for QTL for leaf greenness, the area of the third leaf (
Jompuk et al. 2005). Moreover, nc005 is linked to QTL for lodging resistance (
Lima et al. 2006). Another SSR marker, bnlg1621, related to LW in this study, is linked to QTL for traits related to Fusarium ear rot resistance (
Abdel-Rahman et al. 2016) and QTL for traits related to gray leaf spot and flowering time (
Liu et al. 2016). The bnlg1695 was associated with the PH in this study, was a flanking marker for QTL for phosphorus efficiency and traits related to roots (
Chen et al. 2008). The umc1638 is linked to QTL for leaf length (
Ku et al. 2012). The locus bnlg1012, associated with EH and SD in our analysis, was also associated with ear row number in other study (
Sabadin et al. 2008). The bnlg1012, associated with EH and SD in our analysis, was also associated with ear row number in another study (
Sabadin et al. 2008). Finally, bnlg1028 is linked to QTL for carotenoid composition (
Kandianis et al. 2013). Thus, some SSR markers were found related to different traits, suggesting potential pleiotropy or tight linkage of genes. In conclusion, this study successfully confirmed the genetic diversity and population structure of 32 Canadian maize inbred lines. Four-cluster population structures by two different methods were found. Also, marker-trait associations were confirmed, which can assist in marker-assisted selection (MAS) for breeding programs. These results will help breeders choose parents for crossing combinations in maize breeding programs in Korea.
ACKNOWLEDGEMENTS
This study was supported by the Golden Seed Project (No. 213009-05-1-WT821, PJ012650012017), Ministry of Agriculture, Food, and Rural Affairs (MAFRA), Ministry of Oceans and Fisheries (MOF), Rural Development Administration (RDA), and Korea Forest Service (KFS), and 2017 Research Grant from Kangwon National University (No. D1001220-01-01).
Fig. 1Histograms of allele frequencies for the 381 alleles in 32 Canadian maize inbred lines.

Fig. 2Rate of change in the log probability of data between true
K values (Δ
K) described by
Evanno et al. (2005).

Fig. 3Assignment of 32 Canadian maize inbred lines to K = 4 by STRUCTURE program.
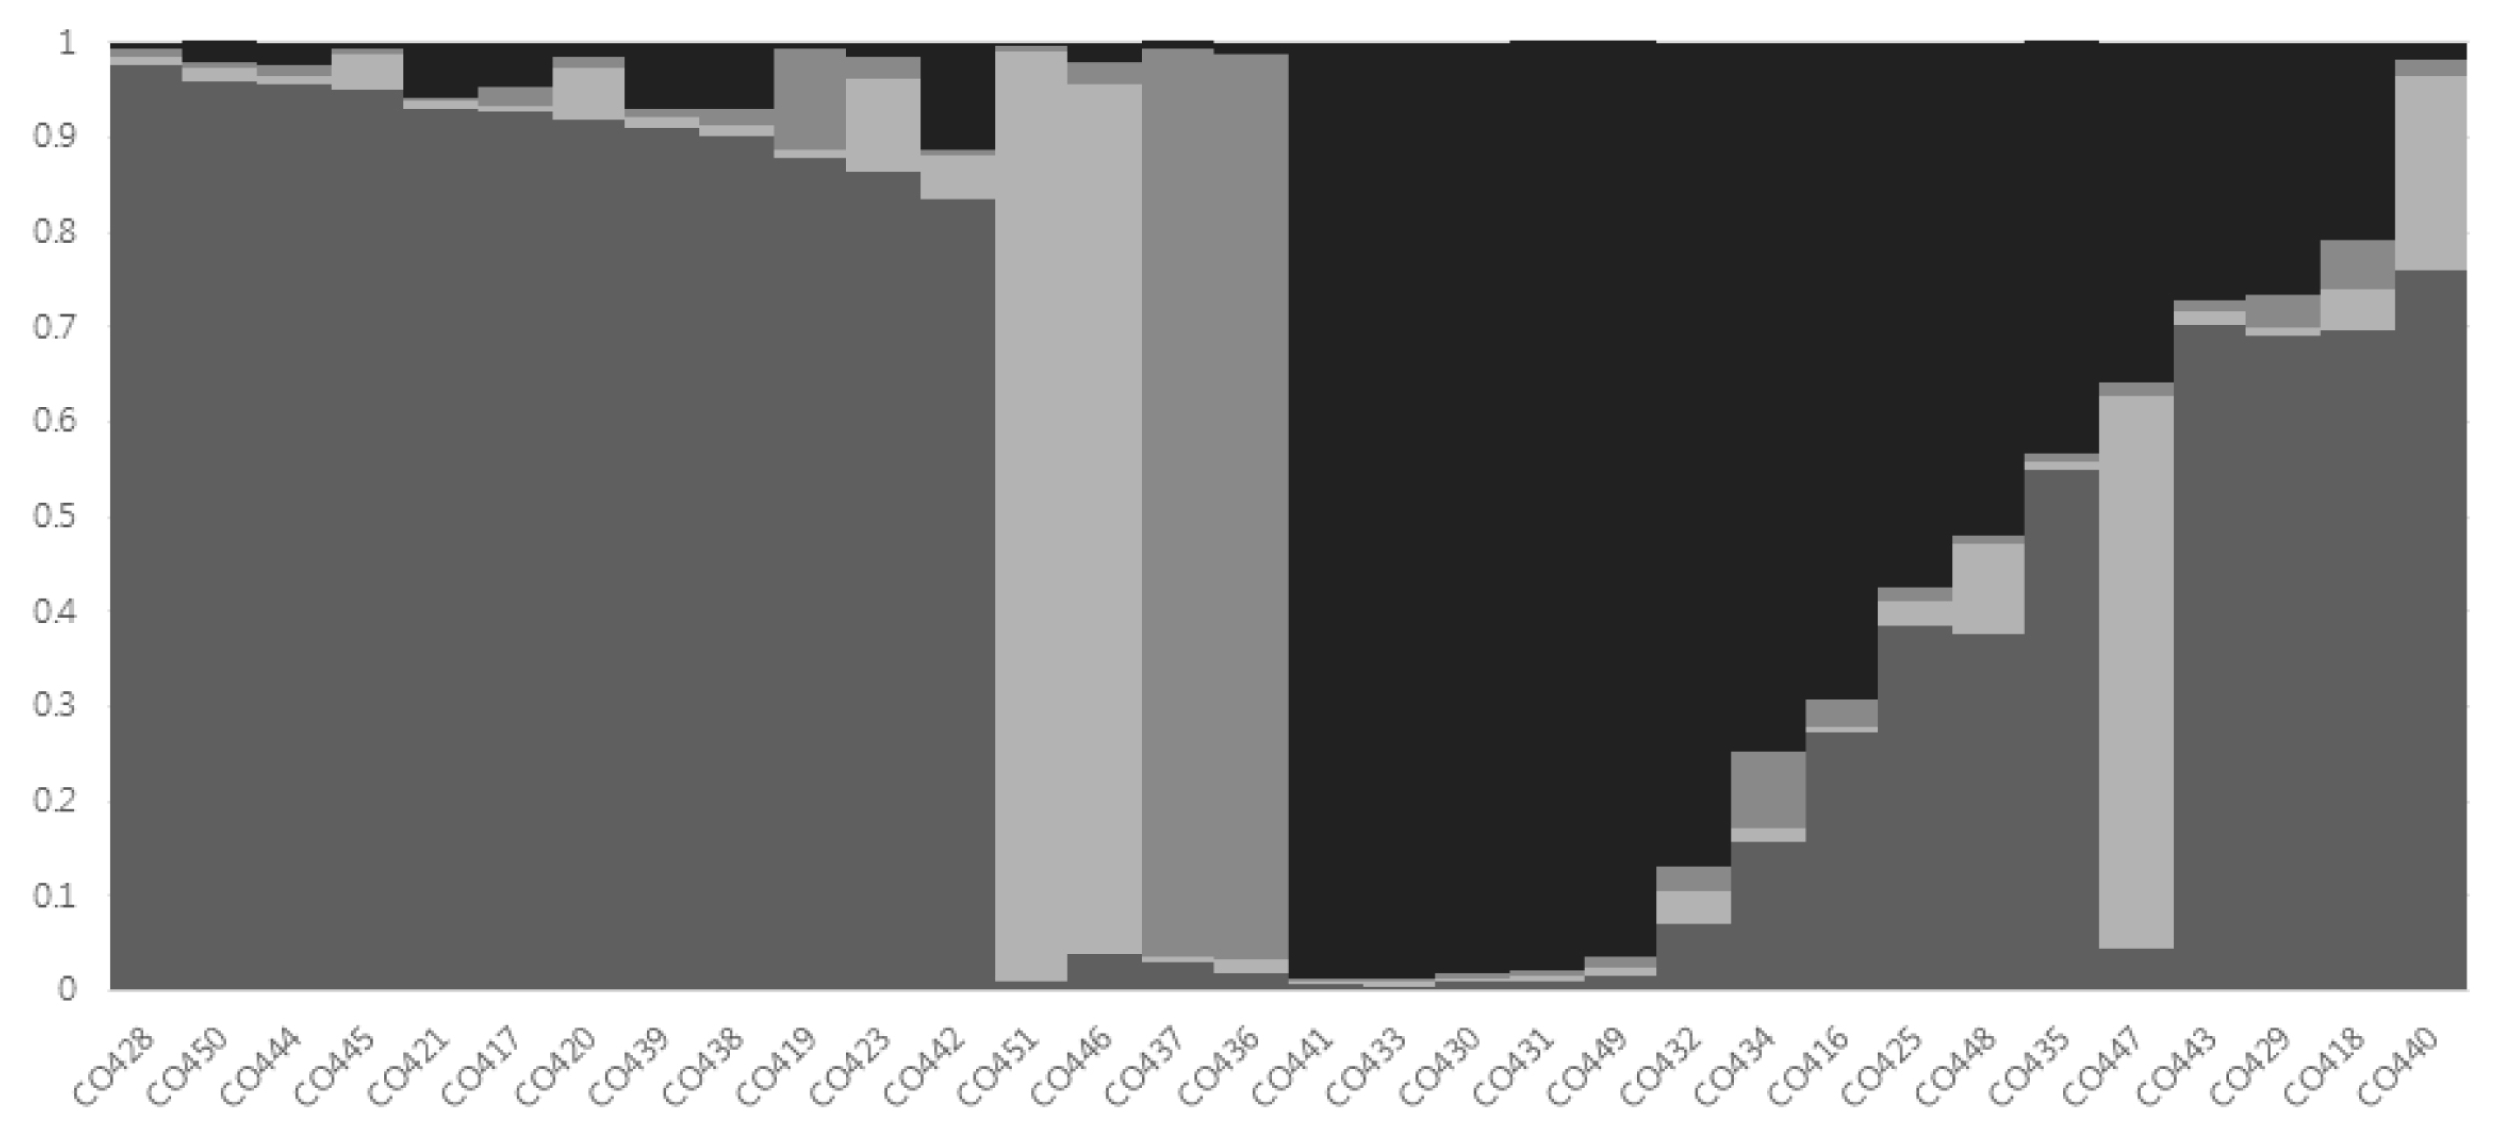
Fig. 4UPGMA dendrogram base on the 50 SSR markers in 32 Canadian maize inbred lines.

Table 1Derivation of 32 Canada maize inbred lines used in this study.
Table 1
|
Code No. |
Entry No. |
Pedigree |
Heterotic group |
|
1 |
CO416 |
(A632 × CO125) CO125 (2) |
E.Flint |
|
2 |
CO417 |
CB3 × CM383 |
P3994 |
|
3 |
CO418 |
Ottawa Cold Tolerant Syn CO |
E.Flint |
|
4 |
CO419 |
24-44-1 |
Minn13 |
|
5 |
CO420 |
CM423(DOR × A) |
Iodent |
|
6 |
CO421 |
DEA |
Iodent |
|
7 |
CO423 |
Unknow Commercial Hybrid |
E.Butler |
|
8 |
CO425 |
(B87 × CB8) CB8 |
P3994 |
|
9 |
CO428 |
OH43 × H99 |
Lanc |
|
10 |
CO429 |
Pioneer 3707 |
Lanc |
|
11 |
CO430 |
Fusarium Resistant Synthetic |
P3990 |
|
12 |
CO431 |
Fusarium Resistant Synthetic |
Iodent |
|
13 |
CO432 |
Fusarium Resistant Synthetic |
Minn13 |
|
14 |
CO433 |
Pride K127 |
Minn13 |
|
15 |
CO434 |
CM105 × A632 |
BSSS |
|
16 |
CO435 |
A632 × A634 |
BSSS |
|
17 |
CO436 |
CO275 × CO300 |
P3994 |
|
18 |
CO437 |
European Synthetic |
E.Flint |
|
19 |
CO438 |
CB3 × CL29 |
P3994 |
|
20 |
CO439 |
Nebraska BSSS |
BSSS |
|
21 |
CO440 |
Pride 5 × CO258 |
Minn13 |
|
22 |
CO441 |
Jacques 7700 × CO298 |
Lanc |
|
23 |
CO442 |
Iodent/NSS |
Iodent |
|
24 |
CO443 |
B104 × CO272 |
E.Flint |
|
25 |
CO444 |
S1381 × CO328 |
BSSS |
|
26 |
CO445 |
CO386 × W64AHT |
Lanc |
|
27 |
CO446 |
CO341 × CO328 |
BSSS |
|
28 |
CO447 |
CO352 × CO328 |
BSSS/Minn |
|
29 |
CO448 |
CO237 × CO431 |
P3990/Iodent |
|
30 |
CO449 |
CO432 × CO433 |
Minn13 |
|
31 |
CO450 |
Eyespot Resistant Synthetic (99ESR) |
BSSS/Mix |
|
32 |
CO451 |
CO309 × CO328 |
BSSS/Minn |
Table 2Correlation coefficient, mean and standard deviation for 5 agronomic traits in total 32 Canadian maize inbred lines.
Table 2
|
ST |
PH |
EH |
LW |
LL |
|
ST (Stem thickness) |
|
0.396*
|
0.523**
|
0.484**
|
0.456**
|
|
PH (Plant height) |
|
|
0.700**
|
0.292 |
0.621**
|
|
EH (Ear height) |
|
|
|
0.383*
|
0.676**
|
|
LW (Leaf width) |
|
|
|
|
0.425*
|
|
LL (Leaf length) |
|
|
|
|
|
|
Mean (cm) |
1.8 |
158.3 |
51.6 |
7.9 |
57.4 |
|
SD |
0.2 |
28.3 |
16.4 |
1.2 |
7.6 |
|
Min |
1.2 |
93.4 |
4.8 |
2.8 |
36.6 |
|
Max |
2.4 |
214.6 |
83.8 |
10.2 |
76.8 |
Table 3Total number of alleles and genetic diversity index for 50 SSR loci in 32 Canadian maize inbred lines.
Table 3
|
SSR loci |
Chr. |
Allele size range (bp) |
No. of allele |
MAFz)
|
GDy)
|
PICx)
|
|
bnlg1564 |
1 |
95–120 |
8 |
0.375 |
0.785 |
0.76 |
|
dupssr12 |
1 |
115–138 |
7 |
0.438 |
0.707 |
0.664 |
|
phi056 |
1 |
250–270 |
6 |
0.375 |
0.715 |
0.663 |
|
phi094 |
1 |
160–200 |
6 |
0.688 |
0.502 |
0.478 |
|
umc2012 |
1 |
70–120 |
8 |
0.406 |
0.705 |
0.659 |
|
phi10964 |
2 |
135–145 |
3 |
0.594 |
0.561 |
0.496 |
|
umc1551 |
2 |
150–165 |
8 |
0.406 |
0.76 |
0.731 |
|
umc1042 |
2 |
85–120 |
9 |
0.25 |
0.826 |
0.805 |
|
dupssr21 |
2 |
95–130 |
7 |
0.281 |
0.791 |
0.761 |
|
mmc0111 |
2 |
145–220 |
8 |
0.438 |
0.736 |
0.706 |
|
bnlg1182 |
3 |
70–190 |
11 |
0.344 |
0.783 |
0.757 |
|
mmc0022 |
3 |
125–160 |
8 |
0.344 |
0.781 |
0.752 |
|
mmc0251 |
3 |
120–190 |
15 |
0.219 |
0.889 |
0.879 |
|
umc1639 |
3 |
90–105 |
3 |
0.813 |
0.32 |
0.294 |
|
umc1394 |
3 |
95–185 |
4 |
0.906 |
0.176 |
0.171 |
|
umc1086 |
4 |
85–105 |
8 |
0.406 |
0.748 |
0.716 |
|
umc1720 |
4 |
120–175 |
5 |
0.438 |
0.693 |
0.642 |
|
nc005 |
4 |
120–190 |
12 |
0.281 |
0.834 |
0.815 |
|
phi021 |
4 |
85–135 |
6 |
0.438 |
0.693 |
0.642 |
|
bnlg1621 |
4 |
165–215 |
15 |
0.219 |
0.885 |
0.875 |
|
bnlg1695 |
5 |
105–170 |
13 |
0.25 |
0.848 |
0.832 |
|
bnlg565 |
5 |
55–130 |
11 |
0.531 |
0.689 |
0.673 |
|
phi008 |
5 |
100–115 |
4 |
0.75 |
0.4 |
0.395 |
|
umc1225 |
5 |
90–135 |
10 |
0.219 |
0.861 |
0.846 |
|
phi024 |
5 |
160–175 |
5 |
0.531 |
0.594 |
0.522 |
|
bnlg249 |
6 |
105–155 |
11 |
0.375 |
0.789 |
0.766 |
|
phi123 |
6 |
145–155 |
4 |
0.344 |
0.701 |
0.642 |
|
umc1178 |
6 |
145–165 |
4 |
0.844 |
0.277 |
0.262 |
|
bnlg1371 |
6 |
80–135 |
6 |
0.313 |
0.783 |
0.751 |
|
nc013 |
6 |
100–125 |
7 |
0.281 |
0.814 |
0.789 |
|
bnlg657 |
7 |
75–115 |
8 |
0.5 |
0.707 |
0.684 |
|
phi116 |
7 |
160–180 |
3 |
0.469 |
0.639 |
0.567 |
|
umc1066 |
7 |
135–160 |
5 |
0.531 |
0.645 |
0.6 |
|
umc1359 |
7 |
220–315 |
9 |
0.5 |
0.703 |
0.678 |
|
umc1671 |
7 |
75–85 |
3 |
0.531 |
0.549 |
0.452 |
|
umc1863 |
8 |
120–205 |
12 |
0.219 |
0.871 |
0.858 |
|
umc1670 |
8 |
115–130 |
5 |
0.531 |
0.625 |
0.57 |
|
umc2594 |
8 |
105–115 |
5 |
0.438 |
0.682 |
0.627 |
|
bnlg1152 |
8 |
150–260 |
10 |
0.219 |
0.844 |
0.825 |
|
umc1665 |
8 |
120–245 |
7 |
0.5 |
0.699 |
0.672 |
|
mmc0051 |
9 |
90–100 |
5 |
0.5 |
0.662 |
0.615 |
|
phi065 |
9 |
130–235 |
15 |
0.156 |
0.91 |
0.903 |
|
bnlg244 |
9 |
70–130 |
8 |
0.344 |
0.811 |
0.79 |
|
bnlg1012 |
9 |
220–130 |
7 |
0.281 |
0.801 |
0.773 |
|
umc1982 |
9 |
210–290 |
3 |
0.531 |
0.596 |
0.522 |
|
bnlg210 |
10 |
120–150 |
8 |
0.344 |
0.779 |
0.749 |
|
umc1038 |
10 |
105–140 |
12 |
0.313 |
0.828 |
0.711 |
|
bnlg1028 |
10 |
140–225 |
6 |
0.344 |
0.77 |
0.735 |
|
bnlg1451 |
10 |
105–185 |
9 |
0.188 |
0.863 |
0.848 |
|
mmc0501 |
10 |
155–190 |
9 |
0.188 |
0.861 |
0.846 |
|
Total |
|
|
381 |
|
|
|
|
Average |
|
|
7.6 |
0.414 |
0.709 |
0.676 |
Table 4Information on marker-trait associations using a Q general linear model (Q GLM).
Table 4
|
SSR marker |
Chr. |
Phenotypic trait |
P-value |
R2
|
|
phi056 |
1 |
SD |
0.047 |
30.1 |
|
mmc0111 |
2 |
EH |
0.002 |
58.9 |
|
|
LW |
0.001 |
60.5 |
|
|
PH |
0.025 |
45.5 |
|
mmc0022 |
3 |
EH |
0.007 |
67.7 |
|
nc005 |
4 |
EH |
0.02 |
61.1 |
|
|
PH |
0.036 |
58 |
|
bnlg1621 |
4 |
LW |
0.018 |
79.3 |
|
bnlg1695 |
5 |
PH |
0.047 |
71.7 |
|
phi116 |
7 |
EH |
0.029 |
21.6 |
|
bnlg1012 |
9 |
EH |
0.043 |
38.8 |
|
|
SD |
0.027 |
41.8 |
|
phi065 |
9 |
PH |
0.006 |
77.5 |
|
|
SD |
0.046 |
19.1 |
|
umc1982 |
9 |
PH |
0.013 |
26 |
|
|
SD |
0.024 |
22.7 |
|
bnlg1028 |
10 |
PH |
0.008 |
43.3 |
|
umc1038 |
10 |
EH |
0.013 |
79.5 |
|
|
LW |
0.009 |
81.2 |
|
|
SD |
0.039 |
73.7 |
References
- Abdel-Rahman MM, Bayoumi SR, Barakat MN. 2016. Identification of molecular markers linked to Fusarium ear rot genes in maize plants Zea mays L. Biotechnology & Biotechnological Equipment. 30: 692-699.
- Akagi H, Yokozaki Y, Inagaki A, Fujimura T. 1997. Highly polymorphic microsatellites of rice consist of AT repeats, and a classification of closely related cultivars with these microsatellite loci. Theor Appl Genet. 94: 61-67.
- Barata C, Carena MJ. 2006. Classification of North Dakota maize inbred lines into heterotic groups based on molecular and testcross data. Euphytica. 151: 339-349.
- Borba TCO, Brondani RPV, Breseghello F, Coelho ASG, Mendonça JA, Rangel PHN, et al. 2010. Association mapping for yield and grain quality traits in rice (Oryza sativa L.). Genet Mol Biol. 33: 515-524.
- Bradbury PJ, Zhang Z, Kroon DE, Casstevens TM, Ramdoss Y, Buckler ES. 2007. TASSEL: software for association mapping of complex traits in diverse samples. Bioinformatics. 23: 2633-2635.
- Cai H, Chu Q, Gu R, Yuan L, Liu J, Zhang X, et al. 2012. Identification of QTLs for plant height, ear height and grain yield in maize (Zea mays L.) in response to nitrogen and phosphorus supply. Plant Breed. 131: 502-510.
- Cha HJ, Choi YP, Song IK, Bok TG, Lee HB. 2009. Botanical and ear characteristices of the yellow glutinous corn hybrid, Daehakchal Gold 1, at various planting stages. J Agri Sci. 36: 123-127.
- Chen JY, Xu L, Cai YL, Xu J. 2008. QTL mapping of phosphorus efficiency and relative biologic characteristics in maize (Zea mays L.) at two sites. Plant Soil. 313: 251-266.
- Dellaporta SL, Wood J, Hicks JB. 1983. A simple and rapid method for plant DNA preparation. Version II Plant Mol Biol Rep. 1: 19-21.
- Dice LR. 1945. Measures of the amount of ecologic association between species. Ecology. 26: 297-302.
- Enoki H, Sato H, Koinuma K. 2002. SSR analysis of genetic diversity among maize inbred lines adapted to cold regions of Japan. Theor Appl Genet. 104: 1270-1277.
- Evanno G, Regnaut S, Goudet J. 2005. Detecting the number of clusters of individuals using the software STRUCTURE: a simulation study. Mol Ecol. 14: 2611-2620.
- Fan XM, Tan J, Chen HM, Yang JY. 2003. Heterotic grouping for tropical and temperate maize inbreds by analyzing combining ability and SSR markers. Maydica. 48: 251-257.
- Flint-Garcia SA, Thuillet AC, Yu JM, Pressoir G, Romero SM, Mitchell SE, et al. 2005. Maize association population: a high resolution platform for quantitative trait locus dissection. Plant J. 44: 1054-1064.
- Hallauer AR, Russell WA, Lamkey KR. 1988. Corn breeding. pp. 463-564. Sprague GF, Dudley JW, editors. Corn and corn improvement. 3rd ed. Agronomy Monograph 18. American Society of Agronomy, Crop Science Society of America, Soil Science Society of America. Madison, WI, USA.
- Hu Z, Zhang D, Zhang G, Kan G, Hong D, Yu D. 2014. Association mapping of yield-related traits and SSR markers in wild soybean (Glycine soja Sieb. and Zucc.). Breed Sci. 63: 441-449.
- Jompuk C, Fracheboud Y, Stamp P, Leipner J. 2005. Mapping of quantitative trait loci associated with chilling tolerance in maize (Zea mays L.) seedlings grown under field conditions. J Exp Bot. 56: 1153-1163.
- Kandianis CB, Stevens R, Liu WP, Palacios N, Montgomery K, Pixley K, et al. 2013. Genetic architecture controlling variation in grain carotenoid composition and concentrations in two maize populations. Theor Appl Genet. 126: 2879-2895.
- Kashiwagi T, Togawa E, Hirotsu N, Ishimaru K. 2008. Improvement of lodging resistance with QTLs for stem diameter in rice (Oryza sativa L.). Theor Appl Genet. 117: 749-757.
- Ku LX, Zhang J, Guo SL, Liu HY, Zhao RF, Chen YH. 2012. Integrated multiple population analysis of leaf architecture traits in maize (Zea mays L.). J Exp Bot. 63: 261-274.
- Lima MDA, de Souza CL, Bento DAV, de Souza AP, Carlini-Garcia LA. 2006. Mapping QTL for grain yield and plant traits in a tropical maize population. Mol Breed. 17: 227-239.
- Liu K, Muse SV. 2005. PowerMarker: an integrated analysis environment for genetic marker analysis. Bioinformatics. 21: 2128-2129.
- Liu L, Zhang YD, Li HY, Bi YQ, Yu LJ, Fan XM. 2016. QTL mapping for gray leaf spot resistance in a tropical maize population. Plant Dis. 100: 304-312.
- Mezmouk S, Dubreuil P, Bosio M, Décousset L, Charcosset A, Praud S, et al. 2011. Effect of population structure corrections on the results of association mapping tests in complex maize diversity panels. Theor Appl Genet. 122: 1149-1160.
- Mumm RH, Dudley JW. 1994. A classification of 148 U.S. maize inbreds: I. Cluster analysis based on RFLPs. Crop Sci. 34: 842-851.
- Park KJ, Lee JK, Sa KJ, Koh HJ. 2012. Genetic analyses for yield components and taste-associated traits in F2:3 population derived from the cross between waxy and sugary maize inbred line. Korean J Breed Sci. 44: 328-337.
- Pasam RK, Sharma R, Malosetti M, van Eeuwijk FA, Haseneyer G, Kilian B, et al. 2012. Genome-wide association studies for agronomical traits in a worldwide spring barley collection. BMC Plant Biol. 27: 12-16.
- Pejic I, Ajmone-Marsan P, Morgante M, Kozumplick V, Castiglioni P, Taramino G, et al. 1998. Comparative analysis of genetic similarity among maize inbred lines detected by RFLPs, RAPDs, SSR, and AFLPs. Theor Appl Genet. 97: 1248-1255.
- Pritchard JK, Wen W. 2003. Documentation for STRUCTURE software: Version 2. http://web.stanford.edu/group/pritchardlab/structure.html
- Reid LM, Xiang K, Zhu X, Baum BR, Molnar SJ. 2011. Genetic diversity analysis of 119 Canadian maize inbred lines based on pedigree and simple sequence repeat markers. Can J Plant Sci. 91: 651-661.
- Rohlf FJ. 1998. NTSYS- pc: Numerical taxonomy and multivariate analysis system. Version: 2.02. Exeter Software. Setauket, New York.
- Sa KJ, Kim JA, Park KJ, Park JY, Goh BD, Lee JK. 2011. Analysis of genetic diversity and population structure for core set of waxy and normal maize inbred lines using SSR Markers. Kor J Breed Sci. 43: 362-373.
- Sabadin PK, Souza CL Jr, Souza AP, Garcia AAF. 2008. QTL mapping for yield components in a tropical maize population using microsatellite markers. Hereditas. 145: 194-203.
- Teng F, Zhai L, Liu R, Bai W, Wang L, Huo D, et al. 2013. ZmGA3ox2, a candidate gene for a major QTL, qPH3.1, for plant height in maize. Plant J. 73: 405-416.
- Wang R, Yu Y, Zhao J, Shi Y, Song Y, Wang T, et al. 2008. Population structure and linkage disequilibrium of a mini core set of maize inbred lines in China. Theor Appl Genet. 117: 1141-1153.
- Xue Y, Warburton ML, Sawkins M, Zhang X, Setter T, Xu Y, et al. 2013. Genome-wide association analysis for nine agronomic traits in maize under well-watered and water-stressed conditions. Theor Appl Genet. 126: 2587-2596.
- Yu J, Buckler ES. 2006. Genetic association mapping and genome organization of maize. Curr Opin Biotechnol. 17: 155-160.