Abstract
The objective of this study was to detect QTLs for rice seedling traits under normal water (control) and low water conditions (drought stress). Ninety-eight recombinant inbred lines (RILs) from a cross between closely-related japonica cultivars, M-203 and M-206 were grown under both low water and normal water conditions. QTLs for morphological traits were investigated at seedling stage using 5,164 single nucleotide polymorphisms via genotyping-by-sequencing. Twenty-three QTLs were associated with four seedling traits: shoot length (SL), root length (RL), shoot dry weight (SW) and root dry weight (RW), were detected and most QTLs were clustered on chromosome 1, 6, 7 and 11. Under normal water conditions, nine QTLs for seedling traits were detected and M-203 alleles increased all the values. The locations of most QTLs were consistent with genes that regulate or respond to auxin and gibberellin. For drought tolerance, fourteen QTLs were detected including seven for drought stress conditions and seven for relative performance (values from drought stress conditions/normal water conditions). Seven QTLs from drought stress conditions coincided with the loci of previously identified drought tolerance genes. Based on the shoot and root length under drought stress conditions, five lines exhibiting the highest values in common were selected as a drought tolerance group. Those lines exhibited better growth than the parents under drought stress conditions and had QTLs alleles for drought tolerance detected in this study. QTL information and selected lines may be used for improving seedling vigor and drought tolerance of rice in breeding programs.
-
Key words: Rice, QTL(Quantitative Trait Loci), Seedling vigor, Drought
INTRODUCTION
According to the report from the United Nations (UN 2017), the world’s population is expected to reach 9.7 billion by 2050. Therefore, it is necessary to increase the amount of land for growing crops or improve productivity in order to meet the future demand for food. Climate trends may change the land area available for agriculture and negatively affect crop yield (
Zhang and Cai 2011;
Leng and Huang 2017). Under abnormal weather conditions such as droughts and floods, farmers can change planting dates to reduce some risks during growing season. Due to the difficulty in avoiding environmental stresses after planting rice in the field, breeding varieties that are tolerant to abiotic stress has great potential to meet the increasing demand by enabling more stable crop production (
Farnham and Bjorkman 2011). To this end, many researchers have examined various approaches and many advances, includeing finding genes and physiological mechanisms. One of the famous achievements in rice was the identification of QTL for submergence tolerance,
Sub1, which was then introduced into a mega variety Swarna. Swarna-Sub1 was released to Southeast Asia and India with an approximately 45% increase in yield compared to the current variety when subjected to flooded conditions for 10 days (
Dar et al. 2013).
Seedling traits including root morphology are important considerations in rice breeding programs and are affected by both environmental and genetic factors as well as the interactions between them. Many studies have been conducted to understand genetic factors influencing seedling traits. QTL analyses of seedling traits including drought stress tolerance have been conducted with various mapping populations (e.g., RIL, BIL and DHL) and many QTLs have been identified over the past few decades (
Hu et al. 2007;
Kato et al. 2008;
Xu et al. 2011;
Prince et al. 2015). This information on QTLs/genes is readily accessible via various public databases (e.g.,
www.gramene.org and
http://qtaro.abr.affrc.go.jp) and can be used by breeding programs to improve certain traits. However, most mapping populations used in these studies were derived from inter-subspecific and inter-specific crosses due to a higher level of polymorphism than present in intra-subspecific crosses, which can increase mapping efficiency (
Causse et al. 1994;
Kwon et al. 2008). As a result, there are limitations to employing the QTLs detected in these studies. While some QTL studies involving populations from intra-subspecific crosses such as
indica/indica (
Cui et al. 2002;
Xie et al. 2014) and
japonica/japonica (
Wada et al. 2006;
Tabata et al. 2007;
Kwon et al. 2008;
Yang et al. 2010;
Abe et al. 2012) have been reported, the advent of next-generation sequencing-based SNP marker genotyping has enabled more efficient QTL analyses using populations that are representative of the germplasm and crosses made in breeding programs, which should increase the utility of the QTLs detected for variety development.
The objectives of this study were 1) to identify QTLs for controlling seedling traits under both normal water condition (control) and low water condition (drought stress) using 98 RILs derived from a temperate japonica cross, 2) to select lines tolerant to drought stress as evidenced by strong seedling vigor under drought stress condition, and 3) to validate the genotypic differences between drought sensitive and tolerance groups in this study by using SNP-index plot.
MATERIALS AND METHODS
Plant materials and marker data
Previously, a recombinant inbred line (M-2036 RIL population) mapping population (F
7; n = 241) derived from the California
temperate japonica cultivars M-203 and M-206 was developed by single seed descent and a subset of this population (n = 176) was subjected to genotyping-by-sequencing (GBS) and used to conduct quantitative trait loci (QTL) analysis of four seedling vigor-associated traits (
Cordero-Lara et al. 2016). Using the GBS single nucleotide polymorphism (SNP) marker data, cluster analysis was performed to select 98 RILS for this study (SPSS Statistics ver. 20.0; IBM Corp., 2011). SNPs for QTL analysis were selected based on the fact that 1) polymorphisms existed between the two parents, 2) the genotype was fully identified between the two parents without any missing genotype information, 3) no heterozygous SNPs were in either parent, 4) minor allele frequency (MAF) was less than 1%, and 5) genotype rate per site was greater than 75%. Filtration of the SNP dataset was conducted by TASSEL v5 (
Bradbury et al. 2007) and MS EXCEL 2012 (Microsoft Corp., Redmond, WA), and 5,164 SNPs were selected.
Evaluation of four seedlings traits (shoot length, root length, shoot dry weight, and root dry weight) was performed on plants grown in a controlled environmental chamber under drought stress and non-stress conditions (
Fig. 1). Twenty seeds of each of the 98 RILs were pre-germinated at 30°C for 48 hours and eight seeds exhibiting similar sized sprouts were selected. Four of the seeds were sown in each of two Ray Leach “cone-tainers”
TM (Model SC10U; Steuwe & Sons, Inc., Oregon, USA) that were filled with sieved, sandy soil. The two sets of RILs were transferred to RL98 support trays (Steuwe & Sons, Inc., Oregon, USA) in a completely randomized design and placed in two plastic Sterilite
® containers (75.6 × 47.6 × 34.2 cm; Sterilite Corp., Massachusetts, USA) in a Conviron PGR15 growth chamber (Controlled Environments Ltd., Winnipeg, Canada). Growth conditions were 20°C (7 PM to 7 AM) and 28°C (7 AM to 7 PM), a 12-hour photoperiod (7 AM to 7 PM) with a photosynthetic photon flux density of 500 μmol/m
2/s, and 60% relative humidity. Initially, the water level was maintained at a height of 20 cm high from the bottom of the cone-tainers with deionized water on a daily basis. The parental accessions (M-203 and M-206) were planted using the same procedure in a total of 20 cone-tainers and 10 of each were transferred to support trays and two additional Sterilite
® containers.
Five days after planting, the four seedlings were thinned to one per cone-tainer and water levels changed to one cm high for drought stress treatments (RILs and parents). For the non-stress treatment, the water levels were maintained at 20 cm. Seven days later the temperature of the growth chambers was changed to 5°C to prevent further growth while measuring shoot length (SL) and root length (RL). Plants were removed from cone-tainers and roots were rinsed clean with water prior to measurements. Following completion of length measurements, seedlings were divided into shoots and roots and dried at 70°C for 72 hours before determining shoot dry weight (SW) and root dry weight (RW). Measurement of shoot and root lengths and sampling for dry weight were completed within one day. In addition to the absolute trait measurements under the stress and non-stress treatments, relative trait values were calculated as the value under stress divided by the value under non-stress conditions. These experiments were conducted four times, and the means from the four replications were used for statistical analyses and QTL mapping.
Data analysis and QTL mapping
Statistical analysis, including mean and standard deviation of the RIL population, t-test, correlations among seedling traits based on Pearson’s correlation coefficient, and analysis of variance (ANOVA), were performed using SPSS Statistics ver. 18.0. Broad-sense heritabilities (h2B) were calculated from the estimates of genetic (VG) and residual (VE) variances derived from the expected mean squares of the ANOVA as h2 = VG/(VG + VE/r), where r was the number of replications.
Phenotypic data for QTL mapping consisted of the mean of four replications for the four traits under stress and non-stress conditions and relative trait values (stress values/non-stress values). QTL analyses were performed with the R package (ver. 3.3.2) using the publicly available R/qtl code at
http://www.rqtl.org. The genetic linkage map was constructed using the plot.map function and a single-marker QTL scan was performed using the scanone() function with Haley-Knott Regression. The logarithm of the odds (LOD) threshold of 3.0 was used to declare significant QTL.
Two subsets of the RILs evaluated in this study were identified based on the shoot and root length under low water availability conditions. Five lines exhibiting the highest values in common with respect to shoot and root length under drought stress, were designated the drought tolerant group, while five lines having the lowest values in common were designated the drought sensitive group. To determine the differences in the genotypes between the two groups for all SNP regions, the genotypes of each group were compared with M-203 which exhibited significantly greater trait values than M-206 under normal and low water availability. Then an SNP-index was calculated using the same method as QTL-seq (
Takagi et al. 2013). For example, if the genotype of two of five lines were different from M-203, the SNP-index was defined as 0.4 (2/5) and if the genotype of five lines are different from M203, the SNP-index was defined as 1.0 (5/5). Trend lines in ΔSNP-index plot were drawn using the mean of 20 ΔSNP-index values.
RESULTS
Phenotypic variation of the parents and RILs
The phenotypic values of parents, range of values observed in the RILs, heritability estimates for four seedling traits under both water conditions and the relative trait values are summarized in
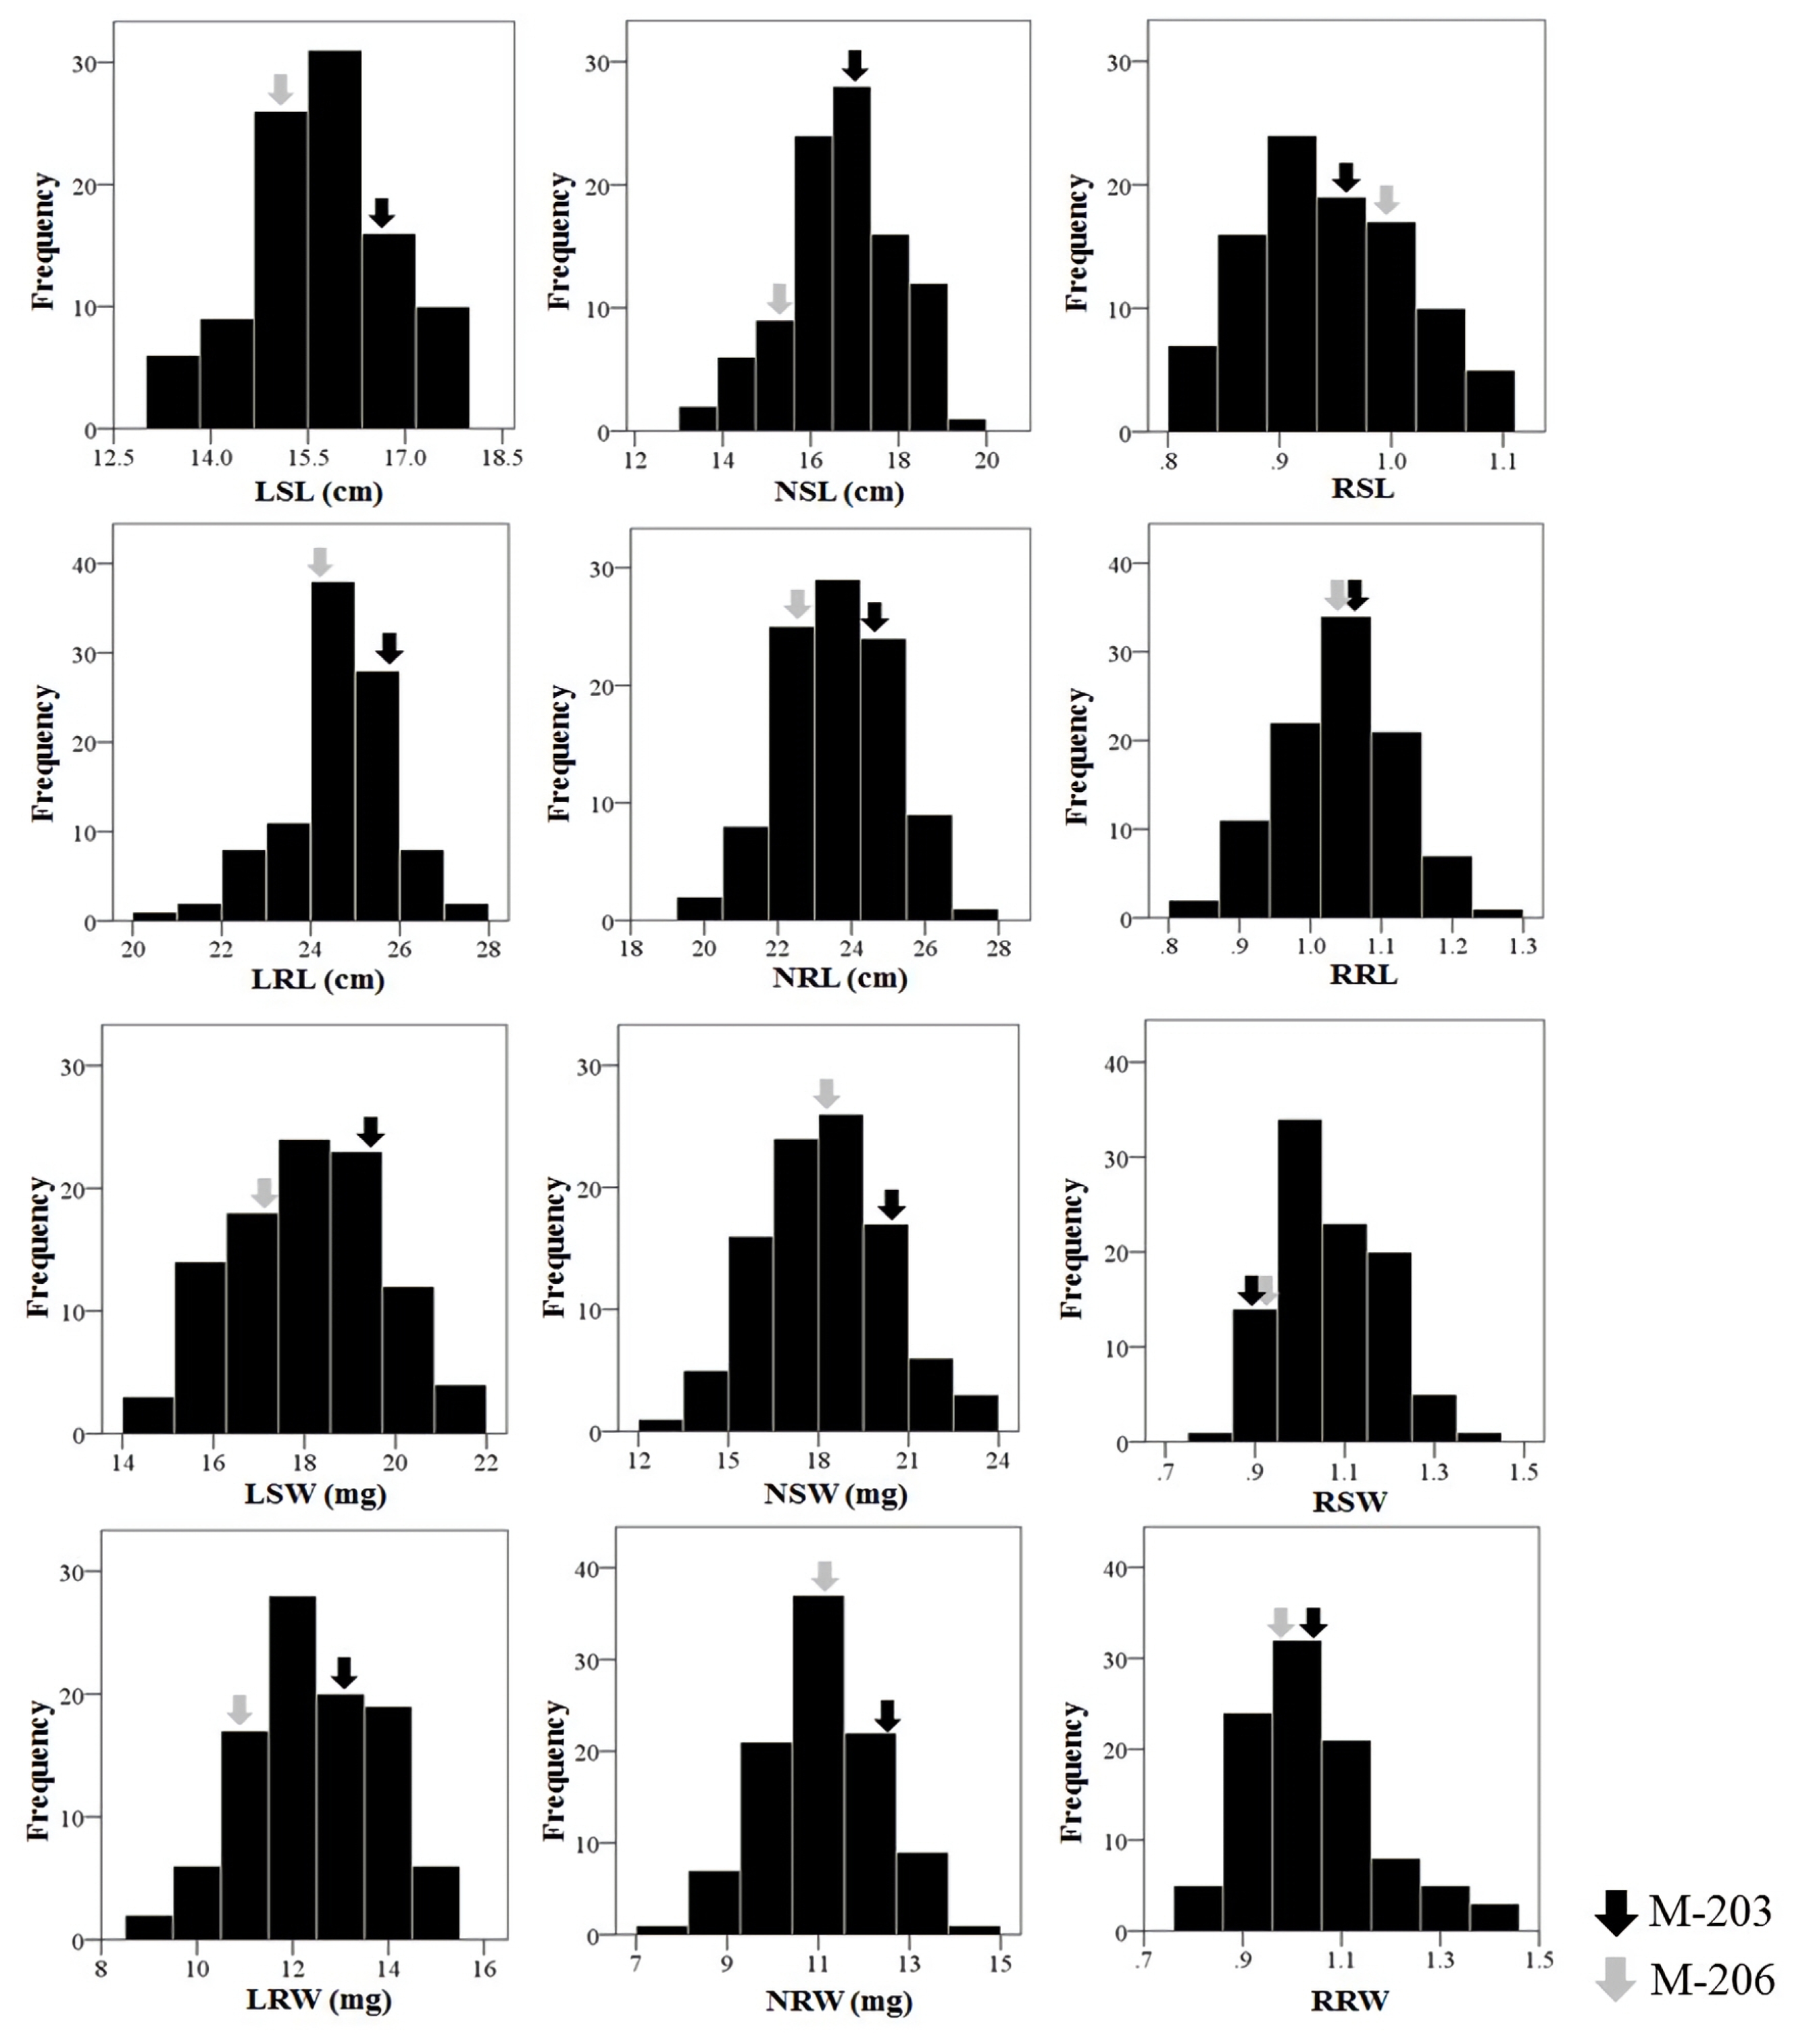
Table 1. The relative values were calculated by dividing the value of drought stress condition by those of normal condition. Compared to M-206, M-203 seedlings exhibited significantly greater values for all traits under normal and low water availability. All the traits showed a continuous distribution among the RIL population used in this study (
Fig. 2). Transgressive segregation in both directions was observed, and the mean trait values of the RILs were nearly the same as those of M-203 and M-206 except for SW and RW in normal condition and all values in relative traits values.
In this study, SL and SW under normal (non-stress) conditions trended to be higher than those that were under low water availability conditions, but RL and RW showed opposite tendency. Also, the tip of the leaves and the soil under low water conditions were dried in
Fig. 1. For these stressed seedlings, RW showed the highest heritability (0.32) and SW exhibited the lowest heritability (0.19). The results of the correlation analysis of the seedling traits under both conditions and the relative trait values are summarized in
Table 2. For each treatment, SL showed positive correlations between RL, SW, RW, respectively, and RW exhibit positive relationships with SL, RL and SW. Interestingly all traits under normal water conditions showed a negative correlation with the relative trait values and most were statistically significant. The highest positive correlation was observed between SW and RW under low water conditions (
r = 0.771**), and the highest negative correlation was found between RL under normal water condition and the relative RL (
r = −0.770**).
QTL analyses were conducted using phenotypic data collected from the both water conditions as well as the relative trait values and the SNP marker data generated in a previous study involving these lines (
Cordero-Lara et al. 2016). Peak marker, confidence interval markers that were likely to contain QTLs (
P < 0.05), LOD score, and additive effect (A) and its phenotypic variation (R
2) explained by a single QTL are summarized in
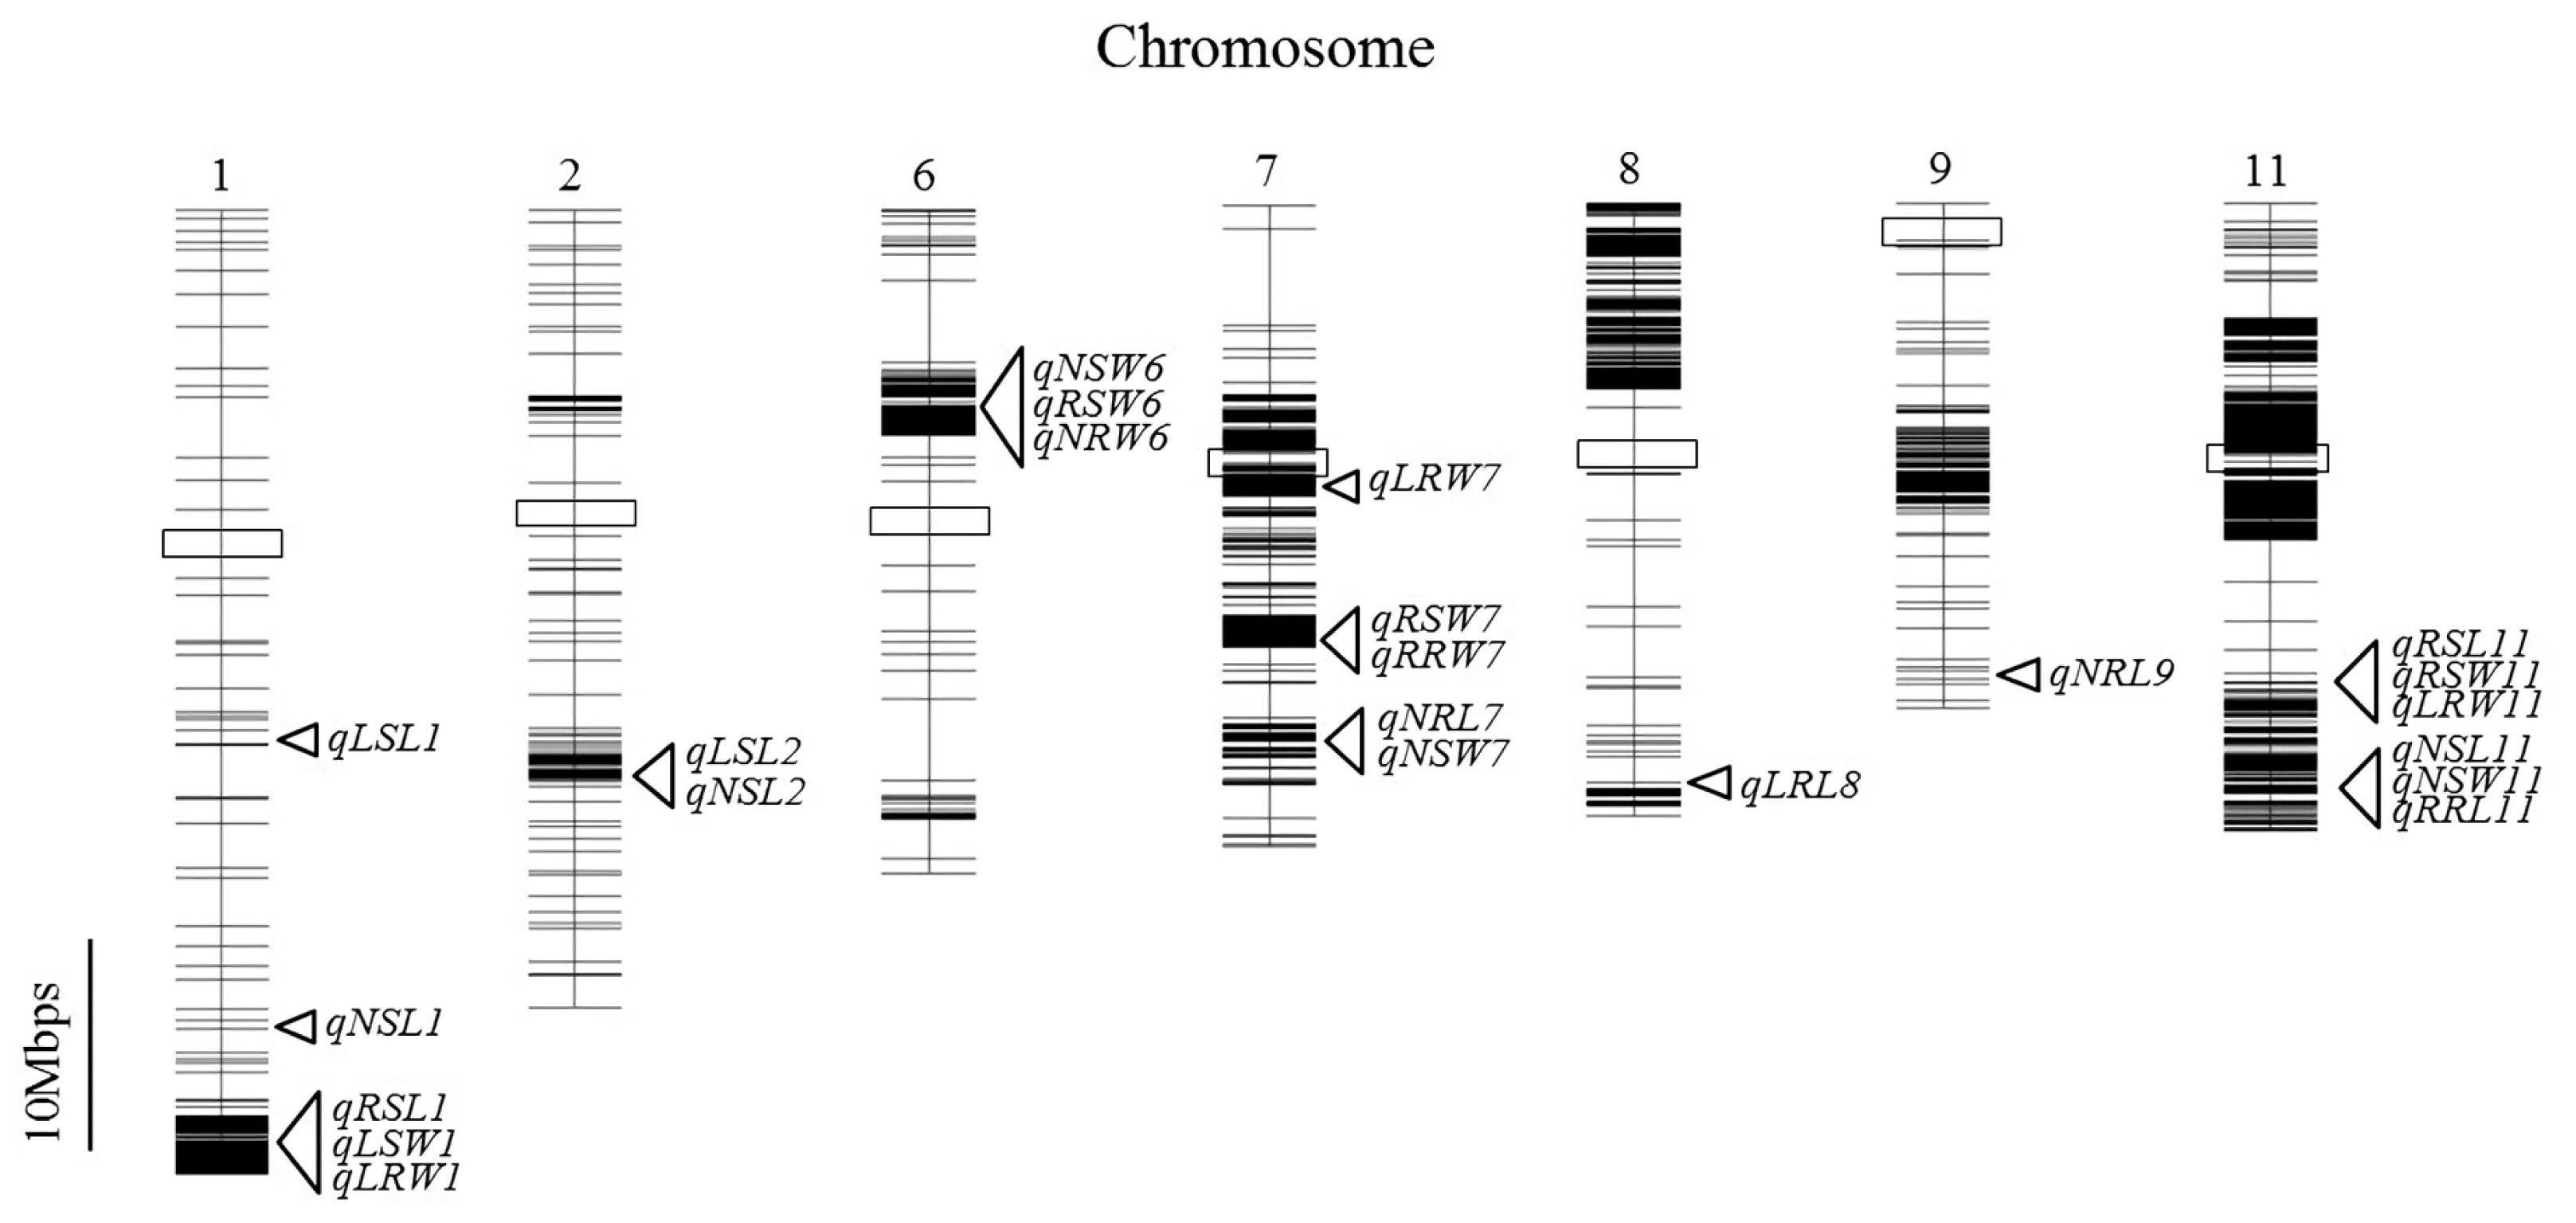
Table 3 and genome locations are shown in
Fig. 3. A total of 23 QTLs exceeding the LOD threshold of 3.0 were identified. Of these, seven were detected under low water condition, nine under normal condition and seven based on relative trait values. For each trait, at least one QTL under all treatments was detected and most QTLs were clustered on chromosomes 1, 6, 7 and 11. In
Table 4, comparison of QTLs identified in this study and genes/QTLs from previous studies is summarized.
All QTLs mapped to regions similar to those previously reported. All QTLs detected under normal water conditions exhibited positive effect from M-203, while QTLs detected based on relative trait values were exhibited a negative effect indicating that the M-206 allele acted as the favorable allele. Under low water conditions, however, the additive effect showed both positive and negative values depending on the QTL. Phenotypic variation (R2) explained ranged from 5.6% to 30.8% with qRSW11 for relative shoot dry weight contributing the largest effect on the phenotypic variation observed.
Shoot length
Seven QTLs were detected for shoot length under both water conditions and based on relative values. The phenotypic variance explained ranged from 6.2 to 25.9%. Three of these QTLs, qLSL1, qNSL1 and qRSL1, were identified on chromosome 1 and confidence intervals shared some regions, however, the peak markers were located far away from each other. Two QTLs, qLSL2 and qNSL2, were found on chromosome 2 and accounted for 16.1 and 25.9% of phenotypic variation, respectively. The other two QTLs, qNSL11 and qRSL11, had peak and flanking markers in a similar position on chromosome 11.
Root length
Four QTLs controlling root length were detected and each was located on a different chromosome. Under normal conditions, qNRL7 and qNRL9 were identified on chromosome 7 and 9, and accounted for 17.1% and 24.1% of phenotypic variation, respectively. At both loci, M-203 alleles increased the root length. qNRL9 showed the highest R2 values among QTLs detected under normal water conditions in this study. qLRL8 on chromosome 8 was detected under low water conditions and conferred 7.8% of phenotypic variation, and qRRL11 was found on the short arm of chromosome 11 and contributed 6.7% of phenotypic variation for relative root length. In contrast to the two QTLs identified under normal water conditions, M-206 alleles increased the root length at these two loci.
Shoot dry weight
Of the seven QTLs for shoot dry weight, qLSW1 was found to explain 14.7% of the phenotypic variation for SW under low water conditions with the positive effect coming from the M-203 allele. The location of qLSW1 was very close to qRSL1 for shoot length and showed the highest LOD value (5.20) of the QTLs detected in this study. Three QTLs were detected under normal water conditions and three when relative trait values were considered. Interestingly, the QTLs were clustered on the same chromosomes (6, 7 and 11). In each case, the alleles responsible for the positive effect were from different parents. For example, qNSW6 and qRSW6 were identified on chromosome 6 with the same peak marker, and the M-203 allele at these loci increased and decreased the shoot dry weight, respectively. qNSW7 and qRSW7, were observed on chromosome 7 and their LOD confidence interval were located closely, but the peak marker at each QTL was a bit different. qNSW11 and qRSW11 were detected on chromosome 11 and these QTLs were in a similar region to two QTLs, qNSL11 and qRSL11, detected for shoot length. qRSW11 showed the highest R2 value among QTLs for shoot dry weight and M-203 allele decreased the shoot dry weight at this locus.
Root dry weight
Five QTLs for root dry weight were detected under both water conditions and when relative trait values were considered. qLRW1 was located closely to the shoot-related QTLs, qRSL and qLSW1. At this locus, the M-203 allele increased the root dry weight and explained 27.7% of phenotypic variation. qNRW6 was detected at a similar position on the short arm of chromosome 6 as qNSW6, and the M-203 allele increased root dry weight at this locus. Two QTLs, qLRW7 and qRRW7, were observed on chromosome 7, but peak markers and confidence intervals were a bit different. At these loci, the M-203 allele decreased the values and accounted for 6.2 and 5.6% phenotypic variation, respectively. The location of qRRW7 was close to qNRL7, qNSW7 and qRSW7, but qLRW7 mapped to a region above of those QTLs. The other QTL, qLRW11, was detected under low water conditions and conferred 11.1% phenotypic variation. It also shared the confidence interval region with qNSL11, qRSL11, qRRL11, qNSW11 and qRSW.
Selected lines for tolerance and sensitivity to drought
Shoot and root length are the most important considerations for selecting a drought tolerance rice. Based on the shoot and root length under low water condition, five lines showing the highest values in common were selected for drought tolerance group and five lines having the lowest values in common were chosen for drought sensitive group. Mean values of the two groups for the four seedling traits under both conditions and the relative trait values are summarized in
Table 5.
Under normal water conditions, the two groups did not show differences in all traits. However, the tolerant group exhibited significantly higher values in all traits under drought stress conditions and in relative trait values compared to the sensitive group. In particular, shoot and root length of the tolerant group under drought stress conditions was clearly greater than the sensitive group by an average of 2.6 and 4.0 cm, respectively. Both the shoot and root length of the sensitive group decreased by an average of 2.1 cm under drought stress conditions, but drought tolerant group exhibited average increases of 0.5 and 1.5 cm, respectively. Of the tolerant lines, M-2036-58 showed the greatest shoot length under both water conditions (18.3 and 18.5 cm).
Differences in the genotypes between the two groups were determined by comparison to M-203, and a SNP-index was calculated for each of the 5,164 markers. Then a SNP-index plot was made covering the 12 chromosomes as shown in
Fig. 4. There were highly contrasting patterns of SNP-index graph of chromosomes 2, 7 and 11 between two groups. To clearly identify the genotype, a ΔSNP-index plot (SNP-index of tolerant group – SNP-index of sensitive group) was made and compared with the QTLs detected under drought stress in this study. The trend line of the ΔSNP-index plot exhibited three positive and one negative peak higher than 0.5 SNP-index value and all peaks were correctly corresponded to QTLs detected in this study. However, no peaks were detected on chromosome 1 on which three low water condition QTLs were identified.
DISCUSSION
Seedling traits are one of the most important considerations in rice production and breeding programs to increase yield, and are affected by environmental factors, genetic factors and interactions between them. To understand genetic factors influencing those traits, there have been many studies conducted over the last few decades. This study was performed to identify QTLs relevant to seedling traits under normal water and drought stress conditions using
temperate japonica rice and to select promising lines for drought tolerance. There were significant differences in all seedling traits under both water conditions reflecting superior performance for these traits by M-203 compared to M-206 (
Table 1). The distribution of four seedling traits under both water conditions exhibited a continuous distribution, and transgressive segregants that fell beyond the high and low means of the two parents were observed (
Fig. 2). These results are in agreement with a previous report (
Cordero-Lara et al. 2016), indicating that all seedling traits are affected by quantitative trait loci.
QTLs for seedling traits under both water conditions and based on relative performance were investigated and a total of 23 exceeding the LOD threshold of 3.0 were identified. Of these, seven were detected under low water conditions, nine under normal conditions, and seven when relative trait values were considered. Interestingly, the nine QTLs under normal water conditions represented positive additive effects, indicating that alleles from M-203 increases the values, but seven QTLs involving relative performance exhibited negative additive effects (
Table 2). Also, most QTLs from different conditions were located on similar regions. There are two possible explanations for those results. One explanation involves how the relative trait performance was calculated in this study. Relative trait values were calculated by dividing the value under low water conditions by the value under normal conditions. Considering these relative values, we could express the response of each line under drought stress. For example, if some lines showed > 1.0, they have higher value under low water conditions compared to normal water conditions. In
Table 2, there were negative correlation between under normal water conditions and the relative performance in all traits, suggesting that lines with higher values under normal water conditions might show lower values under relative performance.
Zheng et al. (2008) reported a similar result that all traits under flood conditions were negatively correlated with relative performance. In other word, lines with higher values were more affected by drought stress than lines with lower values. As mentioned above, M-203 exhibited higher values in all seedling traits when compared to M-206. This suggests that some lines having M-203 alleles at those QTLs have a tendency to have higher values for the seedling traits examined than the lines with M-206 alleles under normal conditions, but they are more affected by drought stress conditions.
Another possible explanation is that there might be genes showing different responses depending on the conditions such as genotype-by-environment interaction. Therefore, genes from M-206 can improve the seedling traits under drought stress, even though M-206 showed lower trait values than M-203 under both water conditions (
Table 1). In fact, we observed that the M-206 positively affected the phenotypes for four QTLs detected under drought stress. In addition, a number of studies reported that alleles from inferior parent, low land rice, improved the drought tolerance (
Hu et al. 2007;
Kato et al. 2008;
Zheng et al. 2008). These results suggest genotype-by-environment interactions and gene interactions that influence these phenotypic traits.
Most of the QTLs detected in this study were located in the same or adjacent regions as those reported by previous studies, and clustered on several regions.
qNSL1, a QTL for shoot length under normal water conditions was detected on chromosome 1, flanked by S1_38247294 and 43228302, with a LOD of 3.20 explaining 21.2% of the phenotypic variation under normal water condition. It corresponds to
qHES1 for seedling height in our previous study (
Cordero-Lara et al. 2016). While its confidence interval also contains the major semi-dwarf gene
sd1 (
Cho et al. 1994;
Ashikari et al. 2002;
Sasaki et al. 2002;
Spielmeyer et al. 2002;
Cho et al. 2007), the peak LOD marker of
qNSL1 (39,935,566 bp) is about 1.5 MB away from the
sd1 gene (position 38,381,339). Under low water conditions,
qLSL1 was detected on chromosome 1 showing a wide confidence interval between markers S1_24052813 and S1_43097107 with a LOD of 3.35. Similarly, the confidence interval of this region contains the
sd1 gene but the locus of the peak marker is far away from the
sd1 gene. A number of QTLs related to drought tolerance (
Hemamalini, et al. 2000;
Zheng et al. 2008) have been reported in this region as well as the
osubp6 gene (position 22,238,470 bp) which controls growth speed during seedling stage (
Moon et al. 2009). Three other QTLs,
qRSL1,
qLSW1 and
qLRW1, also shared the confidence interval with
qNSL1 and accounted for 7.4, 14.7 and 27.7% of the phenotypic variation, respectively. Those three QTLs might be associated with one single drought tolerance gene since they were detected in similar region under low water conditions and relative performance. At these loci, there are three drought tolerance candidate genes,
OsNAC6 (
Nakashima et al. 2007),
Osabf1 (
Hossain et al. 2010) and
OsDREB1F (
Wang et al. 2008), and a number of studies have detected drought tolerance QTLs (
Price et al. 2000;
Moncada et al. 2001;
Venuprasad et al. 2002). While further research will be needed to determine the effect of each QTL and which genes may be related to it, our study suggest that these regions are likely to be important and useful targets for improvement in
temperate japonica rice breeding programs.
On chromosome 2,
qLSL2 and
qNSL2 for shoot length were detected. Their peak LOD markers were very close to each other and their confidence intervals also overlap, suggesting that they may represent the same QTL. In a similar region (27437826-27438863 bp),
Zhao et al. (2010) identified the drought tolerance ARAG1 gene, which acts as a negative regulator in the ABA-dependent pathway, and
Hu et al. (2007) reported a QTL controlling coleoptile length under both normal and drought stress conditions using the RILs from a cross of Bala/Azucena. Also,
Li et al. (2003) detected main-effect QTLs for plant height and their interactions with environments using an IR64/Azucena doubled-haploid population and
Haga et al. (2005) identified the
cpt1 gene (22,466,026-22,471,133 bp) controlling seedling phototropism using auxin translocation. Since
qLSL2 and
qNSL2 were detected under both water conditions, they may be more useful for breeding drought tolerance rice than any other QTLs.
Three QTLs were clustered on chromosome 6, two for shoot dry weight and one for root dry weight. The peak marker of
qNSW6 and
qRSW6 was the same and it was close to that of
qNRW6, suggesting that these may represent the same gene/locus. For drought tolerance,
Champoux et al. (1995) found QTLs using RILs and
Hossain et al. (2010) identified Osabf2 gene regulating the expression of abiotic stress-responsive genes through an ABA-dependent pathway.
Cui et al. (2002) also detected QTLs for shoot dry weight in this region under normal condition.
Five QTLs were clustered on chromosome 7 including one for root length, two for shoot length and two for root dry weight. Of these,
qRSW7 and
qRRW7 were detected under relative performance and peak markers were located closely.
Jiang et al. (2012) identified a gene, OSRIP18 (22,882,458-22,883,494 bp), in this region which increased tolerance to various abiotic stresses including drought.
qLRW7 was located a bit far away from the other QTLs and its locus corresponds to QTLs for root thickness and dry weight under drought stress (
Champoux et al. 1995) and the RePRP1 and RePRP2 genes which are functionally redundant suppressors of root cell expansion by reducing the root sensitivity to ABA. Under normal water conditions,
qNRL7 and
qNSW7 were detected and the M-203 allele affected the phenotype positively. Previous studies have identified genes affecting root (
Konishi et al. 2005) and shoot (
Zhang et al. 2011) length is the regions containing these QTLs.
Single QTL for root length were identified on chromosomes 8 (
qLRL8) and 9 (
qNRL9). Two drought tolerance candidate genes, OsDREB (
Chen et al. 2008) and OsAHP (
Sun et al. 2014), were identified in the same region as the
qLRL8 locus.
Price et al. (2002) also identified QTLs influencing root length but under normal conditions.
qNRL9, which affects root length under normal water conditions, conferred the greatest effect on phenotypic variation (24.1%) of any QTLs for the seedling traits measured under normal conditions. Many studies detected QTLs related to root length in the same region.
Ikeda et al. (2007) detected QTLs using RIL from Otomemoch/Yumenohatamochi,
Courtois et al. (2003) using RIL from IAC165/Co39 and
Uga et al. (2008) using an F
2 population from IR64/Kinandang Patong. Also, there is a candidate gene, SAUR39 (
Kant et al. 2009) controlling root length.
Six QTLs were detected on the long arm of chromosome 11 and constituted a cluster. Of these QTLs,
qRSL11,
qRRL11,
qRSW11 and
qLRW11 were detected based on relative performance and performance under low water conditions, suggesting that they might be related to drought tolerance.
Price et al. (2000) detected QTLs for drought tolerance using RILs from a cross Bala/Azucena and
Zhang et al. (2009) identified TLD1 which decreases the IAA in the shoot but increases drought tolerance. Another possible gene related to drought is OsPR4a whose location is very close to the location of these four QTLs.
Wang et al. (2011) reported that transgenic rice with overexpression of OsPR4a gene showed strengthened tolerance to drought at the seedling stage. The confidence markers of the four QTLs involved or were close to the region of TLD1 and OsPR4a. The other two QTLs,
qNSL11 and
qNSW11, were detected under normal conditions, and were located close to the region of D27 (
Lin et al. 2009). The D27 gene affects plant height and root length under normal water conditions by regulating auxin transport.
One of the goals of this study was the selection of lines with drought tolerance. Based on the shoot and root length under drought stress, two small subsets of lines representing tolerant and sensitive groups were identified. To examine the genotypic differences between the two groups, QTL-seq analysis approach (
Takagi et al. 2013) was employed. The peaks of the resulting ΔSNP-index plot corresponded to four of the seven QTLs detected under low water conditions (
qLSL2,
qLRW7,
qLRL8, and
qLRW11). However, the three low water conditions QTLs identified on chromosome 1 were not detected using this ΔSNP-index plot approach. There are two possibilities for this result. One is that
qLSL2 showed higher phenotypic variation than
qLSL1 and five lines that were selected do not have QTL allele at
qLSL1 (i.e., the sample size was too small). The other is that selection of the tolerant and sensitive groups was based on a combination of shoot and root length trait values rather than a single trait so lines with QTLs alleles on chromosome 1, which are favorable for some traits, were not selected.
Despite the close genetic relationship of the temperate japonica parental lines M-203 and M-206, several QTLs for seedling vigor-related traits were detected under normal and low water stress conditions with the aid of GBS-derived SNP markers. The QTLs and their associated markers identified using this intra-subspecific mapping population should be more relevant to japonica rice breeding programs interested in targeting seedling vigor and drought tolerance traits.
ACKNOWLEDGEMENTS
This work was supported in part by funds from USDA-ARS CRIS Project 21000-2032-021-00D, Rice Research Board RB-3 Project (2011–2014), and Rural Development Administration research project PJ0129602019. We thank Dr. V.C. Andaya (California Cooperative Rice Research Foundation, Inc.) for providing the initial population for the development of the M-2036 RIL population.
Fig. 1Evaluation of rice seedlings in the growth chamber. (a) Four pre-germinated seeds per each cone-tainer were planted and water level was maintained at 20 cm high from the bottom. (b) At this time, four seedlings were thinned to one per each cone-tainer and water level changed to 20 and 1 cm high, respectively. (c) Comparison of two different water treatments (left: low water conditions, right: normal water conditions).
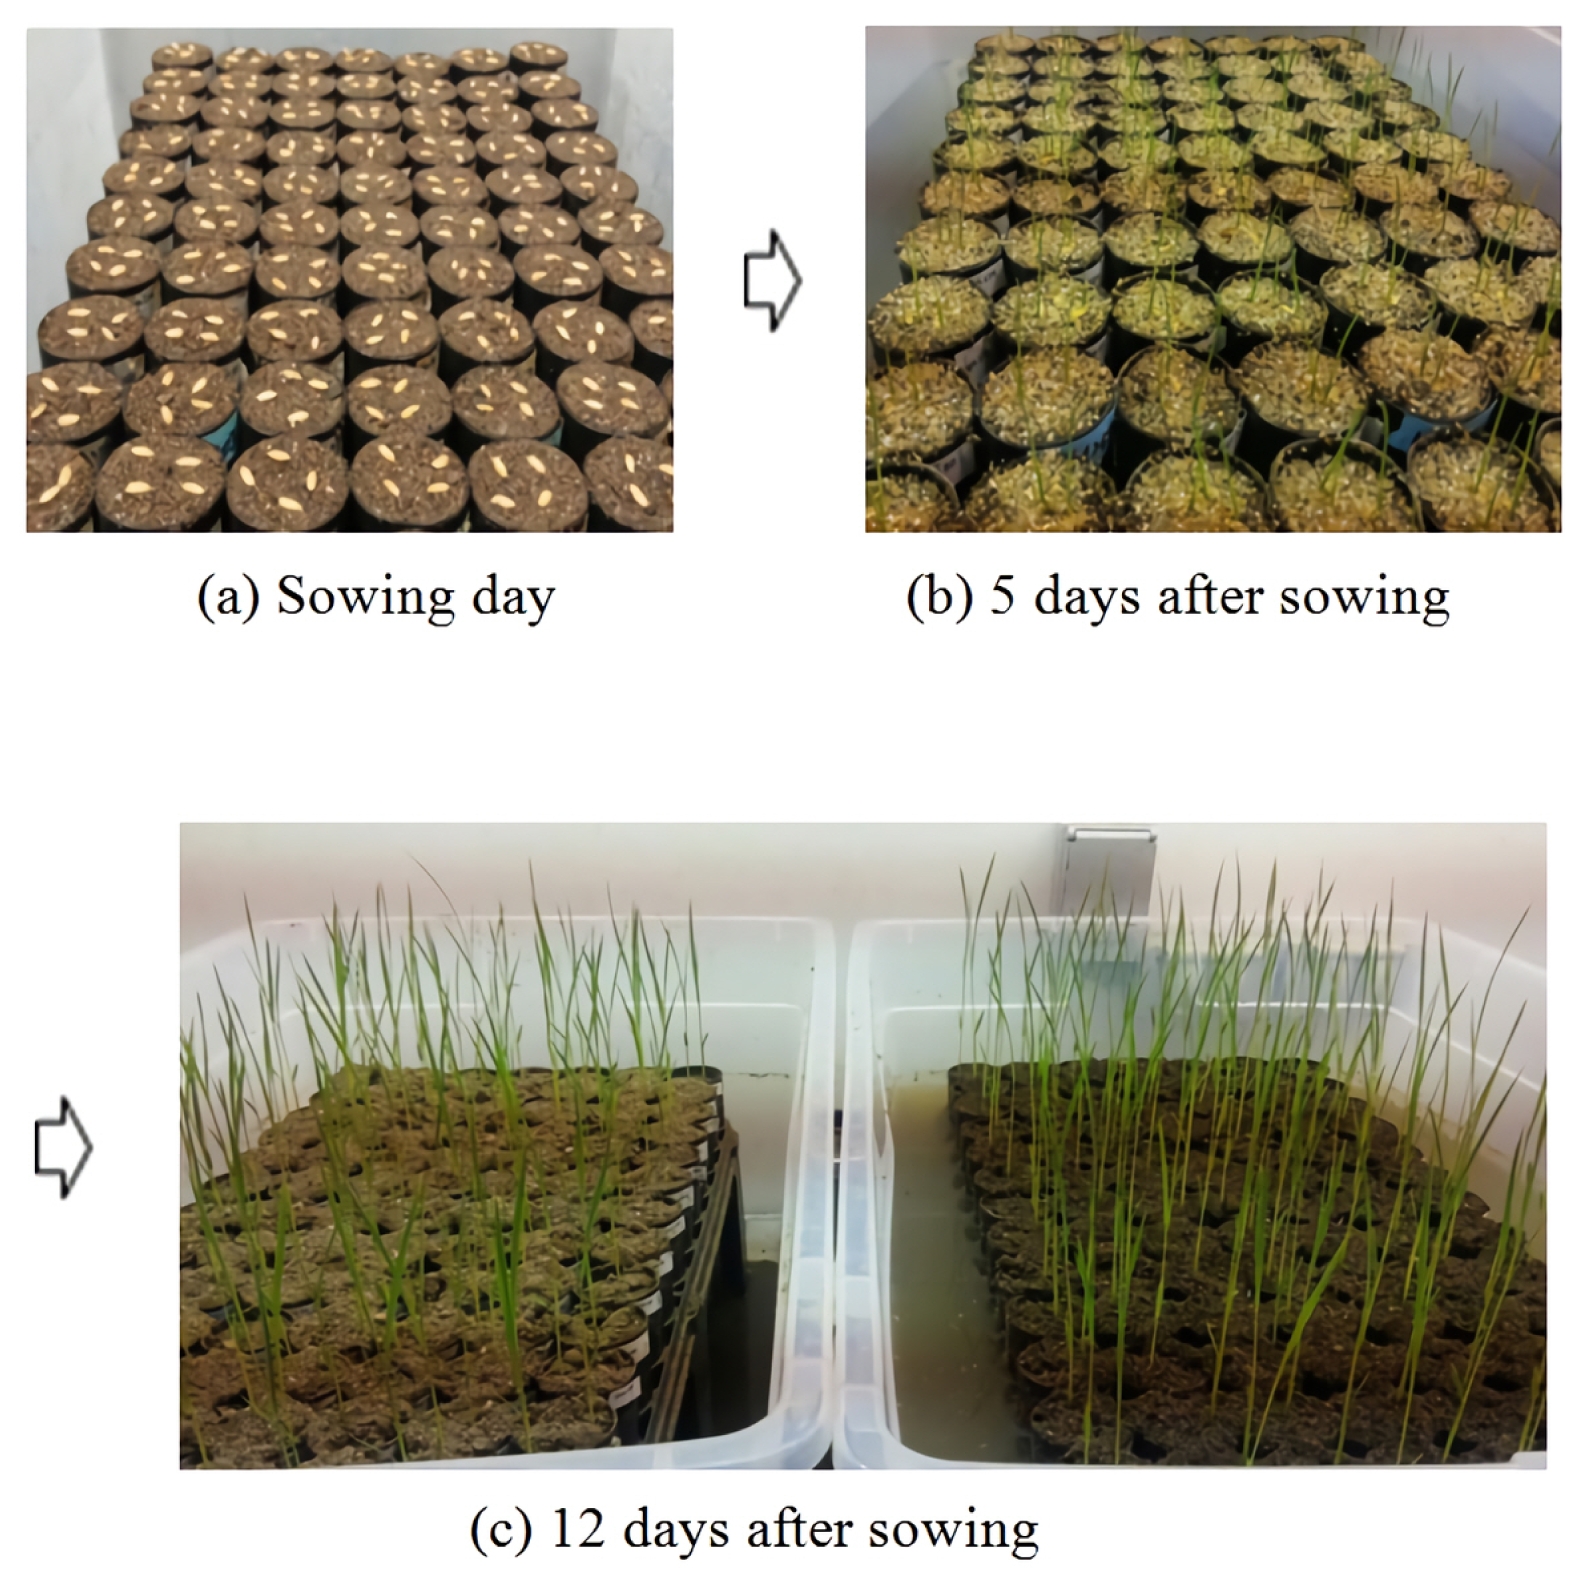
Fig. 2Distribution of four traits under different water conditions and their relative performance values. L: low water conditions, N: normal water conditions, R: relative performance (low water/normal water), SL: shoot length, RL: root length, SW: shoot dry weight, RW: root dry weight.

Fig. 3Physical map of single nucleotide polymorphism markers derived from GBS of the M-2036 recombinant inbred line mapping population (n = 98) and the locations of quantitative trait loci detected in this study. The boxed regions represent centromeres.

Fig. 4Single nucleotide polymorphism (SNP)-index plots of selected lines. (a) SNP-index plot of the tolerant to drought stress conditions group over 12 chromosomes. (b) SNP-index plot of the sensitive to drought stress conditions group over 12 chromosomes. (c) ΔSNP-index plot of 12 chromosomes. ΔSNP-index was calculated by subtracting SNP-index of the sensitive group from SNP-index of the tolerant group. QTLs detected for drought stress in this study are displayed at the peak points of plot.
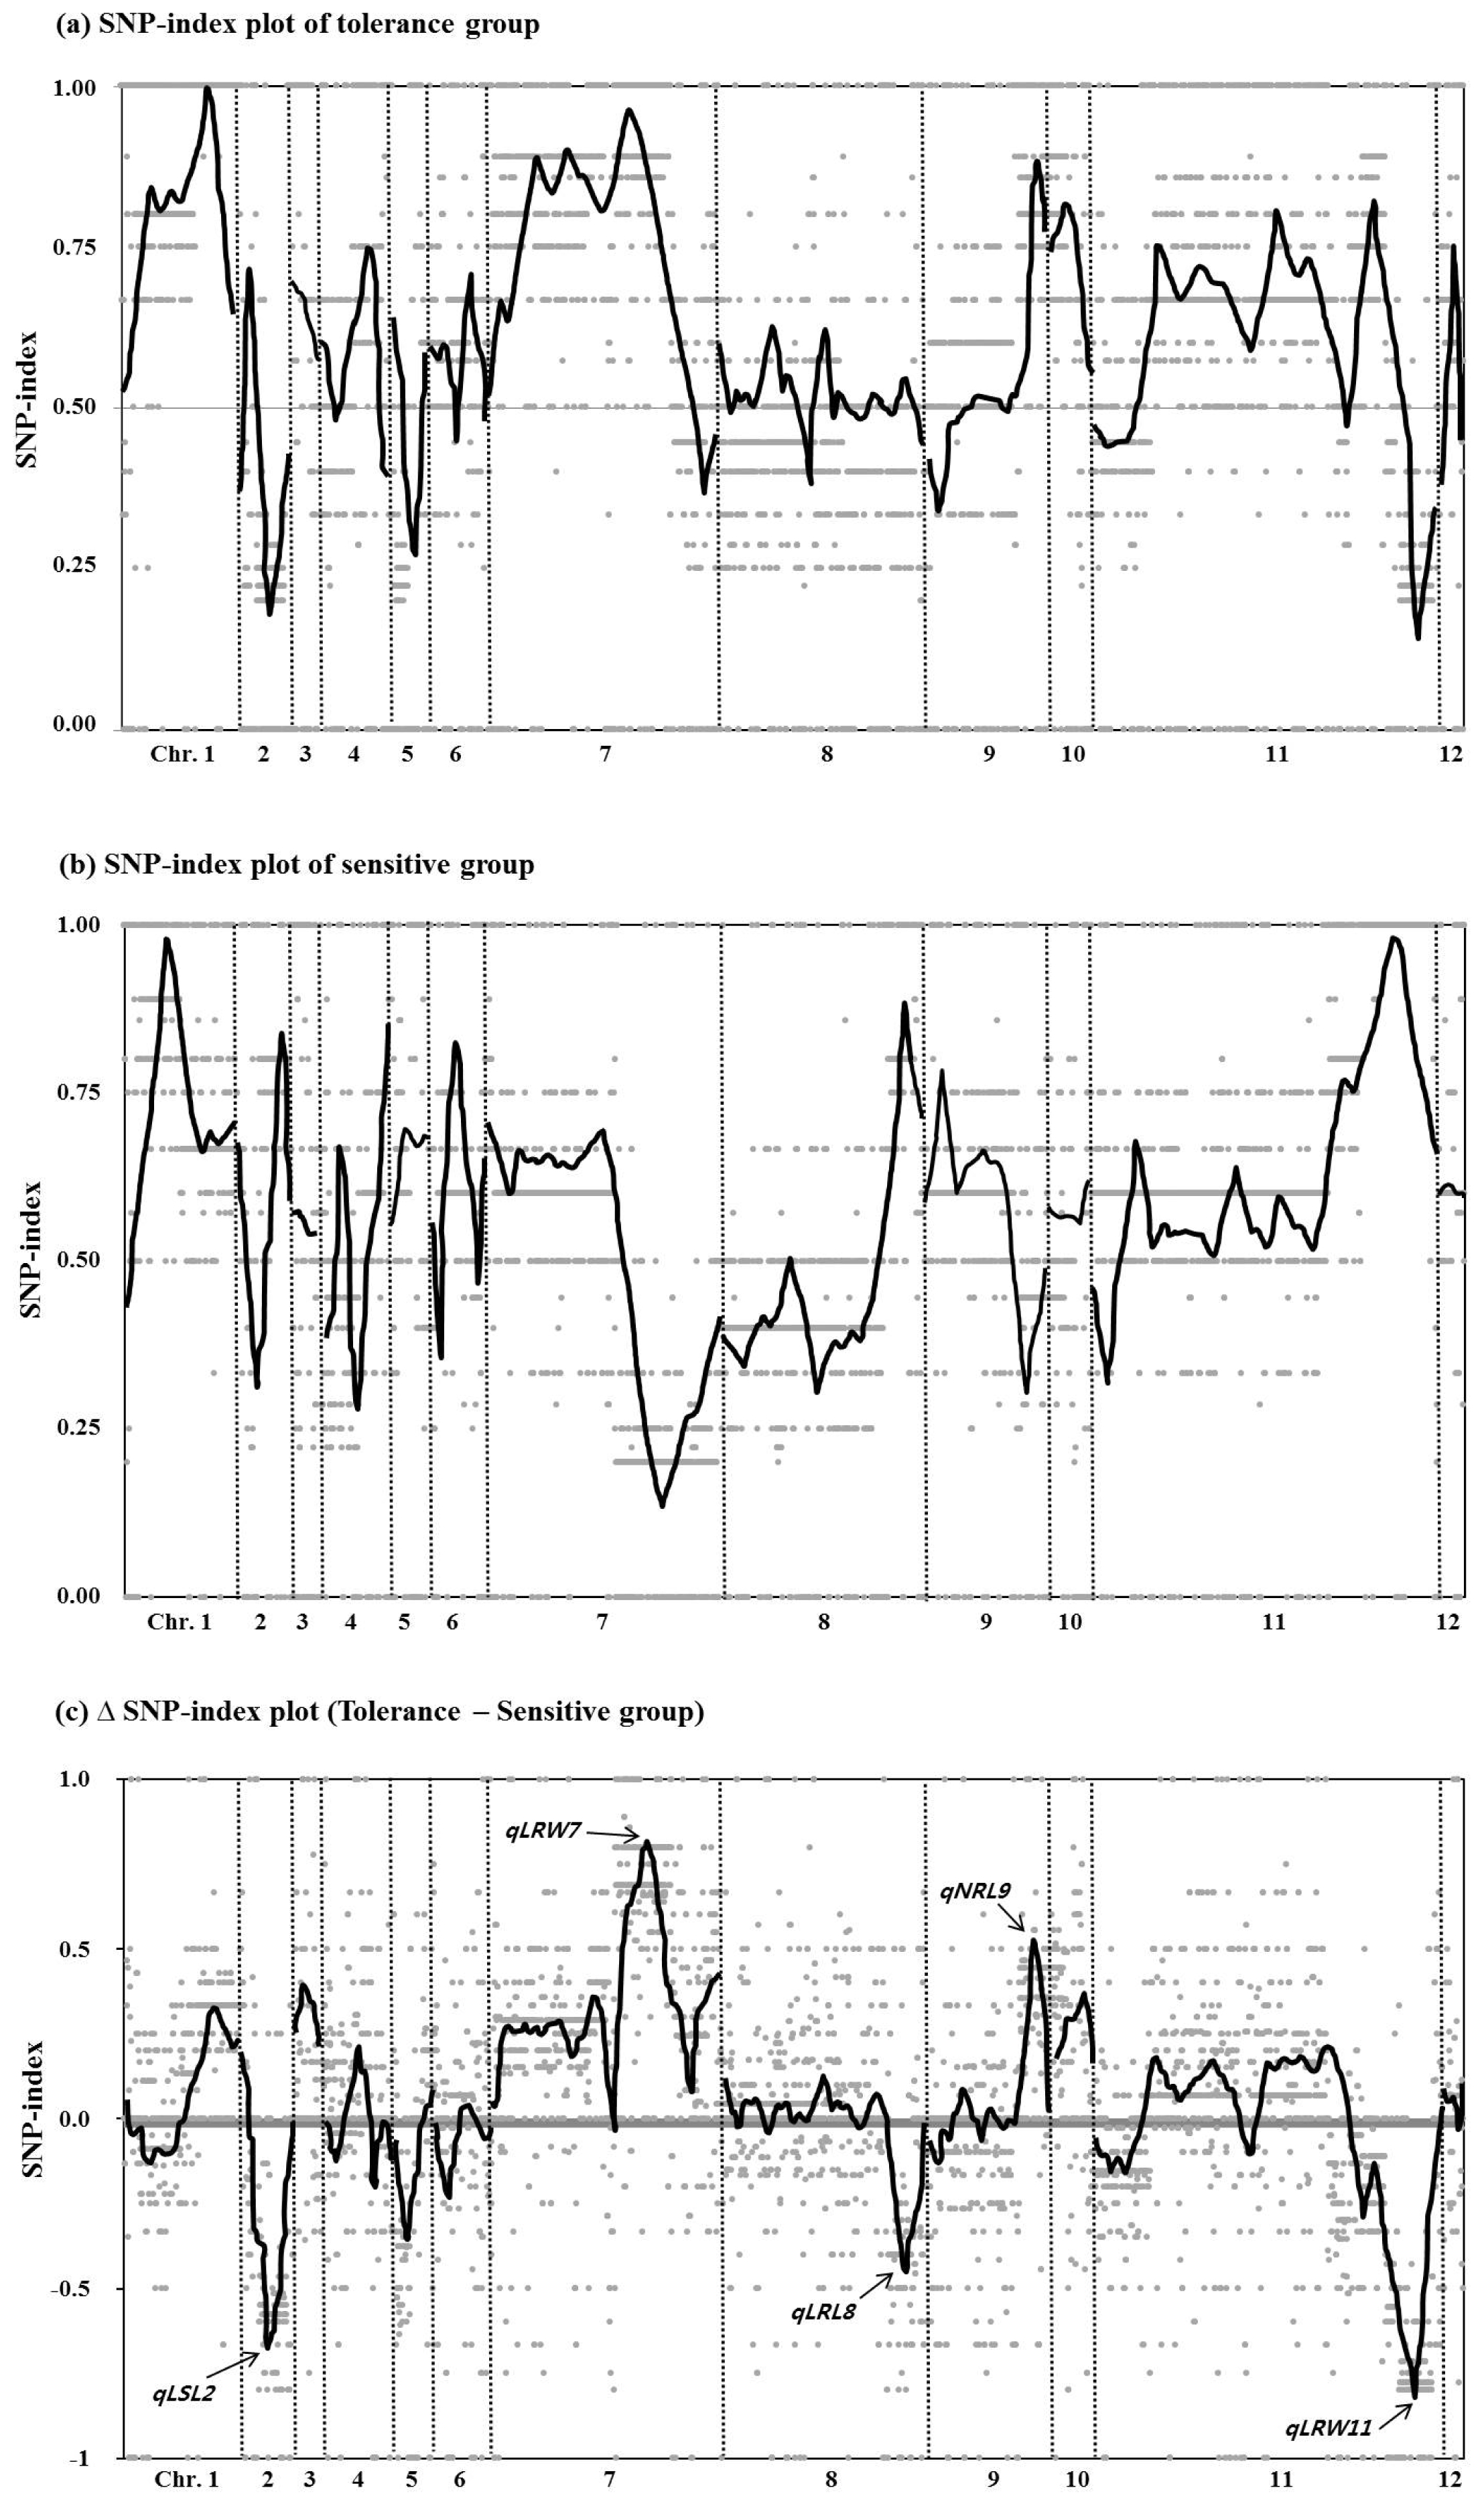
Table 1Mean values of four seedling traits of two parents and the RILs under low and normal water conditions.
Table 1
|
Condition |
Trait |
M-203 |
M-206 |
RIL population (range) |
Heritabilityz)
|
|
Low water (A) |
Shoot length (cm) |
16.4 ± 0.4*
|
15.2 ± 0.4 |
15.7 ± 1.1 (13.3–18.3) |
0.27 |
|
Root length (cm) |
25.8 ± 0.7*
|
24.1 ± 0.3 |
24.5 ± 1.3 (20.2–27.1) |
0.24 |
|
Shoot dry weight (mg) |
19.6 ± 0.4*
|
17.5 ± 1.1 |
18.0 ± 1.6 (14.5–21.3) |
0.19 |
|
Root dry weight (mg) |
12.9 ± 0.6*
|
11.1 ± 0.6 |
11.8 ± 1.3 (9.3–14.3) |
0.32 |
|
Normal water (B) |
Shoot length (cm) |
17.2 ± 0.7*
|
15.3 ± 0.3 |
16.7 ± 1.2 (13.2–19.5) |
0.48 |
|
Root length (cm) |
24.3 ± 0.5*
|
22.9 ± 0.4 |
23.6 ± 1.5 (19.6–26.8) |
0.28 |
|
Shoot dry weight (mg) |
20.6 ± 1.2*
|
18.2 ± 0.9 |
18.1 ± 2.1 (13.0–23.8) |
0.47 |
|
Root dry weight (mg) |
12.6 ± 0.5*
|
11.2 ± 0.3 |
11.0 ± 1.3 (7.5–14.3) |
0.21 |
|
Relative trait values (A/B) |
Shoot length |
0.96 ± 0.06ns
|
0.99 ± 0.04 |
0.94 ± 0.07 (0.80–1.10) |
0.07 |
|
Root length |
1.06 ± 0.01ns
|
1.05 ± 0.01 |
1.04 ± 0.08 (0.82–1.23) |
0.20 |
|
Shoot dry weigh |
0.95 ± 0.06ns
|
0.96 ± 0.02 |
1.01 ± 0.11 (0.79–1.32) |
0.30 |
|
Root dry weight |
1.02 ± 0.01ns
|
0.98 ± 0.07 |
1.08 ± 0.13 (0.88–1.47) |
0.10 |
Table 2Correlation coefficients between the traits under low and normal water conditions and relative trait values.
Table 2
|
Water condition |
Trait |
Low water condition |
Normal water condition |
Relative parameter |
|
|
|
|
SL |
RL |
SW |
RW |
SL |
RL |
SW |
RW |
SL |
RL |
SW |
RW |
|
Low |
SL |
1.000 |
|
|
|
|
|
|
|
|
|
|
|
|
RL |
0.209*
|
1.000 |
|
|
|
|
|
|
|
|
|
|
|
SW |
0.571**
|
0.144 |
1.000 |
|
|
|
|
|
|
|
|
|
|
RW |
0.385**
|
0.210*
|
0.771**
|
1.000 |
|
|
|
|
|
|
|
|
|
Normal |
SL |
0.476**
|
0.044 |
0.305**
|
0.259*
|
1.000 |
|
|
|
|
|
|
|
|
RL |
0.095 |
0.065 |
0.092 |
−0.039 |
0.233*
|
1.000 |
|
|
|
|
|
|
|
SW |
0.148 |
0.112 |
0.444**
|
0.439**
|
0.580**
|
0.257*
|
1.000 |
|
|
|
|
|
|
RW |
0.018 |
0.036 |
0.366**
|
0.469**
|
0.469**
|
0.371**
|
0.733**
|
1.000 |
|
|
|
|
|
Relative |
SL |
0.442**
|
0.144 |
0.213*
|
0.089 |
−0.575**
|
−0.149 |
−0.448**
|
−0.469**
|
1.000 |
|
|
|
|
RL |
0.055 |
0.581**
|
0.026 |
0.182 |
−0.182 |
−0.770**
|
−0.124 |
−0.268**
|
0.208*
|
1.000 |
|
|
|
SW |
0.295**
|
−0.012 |
0.342**
|
0.164 |
−0.369**
|
−0.212*
|
−0.683**
|
−0.471**
|
0.639**
|
0.157 |
1.000 |
|
|
RW |
0.306**
|
0.159 |
0.319**
|
0.417**
|
−0.252*
|
−0.417**
|
−0.344**
|
−0.600**
|
0.547**
|
0.445**
|
0.622**
|
1.000 |
Table 3Significant QTL for four seedling traits evaluated in the M-2036 RIL population.
Table 3
|
Trait |
QTL |
Chr. |
Peak marker |
Confidence interval |
Low water condition |
Normal water condition |
Relative parameters |
|
|
|
|
|
Left marker |
Right marker |
LODz)
|
Ay)
|
R2x) (%) |
Pw)
|
LOD |
A |
R2 (%) |
P
|
LOD |
A |
R2 (%) |
P
|
|
Shoot length |
qLSL1
|
1 |
S1_24101606 |
S1_24052813 |
S1_43097107 |
3.35 |
−0.04 |
8.0 |
0.044 |
|
|
|
|
|
|
|
|
|
qNSL1
|
1 |
S1_39932566 |
S1_38247294 |
S1_43228302 |
|
|
|
|
3.20 |
0.80 |
21.2 |
0.018 |
|
|
|
|
|
qRSL1
|
1 |
S1_42082248 |
S1_40834221 |
S1_43135982 |
|
|
|
|
|
|
|
|
3.02 |
−0.03 |
7.4 |
0.026 |
|
qLSL2
|
2 |
S2_24517028 |
S2_23834869 |
S2_32144289 |
3.05 |
0.59 |
25.9 |
0.003 |
|
|
|
|
|
|
|
|
|
qNSL2
|
2 |
S2_24575223 |
S2_19367199 |
S2_25397903 |
|
|
|
|
4.06 |
0.50 |
16.1 |
0.002 |
|
|
|
|
|
qNSL11
|
11 |
S11_26482711 |
S11_14193473 |
S11_27844831 |
|
|
|
|
3.50 |
0.30 |
6.2 |
0.015 |
|
|
|
|
|
qRSL11
|
11 |
S11_24673423 |
S11_14193473 |
S11_28793856 |
|
|
|
|
|
|
|
|
3.49 |
−0.02 |
6.9 |
0.039 |
|
Root length |
qNRL7
|
7 |
S7_25244794 |
S7_22156708 |
S7_28189331 |
|
|
|
|
3.44 |
0.59 |
17.1 |
0.000 |
|
|
|
|
|
qLRL8
|
8 |
S8_26387607 |
S8_21171231 |
S8_26944853 |
3.08 |
−0.30 |
7.8 |
0.030 |
|
|
|
|
|
|
|
|
|
qNRL9
|
9 |
S9_22596802 |
S9_22596799 |
S9_22596802 |
|
|
|
|
4.13 |
0.95 |
24.1 |
0.000 |
|
|
|
|
|
qRRL11
|
11 |
S11_28698774 |
S11_5902578 |
S11_28748848 |
|
|
|
|
|
|
|
|
3.06 |
−0.06 |
6.7 |
0.008 |
|
Shoot dry weight |
qLSW1
|
1 |
S1_42643699 |
S1_42400858 |
S1_42646083 |
5.20 |
0.94 |
14.7 |
0.001 |
|
|
|
|
|
|
|
|
|
qNSW6
|
6 |
S6_7360573 |
S6_7238018 |
S6_7462477 |
|
|
|
|
5.19 |
0.77 |
14.7 |
0.000 |
|
|
|
|
|
qRSW6
|
6 |
S6_7360573 |
S6_7238018 |
S6_9327713 |
|
|
|
|
|
|
|
|
3.00 |
−0.03 |
4.8 |
0.044 |
|
qNSW7
|
7 |
S7_24601228 |
S7_24594247 |
S7_24645555 |
|
|
|
|
4.65 |
1.07 |
23.1 |
0.000 |
|
|
|
|
|
qRSW7
|
7 |
S7_19504228 |
S7_19182158 |
S7_24645555 |
|
|
|
|
|
|
|
|
3.31 |
−0.08 |
26.2 |
0.001 |
|
qNSW11
|
11 |
S11_27578592 |
S11_14189582 |
S11_28693568 |
|
|
|
|
3.62 |
0.86 |
15.6 |
0.000 |
|
|
|
|
|
qRSW11
|
11 |
S11_25461823 |
S11_15237375 |
S11_27584910 |
|
|
|
|
|
|
|
|
3.03 |
−0.07 |
30.8 |
0.001 |
|
Root dry weight |
qLRW1
|
1 |
S1_42346853 |
S1_40884077 |
S1_43178019 |
3.19 |
0.72 |
27.7 |
0.000 |
|
|
|
|
|
|
|
|
|
qNRW6
|
6 |
S6_7552690 |
S6_7238018 |
S6_9878747 |
|
|
|
|
3.10 |
0.58 |
16.2 |
0.001 |
|
|
|
|
|
qLRW7
|
7 |
S7_11383540 |
S7_9441531 |
S7_16072482 |
3.92 |
−0.29 |
6.20 |
0.018 |
|
|
|
|
|
|
|
|
|
qRRW7
|
7 |
S7_19926365 |
S7_19924969 |
S7_20225390 |
|
|
|
|
|
|
|
|
3.25 |
−0.03 |
5.6 |
0.035 |
|
qLRW11
|
11 |
S11_24218850 |
S11_22470842 |
S11_27608449 |
3.39 |
0.37 |
11.1 |
0.029 |
|
|
|
|
|
|
|
|
Table 4Comparison with QTL results in this study and gene in previous studies.
Table 4
|
Trait |
QTL detected in this study |
Gene sharing close regions in previous studies |
|
|
|
QTL |
Chr. |
Peak marker |
Gene |
Position (bp) |
Locus ID |
Reference |
Character |
|
Shoot Length |
qLSL1
|
1 |
S1_24101606 |
osubp6
|
22,238,470–22,246,428 |
Os01g0550100 |
, Moon et al. 2009
|
Growth speed during seedling stage. |
|
qNSL1
|
1 |
S1_39932566 |
sd1
|
40,138,232–40,141,316 |
Os01g0883800 |
, Sasaki et al. 2002
|
Semi-dwarf. Gibberellin biosynthesis. |
|
qRSL1
|
1 |
S1_42082248 |
OsNAC6
|
40,154,843–40,157,328 |
Os01g0884300 |
, Nakashima et al. 2007
|
Drought tolerance. |
|
qLSL2
|
2 |
S2_24517028 |
ARAG1
|
27,437,826–27,438,863 |
Os02g0657000 |
, Zhao et al. 2010
|
Drought tolerance. ABA sensitivity during germination. |
|
qNSL2
|
2 |
S2_24575223 |
cpt1
|
22,466,026–22,471,133 |
Os02g0568200 |
, Haga et al. 2005
|
Root and seedling phototropism. Auxin translocation. |
|
qNSL11
|
11 |
S11_26482711 |
d-27
|
24,064,168–24,073,582 |
Os11g0587000 |
, Lin et al. 2009
|
Strigolactone biosynthesis. Auxin transport. |
|
qRSL11
|
11 |
S11_24673423 |
tld1-D
|
21,012,137–21,017,940 |
Os11g0528700 |
, Zhang et al. 2009
|
Drought tolerance, Auxin catabolism. |
|
Root Length |
qNRL7
|
7 |
S7_25244794 |
aldolase
|
27,857,887–27,860,558 |
Os07g0650600 |
, Konishi et al. 2005
|
Root length. |
|
qLRL8
|
8 |
S8_26387607 |
OsAHP1
|
27,993,412–27,997,515 |
Os08g0557700 |
, Sun et al. 2014
|
Drought tolerance, Root length. |
|
qNRL9
|
9 |
S9_22596802 |
SAUR39
|
22,397,412–22,398,103 |
Os09g0545300 |
, Kant et al. 2009
|
Root growth. Regulation of auxin level and transport. |
|
qRRL11
|
11 |
S11_28698774 |
tld1-D
|
21,012,137–21,017,940 |
Os11g0528700 |
, Zhang et al. 2009
|
Drought tolerance, Auxin catabolism. |
|
Shoot Dry Weight |
qLSW1
|
1 |
S1_42643699 |
OsNAC6
|
40,154,843–40,157,328 |
Os01g0884300 |
, Nakashima et al. 2007
|
Drought tolerance. |
|
qNSW6
|
6 |
S6_7360573 |
OsGSR1
|
8,847,044–8,847,830 |
Os06g0266800 |
, Wang et al. 2009
|
Dwaf, Primary root elongation, Gibberellin sensitivity. |
|
qRSW6
|
6 |
S6_7360573 |
Osabf2
|
5,676,158–5,681,034 |
Os06g0211200 |
, Hossain et al. 2010
|
Drought tolerance. ABA sensitivity. |
|
qNSW7
|
7 |
S7_24601228 |
OsWRKY78
|
24,314,295–24,319,767 |
Os07g0583700 |
, Zhange et al. 2011
|
Dwarfism. Cell elongation. |
|
qRSW7
|
7 |
S7_19504228 |
OSRIP18
|
22,882,458–22,883,494 |
Os07g0556800 |
, Jiang et al. 2012
|
Drought tolerance. |
|
qNSW11
|
11 |
S11_27578592 |
d-27
|
24,064,168–24,073,582 |
Os11g0587000 |
, Lin et al. 2009
|
Strigolactone biosynthesis. Auxin transport. |
|
qRSW11
|
11 |
S11_25461823 |
tld1-D
|
21,012,137–21,017,940 |
Os11g0528700 |
, Zhang et al. 2009
|
Drought tolerance, Auxin catabolism. |
|
Root Dry Weight |
qLRW1
|
1 |
S1_42346853 |
OsNAC6
|
40,154,843–40,157,328 |
Os01g0884300 |
, Nakashima et al. 2007
|
Drought tolerance. |
|
qNRW6
|
6 |
S6_7552690 |
OsGSR1
|
8,847,044–8,847,830 |
Os06g0266800 |
, Wang et al. 2009
|
Dwarf, Primary root elongation, Gibberellin sensitivity. |
|
qLRW7
|
7 |
S7_11383540 |
RePRP2
|
14,026,574–14,027,700 |
Os07g0418700 |
, Tseng et al. 2013
|
Root growth. Root cell elongation. ABA sensitivity. |
|
qRRW7
|
7 |
S7_19926365 |
OSRIP18
|
22,882,458–22,883,494 |
Os07g0556800 |
, Jiang et al. 2012
|
Drought tolerance. |
|
qLRW11
|
11 |
S11_24218850 |
tld1-D
|
21,012,137–21,017,940 |
Os11g0528700 |
, Zhang et al. 2009
|
Drought tolerance, Auxin catabolism. |
Table 5Mean values of four seedling traits under both conditions and relative trait values of two selected groups.
Table 5
|
Response to drought |
Line |
Low water conditions (A) |
Normal water conditions (B) |
Relative values (A/B) |
|
|
|
|
SL |
RL |
SW |
RW |
SL |
RL |
SW |
RW |
SL |
RL |
SW |
RW |
|
Sensitive (A) |
52 |
15.0 |
23.4 |
15.1 |
9.5 |
16.4 |
24.0 |
13.0 |
9.8 |
0.91 |
0.97 |
1.16 |
0.97 |
|
144 |
14.0 |
20.2 |
16.8 |
9.5 |
17.0 |
24.1 |
17.4 |
9.6 |
0.82 |
0.84 |
0.97 |
0.99 |
|
152 |
14.5 |
22.4 |
18.4 |
11.6 |
16.1 |
23.2 |
15.2 |
11.5 |
0.90 |
0.96 |
1.21 |
1.01 |
|
208 |
15.9 |
22.3 |
18.4 |
12.2 |
18.3 |
23.9 |
18.6 |
10.9 |
0.87 |
0.93 |
0.99 |
1.12 |
|
227 |
15.4 |
21.0 |
17.7 |
11.3 |
17.5 |
24.4 |
19.7 |
12.8 |
0.88 |
0.86 |
0.90 |
0.89 |
|
Tolerant (B) |
42 |
17.5 |
27.1 |
20.9 |
12.2 |
16.4 |
24.2 |
18.0 |
11.9 |
1.06 |
1.12 |
1.16 |
1.02 |
|
56 |
17.4 |
24.8 |
20.7 |
12.9 |
16.7 |
23.6 |
17.3 |
9.5 |
1.04 |
1.05 |
1.20 |
1.36 |
|
58 |
18.3 |
25.2 |
20.7 |
12.0 |
18.5 |
22.8 |
22.6 |
11.9 |
0.99 |
1.10 |
0.91 |
1.01 |
|
166 |
17.1 |
25.2 |
17.3 |
11.6 |
16.8 |
24.4 |
19.3 |
10.8 |
1.02 |
1.03 |
0.90 |
1.08 |
|
167 |
17.0 |
26.7 |
20.4 |
12.4 |
16.6 |
26.4 |
17.9 |
11.1 |
1.02 |
1.01 |
1.14 |
1.12 |
|
Mean |
(A) |
14.9 |
21.8 |
17.3 |
10.8 |
17.0 |
23.9 |
16.8 |
10.9 |
0.88 |
0.91 |
1.05 |
1.00 |
|
(B) |
17.5 |
25.8 |
20.0 |
12.2 |
17.0 |
24.3 |
19.0 |
11.0 |
1.03 |
1.06 |
1.06 |
1.12 |
|
t-test |
−6.27**
|
−5.40**
|
−2.99*
|
−2.33*
|
0.73ns
|
−0.54ns
|
−1.48ns
|
−0.18ns
|
−6.85**
|
−4.31**
|
−0.18ns
|
−1.63ns
|
References
- Abe A, Takagi H, Fujibe T, Aya K, Kojima M, Sakakibara H, et al. 2012. OsGA20ox1, A candidate gene for a major QTL controlling seedling vigor in rice. Theor Appl Genet. 125: 647-657.
- Ashikari M, Sasaki A, Ueguchi-Tanaka M, Itoh H, Nishimura A, Datta S, et al. 2002. Loss-of-function of a rice gibberellin biosynthesis gene, GA20 oxidase (GA20 ox-2), led to the rice “green revolution.”. Breed Sci. 52: 143-150.
- Bradbury P, Zhang Z, Kroon D, Casstevens T, Ramdoss Y, Buckler E. 2007. TASSEL: software for association mapping of complex traits in diverse samples. Bioinformatics. 23: 2633-2635.
- Causse MA, Fulton TM, Cho YG, Ahn SN, Chunwonse J, Wu K, Xiao J, et al. 1994. Saturated molecular map of the rice genome based on an interspecific backcross population. Genetics. 138: 1251-1274.
- Champoux MC, Wang G, Sarkarung S, Mackill DJ, O’Toole JC, Huang N, et al. 1995. Locating genes associated with root morphology and drought avoidance in rice via linkage to molecular markers. Theor Appl Genet. 90: 969-981.
- Chen JZ, Meng XP, Zhang Y, Xia M, Wang XP. 2008. Over-expression of OsDREB genes lead to enhanced drought tolerance in rice. Biotechnol Lett. 30: 2191-2198.
- Cho YG, Eun MY, McCouch SR, Chae YA. 1994. The semidwarf gene, sd-1, of rice (Oryza sativa L.): Molecular mapping and marker-assisted selection. Theor Appl Genet. 89: 54-59.
- Cho YG, Kang HJ, Lee JS, Lee YT, Lim SJ, Gauch H, et al. 2007. Identification of quantitative trait loci in rice for yield, yield components, and agronomic traits across years and locations. Crop Sci. 47: 2403-2417.
- Cordero-Lara KI, Kim HJ, Tai TH. 2016. Identification of seedling vigor-associated quantitative trait loci in temperate japonica rice. Plant Breed Biotech. 4: 426-440.
- Courtois B, Shen L, Petalcorin W, Carandang S, Mauleon R, Li Z. 2003. Locating QTLs controlling constitutive root traits in the rice population IAC 165 × Co39. Euphytica. 134: 335-345.
- Cui KH, Peng SB, Xing YZ, Xu CG, Yu SB, Zhang Q. 2002. Molecular dissection of seedling-vigor and associated physiological traits in rice. Theor Appl Genet. 105: 745-753.
- Dar MH, Janvry AE, Emerick K, Raitzer D, Sadoulet E. 2013. Flood-tolerant rice reduces yield variability and raises expected yield, differentially benefitting socially disadvantaged groups. Sci Rep. 3: 3315
- Farnham MW, Bjorkman T. 2011. Breeding vegetables adapted to high temperatures: A case study with broccoli. Hort Sci. 46: 1094-1097.
- Farooq M, Wahid A, Kobayashi N, Fujita D, Basra SMA. 2009. Plant drought stress: effects, mechanisms and management. Agron Sustain Dev. 29: 185-212.
- Haga K, Takano M, Neumann R, Iinoa M. 2005. The Rice COLEOPTILE PHOTOTROPISM1 gene encoding an ortholog of arabidopsis NPH3 is required for phototropism of coleoptiles and lateral translocation of auxin. Plant Cell. 17: 103-115.
- Hemamalini GS, Shashidhar HE, Hittalmani S. 2000. Molecular marker assisted tagging of morphological and physiological traits under two contrasting moisture regimes at peak vegetative stage in rice (Oryza sativa L.). Euphytica. 112: 69-78.
- Hossain MA, Lee YJ, Cho JI, Ahn CH, Lee SK, Jeon JS, et al. 2010. The bZIP transcription factor OsABF1 is an ABA responsive element binding factor that enhances abiotic stress signaling in rice. Plant Mol Biol. 72: 557-566.
- Hu S, Yang H, Zou G, Liu H, Liu G, Mei H, et al. 2007. Relationship between coleoptile length and drought resistance and their QTL mapping in rice. Rice Sci. 14: 13-20.
- Ikeda H, Kamoshita A, Manabe T. 2007. Genetic analysis of rooting ability of transplanted rice (Oryza sativa L.) under different water conditions. J Exp Bot. 58: 309-318.
- Jiang SY, Bhalla R, Ramamoorthy R, Luan HF, Venkatesh PN, Cai M, et al. 2012. Over-expression of OSRIP18 increases drought and salt tolerance in transgenic rice plants. Transgenic Res. 21: 785-795.
- Kant S, Bi YM, Zhu T, Rothstein SJ. 2009. SAUR39, a small auxin-up RNA gene, acts as a negative regulator of auxin synthesis and transport in rice. Plant Physiol. 151: 691-701.
- Kato Y, Hirotsu S, Nemoto K, Yamagishi J. 2008. Identification of QTLs controlling rice drought tolerance at seedling stage in hydroponic culture. Euphytica. 160: 423-430.
- Kavar T, Maras M, Kidric M, Sustar-Vozlic J, Meglic V. 2008. Identification of genes involved in the response of leaves of phaseolus vulgaris to drought stress. Mol Breed. 21: 159-172.
- Konishi H, Yamane H, Maeshima M, Komatsu S. 2005. Characterization of fructose-bisphosphate aldolase regulated by gibberellin in roots of rice seedling. Plant Mol Biol. 56: 839-848.
- Kwon SJ, Cho YC, Kwon SW, Oh CS, Suh JP, Shin YS, et al. 2008. QTL mapping of agronomic traits using an RIL population derived from a cross between temperate japonica cultivars in rice (Oryza sativa L.). Breed Sci. 58: 271-279.
- Leng G, Huang M. 2017. Crop yield response to climate change varies with crop spatial distribution pattern. Sci Rep. 7: 1463
- Li ZK, Yu SB, Lafitte HR, Huang N, Courtois B, Hittalmani S, et al. 2003. QTL environment interactions in rice. I. Heading date and plant height. Theor Appl Genet. 108: 141-153.
- Lin H, Wang R, Qian Q, Yan M, Meng X, Fu Z, et al. 2009. DWARF27, an iron-containing protein required for the biosynthesis of strigolactones, regulates rice tiller bud outgrowth. Plant Cell. 21: 1512-1525.
- Moncada P, Martínez CP, Borrero J, Gauch JMC, Guimaraes E, Tohme J, et al. 2001. Quantitative trait loci for yield and yield components in an Oryza sativa × Oryza rufipogon BC2F2 population evaluated in an upland environment. Theor Appl Genet. 102: 41-52.
- Moon YK, Hong JP, Cho YC, Yang SJ, An GH, Kim WT. 2009. Structure and expression of OsUBP6, an ubiquitin-specific protease 6 homolog in rice (Oryza sativa L.). Mol Cells. 28: 463-472.
- Nakashima K, Tran LS, Nguyen DV, Fujita M, Maruyama K, Todaka D, et al. 2007. Functional analysis of an AC-type transcription factor OsNAC6 involved in abiotic and biotic stress-responsive gene expression in rice. Plant J. 51: 617-630.
- Nemoto H, Suga R, Ishihara M, Okutsu Y. 1998. Deep rooted rice varieties detected through the observation of root characteristics using the trench method. Breed Sci. 48: 321-324.
- Price AH, Steele KA, Moore BJ, Barraclough PB, Clark LJ. 2000. A combined RFLP and AFLP linkage map of upland rice (Oryza sativa L.) used to identify QTLs for root-penetration ability. Theor Appl Genet. 100: 49-56.
- Price AH, Steele KA, Moore BJ, Jones RGW. 2002. Upland rice grown in soil-filled chambers and exposed to contrasting water-deficit regimes II. Mapping quantitative trait loci for root morphology and distribution. Field Crops Res. 76: 25-43.
- Prince SJ, Beena R, Gomez SM, Senthivel S, Babu RC. 2015. Mapping consistent rice (Oryza sativa L.) yield QTLs under drought stress in target rainfed environments. Rice (N Y). 8: 25
- Sasaki A, Ashikari M, Ueguchi-Tanaka M, Itoh H, Nishimura A, Swapan D, et al. 2002. A mutant gibberellin-synthesis gene in rice. Nature. 416: 701-702.
- Spielmeyer W, Ellis MH, Chandler PM. 2002. Semidwarf (sd-1), “green revolution” rice, contains a defective gibberellin 20-oxidase gene. Proc Natl Acad Sci U S A. 99: 9043-9048.
- Inc SPSS. Released 2009. PASW Statistics for Windows, Version 18.0. Chicago: SPSS Inc.
- Subbarao GV, Johansen C, Slinkard AE, Rao RCN, Saxena NP, Chauhan YS. 1995. Strategies and scope for improving drought resistance in grain legumes, Crit. Rev Plant Sci. 14: 469-523.
- Sun L, Zhang Q, Wu J, Zhang L, Jiao X, Zhang S, et al. 2014. Two rice authentic histidine phosphotransfer proteins, OsAHP1 and OsAHP2, mediate cytokinin signaling and stress responses in rice. Plant Physiol. 165: 335-345.
- Tabata M, Hirabayashi H, Takeuchi Y, Ando I, Iida Y, Ohsawa R. 2007. Mapping of quantitative trait loci for the occurrence of white-back kernels associated with high temperatures during the ripening period of rice (Oryza sativa L.). Breed Sci. 57: 47-52.
- Takagi H, Abe A, Yoshida K, Kosugi S, Natsume S, Mitsuoka , et al. 2013. QTL-seq: rapid mapping of quantitative trait loci in rice by whole genome resequencing of DNA from two bulked populations. Plant J. 74: 174-183.
- Tseng IC, Hong CY, Yu SM, Ho TH. 2013. Abscisic acid and stress-induced highly proline-rich glycoproteins regulate root growth in rice. Plant Physiol. 163: 118-134.
- Uga Y, Okuno K, Yano M. 2008. QTLs underlying natural variation in stele and xylem structures of rice root. Breed Sci. 58: 7-14.
- Venuprasad R, Shashidhar HE, Hittalmani S, Hemamalini GS. 2002. Tagging quantitative trait loci associated with grain yield and root morphological traits in rice (Oryza sativa L.) under contrasting moisture regimes. Euphytica. 128: 293-300.
- Venuprasad R, Dalid CO, Del Valle M, Zhao D, Espiritu M, Sta Cruz MT, et al. 2009. Identification and characterization of large-effect quantitative trait loci for grain yield under lowland drought stress in rice using bulk-segregant analysis. Theor Appl Genet. 120: 177-90.
- Wada T, Uchimura Y, Ogata T, Tsubone M, Matsue Y. 2006. Mapping of QTLs for physicochemical properties in Japonica rice. Breed Sci. 56: 253-260.
- Wang L, Wang Z, Xu Y, Joo S, Kim S, Xue Z, et al. 2009. OsGSR1 is involved in crosstalk between gibberellins and brassinosteroids in rice. Plant J. 57: 498-510.
- Wang N, Xiao B, Xiong L. 2011. Identification of a cluster of PR4-like genes involved in stress responses in rice. J Plant Physiol. 168: 2212-2224.
- Wang Q, Guan Y, Wu Y, Chen H, Chen F, Chu C. 2008. Overexpression of a rice OsDREB1F gene increases salt, drought, and low temperature tolerance in both Arabidopsis and rice. Plant Mol Biol. 67: 589-602.
- Xie L, Tan Z, Zhou Y, Xu R, Feng L, Xing Y, et al. 2014. Identification and fine mapping of quantitative trait loci for seed vigor in germination and seedling establishment in rice. J Integr Plant Biol. 56: 749-759.
- Xu Q, Yuan X, Yu H, Wang Y, Tang S, Wei X. 2011. Mapping QTLs for Drought Tolerance at Seedling Stage in Rice Using Doubled Haploid Population. Rice sci. 18: 23-28.
- Yang W, Yuan G, De-Lin H. 2010. Discovery of elite alleles for seed vigor traits in two populations of japonica rice in Taihu lake region. Acta Agron Sin. 36: 754-763.
- Zhang CQ, Xu Y, Lu Y, Yu HX, Gu MH, Liu QQ. 2011. The WRKY transcription factor OsWRKY78 regulates stem elongation and seed development in rice. Planta. 234: 541-554.
- Zhang SW, Li CH, Cao J, Zhang YC, Zhang SQ, Xia YF, et al. 2009. Altered architecture and enhanced drought tolerance in rice via the down-regulation of indole-3-acetic acid by TLD1/OsGH3.13 activation1. Plant Physiol. 151: 1889-1901.
- Zhang X, Cai X. 2011. Climate change impacts on global agricultural land availability. Environ Res Lett. 6: 014014
- Zhao L, Hu Y, Chong K, Wang T. 2010. ARAG1, an ABA-responsive DREB gene, plays a role in seed germination and drought tolerance of rice. Ann Bot. 105: 401-409.
- Zheng B, Yang L, Mao C, Huang Y, Wu P. 2008. Comparison of QTLs for rice seedling morphology under different water supply conditions. J Genet Genomics. 35: 473-484.