Abstract
The yield related traits are controlled by multiple quantitative trait loci (QTLs) and influenced by environmental change in rice. We analyzed QTLs for 15 yield related traits using two backcross populations, derived from crosses between IR64 as recurrent parent and Koshihikari as donor parent, through two years. A total of 67 backcross inbred lines (BILs) and 40 chromosome segment substitution lines (CSSLs) were genotyped using 183 SNP markers using a high-throughput genotyping system. Some genomic gaps between markers were identified in two populations. For fifteen traits in this study, 36 major QTLs (mQTLs) for 12 traits and 16 digenic epistatic QTLs (EpQTLs) for culm length were detected in BILs. On the other hand, 17 mQTLs were detected for nine traits in CSSLs. Among them, six mQTLs for grain yield traits were collocated on chromosome 10 in both years. For spikelet fertility, six putative QTLs were detected under high temperature conditions in 2018. The QTLs identified in this study could be used for the development of rice varieties conferring inter-subspecific combinations of yield-related traits.
-
Key words: Rice, Yield, QTL, Backcrossed inbred lines, Climate change
INTRODUCTION
…
There are two subspecies in rice,
indica and
japonica.
Indica rice is known to be adaptable in tropical conditions, and
japonica rice for temperate conditions. To improve the yield potential of
japonica rice, inter-subspecific crosses between
indica and
japonica have been conducted. One of the most historical success made in
indica-japonica crosses was the development of Tongil rice (
Kim et al. 2014). Likewise, inter-subspecific heterosis will enhance the yield potential of rice (
Dwivedi et al. 1998;
Kim et al. 2017).
In our study, the population was developed from two famous rice varieties, in tropical and temperate conditions. IR64 is one of the world’s most popular
indica rice cultivars developed by the International Rice Research Institute in the Philippines in 1985. It was cultivated on approximately a total of > 10 million ha by the end of the 20th century (
Mackill and Khush 2018). IR64 shows high yield, good grain and eating quality compared to other
indica cultivars (
Khush 1999;
Khush and Virk 2005). In addition, IR64 showed moderate heat tolerance on a two-hours exposure to high temperature during anthesis (
Jagadish et al. 2008). On the other hand, Koshihikari, Japanese short-grain
japonica rice cultivar, is famous for its good palat ability. Koshihikari was developed in 1956 in Japan. Despite its early development, Koshihikari has been the most widely grown cultivar in Japan for more than 35 years. However, Koshihikari has its weakness in abiotic and biotic stress, such as low resistance to lodging and rice blast (
Kobayashi et al. 2018).
The yield related traits of rice are generally controlled by multiple quantitative trait loci (QTLs) and influenced by environmental change. The identification of QTLs that control yield is a primary step to improve rice cultivars by integrating favorable QTL alleles into elite genetic backgrounds. Advanced backcross populations are good material for QTL analysis of various agronomic traits, and for the improvement of elite variety (
Duan et al. 2013;
Nagata et al. 2015;
Nonoue et al. 2019). Backcrossed inbred lines (BILs) are developed by two or more times of backcrossing with the parent population. By integrating BILs with small chromosome segments, chromosome substitution lines (CSSLs) can be developed (
Doi et al. 1997). Genome-wide functional study utilizing BILs and CSSLs is highly useful, and the identification of major QTLs are effective especially in inter-subspecific and specific crossing populations (
Ali et al. 2010). Several major QTLs were identified and reported as major QTLs which showed high level of additive effects in abiotic and biotic stress tolerance, as well as yield (
Ali et al. 2010). By help of high-throughput genotyping, based on single nucleotide polymorphic (SNP) markers through whole genome, the inter-subspecific and inter-specific populations can be well-characterized (Seo
et al., unpublished).
The effect of high temperature in early growth, flowering, and maturity stage is complicated, and hard to understand. Only a few studies were reported on spikelet degradation, sterility, protein denaturation and enzyme inactivation, and loss of membrane function (
Fahad et al. 2019). Only a few studies were reported on the effect and the mechanism of heat tolerance and escape in day- and night-time stress to yield and grain quality (
Jagadish et al. 2007;
Sreenivasulu et al. 2015;
Shi et al. 2017). The effect of all-day warming may cause yield decrease (
Yang et al. 2017). They reported that 11-78% of yield reduction by increasing 2℃ air temperature using an apparatus. Although the effect of temperature increase in rice seems clear, it is difficult to dissect the responsible genes due to the complex chromosomal structure and genetic networks. There is a report on the genes coding 1,037 potential transcripts identified within 10 QTLs for heat stress tolerance in the vegetative stage (
Kilasi et al. 2018). Furthermore, genes originating from
indica/japonica would provide a different additive effect in different temperature condition.
There is a lack of qualitative and quantitative studies on the response of rice production under climate change. The IPCC (Intergovernmental Panel on Climate Change) reported the need for more detailed information on climate change in the local scale (
IPCC 2007). In 2018, the highest-ever temperature of 40.7℃ was reported between late July-early August in Korea. The estimated 10-year mean temperature increase in rural area was 0.18℃ in Korea (
Park et al. 2017). It is highly difficult to identify QTLs for high temperature conditions in the rice paddy field. There is no study on the QTLs for higher temperatures in the rice fields of Korea. Thus, we have investigated yield and yield-related traits originated from tropical
indica (IR64) and temperate japonica (Koshihikari), using two backcrossed populations in two years, which showed different peak temperature in flowering times.
MATERIALS AND METHODS
Plant materials
A total of 67 BC
1F
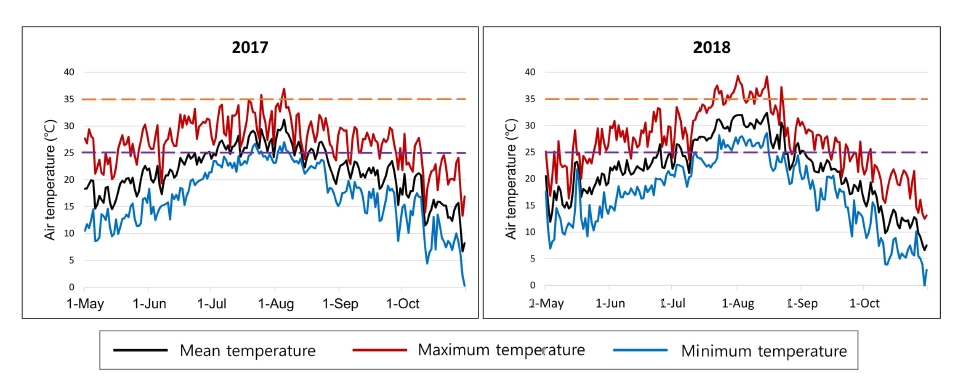
8 BILs derived from a backcross of IR64/Koshihikari//IR64 were developed and maintained in the Crop Molecular Breeding Lab., Seoul National University. A population of 40 CSSLs with Koshihikari as the donor under IR64 genetic background were kindly provided from Rice Genome Resource Center (RGRC), National Institute of Agrobiological Sciences (NIAS), Japan. The SL2119 line, which showed extremely late heading (late October in Suwon, Korea) among CSSLs, was excluded in phenotyping and QTL analysis. All plants of two populations and two parents were grown by conventional cultural practices at the paddy field within the experimental farm of Seoul National University, Suwon, Korea in 2017 and 2018. All seeds of plants were sown in a plastic-tunnel on 28 April 2017 and 27 April 2018, respectively. All seedlings were transplanted into the paddy field on 3 June 2017 and 2 June 2017, at one seedling per hill at a planting density of 30 × 15 cm. Daily mean, maximum and minimum air temperatures at Suwon during the rice growing season in 2017 and 2018 are shown in
Fig. 1. Data were downloaded from the Korea Meteorological Administration (
https://data.kma.go.kr/).
At maturity, six plants from each line were harvested and selected for phenotyping in the field. They were measured and scored for the 15 yield-related traits in 2017 and 2018. Days to heading (DTH) was determined as the number of days from sowing to the date when half of the panicles in each line had emerged. Culm length (CL) and panicle length (PL) were measured in centimeter (cm), from soil surface to panicle neck of the tallest tiller and from the panicle neck to panicle tip, respectively. Panicle number per plant (PN) was counted on field before harvest. Panicle weight (PW) were measured in grams using an electronic scale. Spikelet number per panicle (SN), unfilled spikelet number per panicle (USN) and grain number per panicle (GN) were counted as number of total spikelets, unfilled spikelets and filled grains per panicle, respectively. Spikelet fertility (SF) was calculated as filled grains per total spikelet. 1000 grains weight (TGW) was measured in grams of the weight of 100 fully ripened grains (14% moisture). Grain yield per plant (GY), straw yield per plant (SY) and dry weight per plant (DW, sum of GY and SY) were measured after harvest. Harvest index (HI) and grain straw ration (GSR) were calculated as the ratio of GY to DW and GY to SY, respectively.
DNA extraction and Fluidigm genotyping
Young leaves from each of the plants of the two populations were collected for DNA extraction at the tillering stage. Genomic DNA was extracted using the modified cetyltrimethylammonium bromide (CTAB) method as described by
Murray and Thompson (1980). A total 196 SNP markers were used in this study. Two 96-plex
indica/ japonica SNP sets were developed based on polymorphism between
indica and
japonica in the Crop Molecular Breeding Lab., Seoul National University (unpublished). Additionally, specific SNP markers were developed in thus study for four yield related genes, such as
GRF4 (Os02g0701300),
GIF1 (OS03g0733600),
NAL1 (Os04g0615000) and
Ghd7 (OS07g0261200) (
Supplementary Table S1).
Genotyping was performed using the BioMarkTM HD system (Fluidigm, San Francisco, CA, USA) and 96.96 Dynamic Array IFCs (Fluidigm, San Francisco, CA, USA) according to the manufacturer’s protocol in NICEM (National Instrumentation Center for Environmental Management), Seoul National University (Pyeongchang, Korea). Specific target amplification (STA) was performed prior to SNP genotyping analysis. For genotyping, SNPtype assays were performed using STA products, following the manufacturer’s protocol. The genotyping result was acquired using Fluidigm SNP Genotyping Analysis software. All genotype calling results were manually checked and any obvious errors in homozygous or heterozygous clusters were curated.
Linkage map construction and QTL analysis
Linkage map construction and QTL analysis of BILs were conducted using QTL IciMapping 4.1 software (
Meng et al. 2015). First, the BIN functionality (binning of redundant markers) was used to delete redundant markers. The output file generated in the binning step was used for linkage map construction with the MAP functionality (linkage map construction). The Kosambi mapping function was used to calculate genetic distances in centimorgans (cM) (
Kosambi 1944). Segregation distortion analysis was conducted using the SDL functionality (segregation distortion locus mapping), using default settings.
QTL mapping of BILs was carried out using the BIP functionality (QTL mapping in biparental populations). The inclusive composite interval mapping of additive (ICIM-ADD) QTL method was used to detect additive QTLs by using default settings. The significant LOD threshold was calculated for each QTL using 1000 permutations at P = 0.05. The inclusive composite interval mapping of digenic epistatic (ICIM-EPI) QTL method was performed to find digenic epistatic QTLs by using default settings. The significant LOD threshold was estimated by 1000 permutations at P = 0.05. QTL mapping of CSSLs was conducted using the CSL functionality (QTL mapping in CSS lines) of QTL IciMapping 4.1 with the default setting. The single marker analysis (SMA) method was carried out with the manual LOD threshold = 2.5.
RESULTS
Evaluation of 15 yield related traits
A total 15 yield related traits were evaluated for BILs and CSSLs in 2017 and 2018. IR64 showed difference from Koshihikari in ten traits in 2017, and seven traits in 2018 (
Table 1). For yield-related traits, IR64 showed significantly larger values than Koshikari, except for CL and SF in 2017. This implies that IR64 has a higher yield performance than Koshihikari in Korea. The phenotypic performance of the parental varieties showed a difference between the two years. This suggests that environmental differences of the two years influenced these traits. As shown in
Fig. 1, the duration of high temperature in the field was longer in July and August (27 days in 2018 vs. 6 days in 2017 over 34℃). 15 traits, including SF, showed various coefficient variation (CV) for two populations in two years. USN showed the largest CV in the two populations through two years. The DTH of CSSLs showed the smallest variation in two years (
Table 1).
In BILs, there were significant positive correlations in all 13 paired traits between the two years, except for DTH and PW (
Supplementary Table S2). On the other hand, there was no significant correlation between the two years for GY, SY and DW in CSSLs (
Supplementary Table S3).
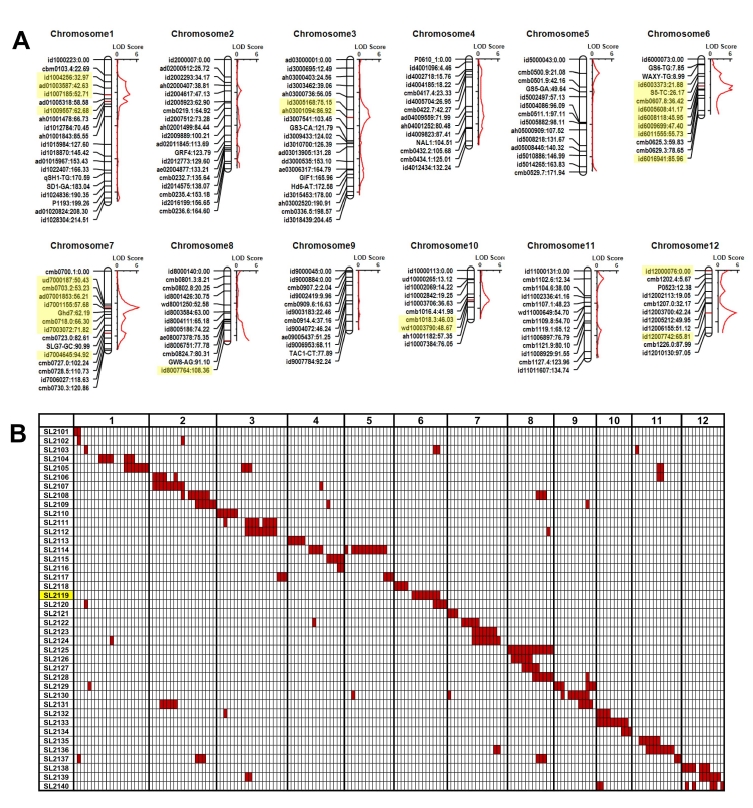
A total of 183 SNPs (93.4%) out of 196 SNPs in the genotyping system showed polymorphism between IR64 and Koshihikari. Thus, only the polymorphic SNPs were used for scoring. Followed by the binning, the linkage map of BILs using 174 polymorphic was constructed. The length of the linkage map of BILs was 1,603 cM, with 9.9 cM of average genetic distance between each adjacent marker. On the other hand, 26 SNPs by single marker analysis and 10 intervals by interval mapping on chromosome 1, 3, 6, 7, 10, and 12 showed significant segregation distortion. All the markers and the chromosomal regions of segregation distortion favored the IR64 allele (
Fig. 2A). The graphical genotype of 40 CSSLs based on 183 SNPs are presented in
Fig. 2B.
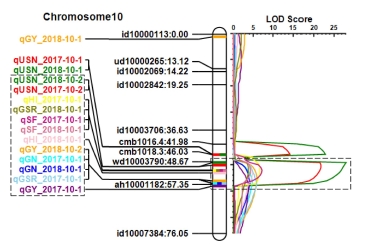
A total of 36 major QTLs (mQTLs) for the twelve yield-related traits were identified in BILs (
Table 2). There was no significant additive effect shown in the QTLs for PL, SY and DW traits. However, eleven QTLs for the eight traits, such as CL, USN, GN, SF, TGW, GY, HI, and GSR, were detected in the two years. Notably, QTL for the grain yield traits clustered on chromosome 10 were identified in the both years. The region contains
qUSN10.2,
qGN10,
qGY10,
qSF10,
qHI10, and
qGSR10 (
Fig. 3). The Koshihikari allele of the QTLs in this region showed decreased grain number per panicle and spikelet fertility, and consequently decreased grain yield, harvest index and grain straw ratio in the IR64 background. Whereas, 25 mQTLs for nine yield related traits were identified in only one year. They are influenced by the environmental factors to phenotypic difference. 16 digenic epistatic QTLs were detected only for CL (
Supplementary Table S4). Six digenic epistatic QTLs (EpQTLs) for CL are linked to the
qCL7.
A total of 17 mQTLs were detected for nine yield-related traits in CSSLs. All the QTLs were identified only in a year, except for CL on chromosome 1 (
Table 3).
DISCUSSION
In the
indica-japonica crossing population in rice, a high degree of segregation distortion is observed on many chromosomal regions (
Reflinur et al. 2014). Due to the lack of statistical power to calculate the recombination frequency of the population, there are several big gaps in the linkage maps of BILs. In this study, BILs showed significant segregation distortion on 26 regions (14.2% of total polymorphic markers) linked to SNP markers (
Fig. 2A). The high frequency of IR64 (
indica) alleles in those loci were observed in BILs. It was even more serious in CSSLs. There is no CSSL which contained Koshihikari alleles on 19 SNPs (10.4%) (
Fig. 2B). For this reason, the comparison of the effects of
indica- and
japonica-alleles in the loci were limited. There were five common loci on chromosomes 1, 3, 6, and 7, showing segregation distortion in the two populations. For instance, ah03001094 located on the short arm of chromosome 3 showed significant segregation distortion in BILs. Besides, the
S5 gene functional SNP marker (S5-TC) showed significant segregation distortion toward IR64 allele in BILs. Thus, no Koshihikari allele was detected for S5-TC in all the CSSLs. The
S5 gene controls the
japonica allele embryo sac abortion in
indica-japonica F
1 hybrids (
Chen et al. 2008;
Yang et al. 2012). In general, the embryo sac is more viable than pollen in
indica-japonica F
1 hybrids. Therefore, F
1 hybrids have been used as the maternal parent in
indica-japonica backcross to achieve more fertile descendants. For this reason, the two populations used in this study have been developed by using F
1 plants as maternal parents. In addition, late heading in
indica-japonica hybrid was one of the factors for the segregation distortion in BILs. The regions showing segregation distortion in BILs were on Chromosomes 6 and 7 containing
Hd1 (
Yano et al. 2000) and
Ghd7 (
Xue et al. 2008), respectively. One CSSL, SL2119, containing the Koshihikari allele of
Hd1 on chromosome 6 exhibited extremely late heading. The mQTLs for yield-related traits on chromosome 10 was linked with segregation distortion (
Fig. 2A, 3). Thus, the QTLs for spikelet fertility which mainly caused low yielding were identified in the two years.
In this study, a total of 36 mQTLs for the twelve yield-related traits and 16 EpQTLs for CL were detected in BILs (
Table 2,
Supplementary Table S4). Almost all the QTLs identified in this study were previously reported in several studies (
Yonemaru et al. 2010;
Ujiie et al. 2015;
Nonoue et al. 2019;
https://archive.gramene.org/qtl/). For example,
qDTH3 in the I-06 line performed similar effect compared to the same chromosomal region in our study (
Nonoue et al. 2019).
qCL1.2 containing the SD1-GA marker linked with the
sd1 gene (
Sasaki et al. 2002) performed more than 24% of the phenotypic variation explained (PVE) in two years of this study. However, almost all the QTLs in this study were identified only in one year, which implies the significant effect of the environmental difference between the years.
In Korea, we had a hotter July and August in 2018, than in 2017 (
Fig. 1). In terms of mean temperature, it was the second hottest months since 1964, in Suwon. Furthermore, the maximum temperature of the 1
st of August in 2018 was 39.3℃, which was the highest in Suwon since 1964 (Korea Meteorological Administration,
https://data.kma.go.kr/). In rice, temperature increase could be somehow beneficial to the genes originating from the tropical region. However, high temperatures over 39℃ gave negative effects to grain fertility and maturity, etc. (
Jagadish et al. 2008;
Kilasi et al. 2018;
Li et al. 2018). The effect of the high temperature might be different to
japonica- and
indica-alleles. IR64 showed higher fertility, but Koshihari did not in 2018 (
Fig. 4A). Likewise, the average of SF of CSSLs showed higher fertility, because of the high genetic similarity of CSSLs to IR64. On the other hand, we have checked the allelic association with SF on the
qSF10 from BILs (
Fig. 4B). Interestingly, one CSSL line, SL2133, containing the
qSF10 region showed lower SF and GY in 2017, as expected (
Fig. 4B, C). However, the CSSL which contains only a single chromosomal segment may not explain the association of the complicated traits if many QTLs are interacting. In 2018, a total of seven QTLs for SF, including
qSF10, were reported in BILs. The seven QTLs showed that they might have more complicated interactions under the higher temperature (
Table 2,
Fig. 5). On the contrary, the SF was controlled by only two mQTLs,
qSF1.1 and
qSF10, in 2017. Thus, the effect of
qSF10 in the corresponding CSSL was more obvious (
Fig. 4B).
In conclusion, using the identified QTLs in indica-japonica backcrossed populations, some QTLs for yield and yield-related traits might be improved. Out of 36 major QTLs, six QTLs for yield and yield-related traits in 2018 could be considered for use in higher temperature conditions in the field systems in temperate regions. However, further studies are needed by characterizing each QTL, followed by the molecular physiological studies under the better controlled conditions. The genetic network conferring beneficial effects to the higher temperature will provide the opportunity to develop promising breeding lines for dealing with climate change.
Supplementary Information
ACKNOWLEDGEMENTS
This study was supported by a grant from the Next-Generation BioGreen 21 Program (No. PJ01319603) of the Rural Development Administration, Korea. We thank to Dr. Hong-Yeol Kim for field management and Mrs. Jeehyoung Shim for assistance in phenotyping.
Fig. 1Mean (black lines), maximum (red lines) and minimum air temperature (blue lines) in Suwon during rice growing season in 2017 and 2018. The orange and purple broken lines represent 35℃ and 25℃, respectively.

Fig. 2Molecular linkage map of BILs and graphical genotype of CSSLs. (A) Linkage map and of BILs. The names and genetic positions of SNP markers are on the left side of each chromosome. The LOD graph for segregation distortion based on interval mapping is on the right side of each chromosome. The significantly distorted markers were highlighted yellow. The red horizontal bars on chromosome indicate the segregation distortion loci. (B) The chromosomal location of the introgression blocks from Koshihikari (japonica) in the 40 IR64/Koshihikari CSSLs. The red blocks represent Koshihikari alleles. The SL2119 line which showed very late heading is highlighted by yellow.

Fig. 3The collocation of the yield-related QTLs on chromosome 10. Dotted line boxes indicate cluster region of the QTLs.

Fig. 4Comparison of spikelet fertility and grain yield between 2017 and 2018. (A) Comparison of IR64, Koshihikari, CSSLs, and BILs for spikelet fertility. (B) Comparison of BILs possessing the IR64 allele for qSF10 (qSF-IR), BILs possessing Koshihikari allele for qSF10 (qSF10-KO), 38 CSSLs except SL2113, and SL2113 which possesses the Koshihikari allele of qSF10. (C) Comparison of BILs possessing the IR64 allele for qGY10 (qGY10-IR), BILs possessing Koshihikari allele for qGY10 (qGY10-KO), 38 CSSLs except SL2113, and SL2113 which possesses the Koshihikari allele of qGY10. Significance was determined by t-test. *, * and *** indicate significance in 0.05, 0.01 and 0.001 probability levels, respectively. ns represents not significant.
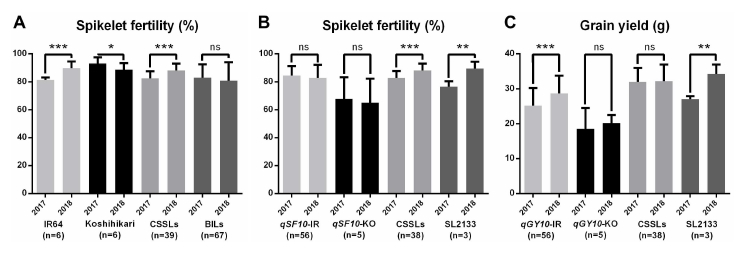
Fig. 5LOD values of eight QTLs for spikelet fertility in the IR64/Koshihikari BILs.
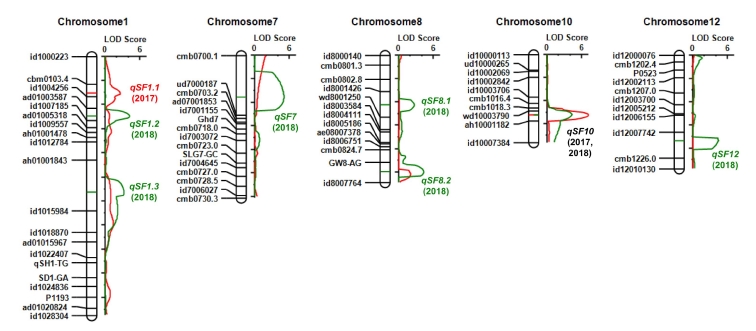
Table 1Phenotype performance of IR64, Koshihikari, BILs and CSSLs in 2017 and 2018.
Table 1
|
Traits |
Year |
IR64 |
Koshihikari |
BILs |
CSSL |
|
|
|
|
Mean ± SDz)
|
Mean ± SD |
Range |
Mean ± SD |
CVy) % |
Range |
Mean ± SD |
CV% |
|
DTH |
2017 |
113.2 ± 1.2***x)
|
100.4 ± 1.8 |
N/Aw)
|
105.0-119.0 |
111.1 ± 2.7 |
2.4% |
|
2018 |
112.9 ± 1.5*** |
100.1 ± 2.0 |
99-123.5 |
108.3 ± 4.9 |
4.5% |
106.0-118.0 |
111.4 ± 3.0 |
2.7% |
|
CL (cm) |
2017 |
82.6 ± 3.6*** |
88.9 ± 1.9 |
61-135.3 |
90.5 ± 16.2 |
17.9% |
62.1-118.7 |
80.1 ± 10.4 |
13.0% |
|
2018 |
78.6 ± 2.9 ns |
79.4 ± 5.2 |
58.3-136.2 |
86.4 ± 16.2 |
18.8% |
62.0-111.0 |
74.3 ± 8.6 |
11.6% |
|
PL (cm) |
2017 |
26.7 ± 1.3*** |
19.5 ± 1.1 |
21.3-32.7 |
26.3 ± 2.6 |
9.9% |
23.5-29.4 |
26.5 ± 1.4 |
5.3% |
|
2018 |
26.1 ± 1.1*** |
20.1 ± 1.7 |
21.2-32.8 |
26 ± 2.5 |
9.6% |
23.2-28.5 |
25.8 ± 1.2 |
4.5% |
|
PW (g) |
2017 |
3.4 ± 0.4** |
3.0 ± 0.3 |
1.7-5.3 |
3.5 ± 0.6 |
18.5% |
2.5-4.5 |
3.2 ± 0.5 |
14.6% |
|
2018 |
N/A |
N/A |
N/A |
|
PN |
2017 |
12.3 ± 2.4 ns |
12.1 ± 2.1 |
6.3-12 |
8.9 ± 1.5 |
17.0% |
8.0-15.3 |
12.0 ± 1.5 |
12.8% |
|
2018 |
13.0 ± 2.4*** |
9.7 ± 1.9 |
7.5-16.2 |
11.1 ± 1.9 |
17.0% |
10.2-18.7 |
13.0 ± 2.0 |
15.2% |
|
SN |
2017 |
136.1 ± 16.3* |
122.2 ± 17.7 |
110.9-217.1 |
156.2 ± 24.6 |
15.7% |
111.2-191.3 |
135.3 ± 19.2 |
14.2% |
|
2018 |
135.7 ± 18.2 ns |
135.5 ± 14.0 |
105.8-224 |
150 ± 25.7 |
17.1% |
105.7-178.2 |
138.2 ± 18.2 |
13.2% |
|
USN |
2017 |
25.4 ± 4.5*** |
8.8 ± 6.3 |
5.1-91.8 |
26.1 ± 14.2 |
54.3% |
10.0-36.4 |
23.4 ± 7.0 |
29.9% |
|
2018 |
13.8 ± 6.3 ns |
15.5 ± 6.8 |
8.2-122.2 |
28.8 ± 20.4 |
71.0% |
3.8-36.7 |
16.2 ± 6.5 |
40.1% |
|
GN |
2017 |
110.7 ± 12.6 ns |
113.4 ± 15.5 |
63.1-200.4 |
130.1 ± 26.4 |
20.3% |
78.9-157.4 |
111.9 ± 18.4 |
16.5% |
|
2018 |
122.0 ± 18.1 ns |
120.1 ± 12.0 |
29.3-200.3 |
121.6 ± 29.7 |
24.5% |
88.3-164.5 |
122.0 ± 18.5 |
15.1% |
|
SF (%) |
2017 |
81.4 ± 1.8*** |
93.0 ± 4.5 |
47.9-95.9 |
83.1 ± 9.4 |
11.4% |
70.7-93.4 |
82.5 ± 5.1 |
6.2% |
|
2018 |
89.8 ± 4.6 ns |
88.7 ± 4.5 |
20.1-94.3 |
80.8 ± 13.2 |
16.3% |
77.8-97.1 |
88.2 ± 4.7 |
5.3% |
|
TGW (g) |
2017 |
28 ± 0.2* |
27 ± 0.1 |
19-30 |
25 ± 0.3 |
11.0% |
24-29 |
27 ± 0.1 |
4.9% |
|
2018 |
25 ± 0.2 ns |
25 ± 0.1 |
18-27 |
23 ± 0.2 |
10.0% |
21-26 |
24 ± 0.1 |
4.7% |
|
GY (g) |
2017 |
33.7 ± 6.0 ns |
28.2 ± 4.8 |
9.9-35.7 |
24.3 ± 5.4 |
22.2% |
26.5-41.7 |
31.8 ± 4.0 |
12.6% |
|
2018 |
34.4 ± 6.7*** |
24.8 ± 4.7 |
15.5-38.1 |
27.6 ± 5.6 |
20.2% |
24.9-46.8 |
32.3 ± 4.6 |
14.3% |
|
SY (g) |
2017 |
24.2 ± 7.9 ns |
22.1 ± 3.3 |
9.6-29.8 |
16.0 ± 4.8 |
30.1% |
17.5-31.1 |
23.0 ± 3.3 |
14.3% |
|
2018 |
23.1 ± 5.2 ns |
21.4 ± 4.8 |
14.4-42.8 |
22.0 ± 5.5 |
25.0% |
10.4-27.6 |
21.1 ± 3.3 |
15.7% |
|
DW (g) |
2017 |
57.9 ± 16.3 ns |
50.3 ± 0.8 |
23.0-56.5 |
40.4 ± 7.6 |
18.8% |
44.6-68.0 |
54.8 ± 5.8 |
10.5% |
|
2018 |
57.5 ± 11.3*** |
46.1 ± 9.0 |
36.8-63.7 |
49.6 ± 6.7 |
13.5% |
44.9-74.5 |
53.8 ± 6.4 |
11.8% |
|
HI |
2017 |
0.58 ± 0.03* |
0.56 ± 0.02 |
0.27-0.67 |
0.60 ± 0.09 |
14.0% |
0.51-0.68 |
0.58 ± 0.04 |
6.9% |
|
2018 |
0.60 ± 0.04*** |
0.54 ± 0.03 |
0.29-0.70 |
0.56 ± 0.09 |
15.3% |
0.55-0.66 |
0.60 ± 0.03 |
5.3% |
|
GSR |
2017 |
1.4 ± 0.1* |
1.3 ± 0.1 |
0.4-2.6 |
1.6 ± 0.5 |
29.9% |
1.0-2.1 |
1.4 ± 0.2 |
17.0% |
|
2018 |
1.5 ± 0.2*** |
1.2 ± 0.2 |
0.4-2.3 |
1.4 ± 0.4 |
30.9% |
1.2-1.9 |
1.5 ± 0.1 |
13.6% |
Table 2Major QTLs for yield related traits detected in BILs.
Table 2
|
Traits |
QTL |
Chr. |
Positionz)
|
Left marker |
Right marker |
LOD |
|
PVE (%) |
|
Additive effecty)
|
|
|
|
|
2017 |
2018 |
2017 |
2018 |
2017 |
2018 |
|
DTH |
qDTH3
|
3 |
178 |
id3015453 |
ah03002520 |
|
5.26 |
|
15.99 |
|
‒4.01 |
|
qDTH10
|
10 |
70 |
ah10001182 |
id10007384 |
3.76 |
19.07 |
3.47 |
|
CL |
qCL1.1
|
1 |
180 |
qSH1-TG |
SD1-GA |
11.94 |
23.68 |
15.01 |
|
qCL1.2
|
1 |
185 |
SD1-GA |
id1024836 |
14.3 |
10.73 |
23.95 |
44.8 |
15.18 |
12.82 |
|
qCL7
|
7 |
38 |
cmb0700.1 |
ud7000187 |
3.09 |
7.71 |
13.51 |
|
PW |
qPW4
|
4 |
132 |
cmb0434.1 |
id4012434 |
3.26 |
13.25 |
0.27 |
|
qPW6
|
6 |
60 |
cmb0625.3 |
cmb0629.3 |
5.08 |
22.16 |
‒0.48 |
|
qPW10
|
10 |
57 |
wd10003790 |
ah10001182 |
3.63 |
15.35 |
‒0.35 |
|
PN |
qPN5
|
5 |
64 |
id5002497 |
id5004086 |
3.44 |
19.83 |
1.11 |
|
SN |
qSN3
|
3 |
166 |
GIF1 |
Hd6-AT |
5.53 |
23.62 |
17.94 |
|
qSN4
|
4 |
104 |
id4009823 |
NAL1 |
4.89 |
26.08 |
17.97 |
|
USN |
qUSN3.1
|
3 |
165 |
ae03006317 |
GIF1 |
7.73 |
3.51 |
‒17.68 |
|
qUSN3.2
|
3 |
177 |
Hd6-AT |
id3015453 |
14.56 |
8.61 |
26.51 |
|
qUSN10.1
|
10 |
46 |
cmb1016.4 |
cmb1018.3 |
14.13 |
22.82 |
13.48 |
18.79 |
‒26.45 |
‒50.49 |
|
qUSN10.2
|
10 |
50/49 |
wd10003790 |
ah10001182 |
21.77 |
28.01 |
27.3 |
29.22 |
32.37 |
57.95 |
|
GN |
qGN3
|
3 |
166 |
GIF1 |
Hd6-AT |
3.92 |
12.24 |
13.53 |
|
qGN4.1
|
4 |
74 |
ad04009559 |
ah04001252 |
3.67 |
17.58 |
19.72 |
|
qGN4.2
|
4 |
131 |
cmb0434.1 |
id4012434 |
4.43 |
14.93 |
12.39 |
|
qGN6
|
6 |
60 |
cmb0625.3 |
cmb0629.3 |
5.67 |
19.01 |
‒18.77 |
|
qGN10
|
10 |
57 |
wd10003790 |
ah10001182 |
4.65 |
4.09 |
15.43 |
18.18 |
‒14.69 |
‒19.39 |
|
SF |
qSF1.1
|
1 |
30 |
cbm0103.4 |
id1004256 |
2.59 |
9.28 |
‒7.37 |
|
qSF1.2
|
1 |
49 |
ad01003587 |
id1007185 |
4.2 |
6.17 |
‒20.16 |
|
qSF1.3
|
1 |
112 |
ah01001843 |
id1015984 |
3.23 |
6.8 |
‒17.80 |
|
qSF7
|
7 |
35 |
cmb0700.1 |
ud7000187 |
5.03 |
6.75 |
‒18.48 |
|
qSF8.1
|
8 |
42 |
id8001426 |
wd8001250 |
2.68 |
6.24 |
‒16.46 |
|
qSF8.2
|
8 |
99 |
GW8-AG |
id8007764 |
4.31 |
6.29 |
‒19.88 |
|
qSF10
|
10 |
52 |
wd10003790 |
ah10001182 |
7.12 |
4.28 |
21.45 |
4.09 |
‒13.91 |
‒12.94 |
|
qSF12
|
12 |
73 |
id12007742 |
cmb1226.0 |
4.38 |
6.14 |
‒22.40 |
|
TGW |
q100GW3
|
3 |
160/166 |
dd3000535 |
Hd6-AT |
5.09 |
4.44 |
25 |
23.72 |
‒1.9 |
‒1.6 |
|
q100GW4
|
4 |
42/40 |
id4005704 |
cmb0422.7 |
4.03 |
4.35 |
19.39 |
23.5 |
‒0.15 |
‒0.15 |
|
GY |
qGY1
|
1 |
137/140 |
id1015984 |
id1018870 |
3.39 |
3.12 |
16.58 |
11.38 |
‒2.49 |
‒2.11 |
|
qGY5
|
5 |
42 |
cmb0500.9 |
cmb0501.9 |
6.28 |
21.08 |
2.89 |
|
qGY6
|
6 |
60 |
cmb0625.3 |
cmb0629.3 |
4.23 |
17.63 |
‒3.72 |
|
qGY10
|
10 |
58/56 |
wd10003790 |
id10007384 |
3.83 |
5.92 |
16.09 |
20.96 |
‒3.03 |
‒3.73 |
|
HI |
qHI10
|
10 |
52/53 |
wd10003790 |
ah10001182 |
6.67 |
4.77 |
30.56 |
24.34 |
‒0.08 |
‒0.07 |
|
GSR |
qGSR10
|
10 |
57/52 |
wd10003790 |
ah10001182 |
5.8 |
3.71 |
23.17 |
21.45 |
‒0.35 |
‒0.29 |
Table 3Major QTL regions for yield related traits detected in CSSLs.
Table 3
|
Traits |
Chr. |
Marker name / interval |
LOD |
PVE (%) |
Additive effectz)
|
|
|
|
|
2017 |
2018 |
2017 |
2018 |
2017 |
2018 |
|
DTH |
8 |
id8005186 |
3.16 |
|
10.01 |
|
2.79 |
|
|
8 |
ae08007378 |
2.67 |
8.70 |
2.07 |
|
8 |
id8006751 |
2.62 |
8.55 |
2.26 |
|
8 |
id8007764 |
3.70 |
11.38 |
3.59 |
|
CL |
1 |
id1010652 |
2.89 |
14.35 |
17.34 |
|
1 |
id1022407-SD1-GA |
9.47 |
11.03 |
33.70 |
44.21 |
19.04 |
16.36 |
|
1 |
id1024836-id1028304 |
3.97 |
5.77 |
18.62 |
29.83 |
19.75 |
18.76 |
|
PL |
8 |
id8006751-cmb0824.7 |
2.53 |
25.23 |
‒0.95 |
|
USN |
4 |
id4005704, cmb0422.7 |
2.75 |
16.01 |
10.57 |
|
5 |
id5010886 |
2.99 |
17.19 |
7.84 |
|
GN |
8 |
ae08007378 |
2.81 |
14.71 |
‒14.32 |
|
8 |
id8006751-cmb0824.7 |
2.83 |
14.79 |
‒15.83 |
|
GY |
2 |
id2016199-cmb0236.6 |
2.67 |
26.45 |
7.43 |
|
SY |
2 |
ah02000407-id2004617, id2007512 |
4.00 |
36.91 |
‒3.74 |
|
DW |
1 |
ah01001843 |
2.89 |
34.92 |
6.73 |
|
2 |
id2016199-cmb0236.6 |
2.84 |
27.91 |
10.55 |
|
GSR |
4 |
id3010700-ad03013905, ae03006317-id3015453 |
5.98 |
49.74 |
25.14 |
References
Reference
- Ali ML, Sanchez PL, Yu SB, Lorieux M, Eizenga GC. 2010. Chromosome segment substitution lines: a powerful tool for the introgression of valuable genes from Oryza wild species into cultivated rice (O. sativa). Rice (N. Y.). 3: 218-234.
- Chen J, Ding J, Ouyang Y, Du H, Yang J, Cheng K, et al. 2008. A triallelic system of S5 is a major regulator of the reproductive barrier and compatibility of indica-japonica hybrids in rice. Proc. Natl. Acad. Sci. U.S.A.. 105: 11436-11441.
- Doi K, Iwata N, Yoshimura A. 1997. The construction of chromosome substitution lines of African rice (Oryza glaberrima Steud.) in the background of japonica rice (O. sativa L.). Rice Genetics Newsletter. 14: 39-41.
- Duan M, Sun Z, Shu L, Tan Y, Yu D, Sun X, et al. 2013. Genetic analysis of an elite super-hybrid rice parent using high-density SNP markers. Rice (N. Y.). 6: 1-15.
- Dwivedi DK, Pandey MP, Pandey SK, Rongbai L. 1998. Heterosis in inter and intrasubspecific crosses over three-environments in rice. Euphytica. 99: 155-165.
- Fahad S, Adnan M, Hassan S, Saud S, Hussain S, Wu C, et al. Hasanuzzaman M., Fujita M., Nahar K., Biswas JK., 2019. Rice response and tolerance to high temperature, p. editors. Advances in rice research for abiotic stress tolerance. Woodhead Publishing. pp. 201-224.
- . S. Solomon, D. Qin, M. Manning, , IPCC.2007. Summary for policymakers. editors. Climate change 2007: the physical science basis, contribution of working group I to the forth assessment report of the intergovernmental panel on climate change. 1(18):Cambridge University Press. Cambridge, U.K..
- Jagadish SVK, Craufurd PQ, Wheeler TR. 2007. High temperature stress and spikelet fertility in rice (Oryza sativa L.). J. Exp. Bot.. 58: 1627-1635.
- Jagadish SVK, Craufurd PQ, Wheeler TR. 2008. Phenotyping parents of mapping populations of rice for heat tolerance during anthesis. Crop Sci.. 48: 1140-1146.
- Khush GS. 1999. Green revolution: preparing for the 21st century. Genome. 42: 646-655.
- Khush GS, Virk PS. 2005. IR varieties and their impact. International Rice Research Institute. Los Baños, Philippines.
- Kilasi NL, Singh J, Vallejos CE, Ye C, Jagadish SVK, Kusolwa P, et al. 2018. Heat stress tolerance in rice (Oryza sativa L.): Identification of quantitative trait loci and candidate genes for seedling growth under heat stress. Front. Plant Sci.. 9: 1578
- Kim B, Kim DG, Lee G, Seo J, Choi IY, Choi BS, et al. 2014. Defining the genome structure of 'Tongil' rice, an important cultivar in the Korean "Green Revolution". Rice (N. Y.). 7-22.
- Kim CK, Chu SH, Park HY, Seo J, Kim B, Lee G, et al. 2017. Identification of heterosis QTLs for yield and yield-related traits in indica-japonica recombinant inbred lines of rice (Oryza sativa L.). Plant Breed. Biotech.. 5: 371-389.
- Kobayashi A, Hori K, Yamamoto T, Yano M. 2018. Koshihikari: a premium short-grain rice cultivar - its expansion and breeding in Japan. Rice (N. Y.). 11: 15
- Kosambi DD. 1944. The estimate of map distances from recombination values. Ann. Eugen.. 12: 172-175.
- Li M-m, Li X, Yu L-q, Wu J-w, Li H, Liu J, et al. 2018. Identification of QTLs associated with heat tolerance at the heading and flowering stage in rice (Oryza sativa L.). Euphytica. 214: 70
- Mackill DJ, Khush GS. 2018. IR64: a high-quality and high-yielding mega variety. Rice (N. Y.). 11: 18
- Meng L, Li H, Zhang L, Wang J. 2015. QTL IciMapping: Integrated software for genetic linkage map construction and quantitative trait locus mapping in biparental populations. Crop J.. 3: 269-283.
- Murray MG, Thompson WF. 1980. Rapid isolation of high molecular weight plant DNA. Nucleic Acids Res.. 8: 4321-4326.
- Nagata K, Ando T, Nonoue Y, Mizubayashi T, Kitazawa N, Shomura A, et al. 2015. Advanced backcross QTL analysis reveals complicated genetic control of rice grain shape in a japonica × indica cross. Breed. Sci.. 65: 308-318.
- Nonoue Y, Hori K, Ono N, Shibaya T, Ogiso-Tanaka E, Mizobuchi R, et al. 2019. Detection of heading date QTLs in advanced-backcross populations of an elite indica rice cultivar, IR64. Breed. Sci.. 69: 352-358.
- Park BJ, Kim YH, Min SK, Kim MK, Choi Y, Boo KO, et al. 2017. Long-term warming trends in Korea and contribution of urbanization: an updated assessment. J. Geophys. Res.-Atmos.. 122: 10637-10654.
- Reflinur , Kim B, Jang SM, Chu SH, Bordiya Y, Akter MB, et al. 2014. Analysis of segregation distortion and its relationship to hybrid barriers in rice. Rice (N. Y.). 7: 3
- Sasaki A, Ashikari M, Ueguchi-Tanaka M, Itoh H, Nishimura A, Swapan D, et al. 2002. A mutant gibberellin-synthesis gene in rice. Nature. 416: 701-702.
- Shi W, Yin X, Struik PC, Solis C, Xie F, Schimidt RC, et al. 2017. High day- and night-time temperature affect grain growth dynamics in contrasting rice genotypes. J. Exp. Bot.. 68: 5233-5245.
- Sreenivasulu N, Butardo VM, Misra G, Cuevas RP, Anacleto R, Kishor PBK. 2015. Designing climate-resilient rice with ideal grain quality suited for high-temperature stress. J. Exp. Bot.. 66: 1737-1748.
- Ujiie K, Yamamoto T, Yano M, Ishimaru K. 2015. Genetic factors determining varietal differences in characters affecting yield between two rice (Oryza sativa L.) varieties, Koshihikari and IR64. Genet. Resour. Crop Evol.. 63: 97-123.
- Xue W, Xing Y, Weng X, Zhao Y, Tang W, Wang L, et al. 2008. Natural variation in Ghd7 is an important regulator of heading date and yield potential in rice. Nat. Genet.. 40: 761-767.
- Yang J, Zhao X, Cheng K, Du H, Ouyang Y, Chen J, et al. 2012. A killer-protector system regulates both hybrid sterility and segregation distortion in rice. Science. 337: 1336-1340.
- Yang X, Tian Z, Sun L, Chen B, Tubiello FN, Xu Y. 2017. The impacts of increased heat stress events on wheat yield under climate change in China. Clim. Change. 140: 605-620.
- Yano M, Katayose Y, Ashikari M, Yamanouchi U, Monna L, Fuse T, et al. 2000.
Hd1, a major photoperiod sensitivity quantitative trait locus in rice, is closely related to the Arabidopsis flowering time gene CONSTANS
. Plant Cell. 12: 2473-2484.
- Yonemaru J-i, Yamamoto T, Fukuoka S, Uga Y, Hori K, Yano M. 2010. Q-TARO: QTL Annotation Rice Online Database. Rice (N. Y.). 3: 194-203.