Abstract
At the reproductive development stage of rice (Oryza sativa L.), temperature stress can decrease spikelet fertility, ultimately resulting in a yield loss. In this study, a total of 98 rice varieties were used in genome-wide association study (GWAS) to understand spikelet fertility under a high temperature (SFHT). GWAS results revealed that two lead SNPs were significantly associated with SFHT. Candidate genes located within ± 250 kb of the corresponding SNP position were discovered, resulting in a total of 21 candidate genes on chromosome 10 and 18 candidate genes on chromosome 11. Based on previously reported function and haplotype analysis, Os10g0177200 (EF-HAND 2domain containing protein) as one candidate gene showed significant differences among groups of haplotypes. This candidate gene will be further evaluated for its function to determine whether it is useful for improving molecular breeding studies and developing new high temperature tolerant rice varieties.
-
Key words: Genome-wide association study, Oryza sativa L., Spikelet fertility, High temperature
INTRODUCTION
Increased temperature caused by global warming has become a significant problem for the growth and pro-duction of crops. A high temperature has a direct or an indirect effect on crops, leading to a significant yield loss (
Raza et al. 2019). It has been predicted that the average temperature will continue to rise over the next 30-50 years by 2-3℃ (
Hatfield and Prueger 2015). Thus, many re-searchers are making an effort to develop suitable breeding techniques for climate change and improve crop adaptation to heat stress. Rice (
Oryza sativa L.), a main crop in Asia, is also affected by an increasing temperature. The optimum mean temperature for rice growth is 28℃ during the day time and 22℃ during the night time, although rice can sustain a temperature up to 32℃ (
Krishnan et al. 2011). However, when the temperature exceeds the optimal range and hold over a few days, it has negative effects on rice growth and development (
Aghamolki et al. 2014). The damage of a high temperature stress to rice depends on its developmental stage (
Wahid et al. 2007). The temperature limit for rice seed germination is usually about 45℃, above which rice seed cannot germinate (
Sánchez et al. 2014). Especially, the heading stage and flowering stage are the most sensitive to a high temperature stress, causing several damage to pollen formation and spikelet fertility (
Jagadish 2013). The generation and viability of pollen of male reproductive organs are reduced when the temperature rises to over 25℃. Complete sterility will occur when male reproductive organs are exposed to a temperature of about 35℃ (
Kaushal et al. 2016). A high temperature at the flowering stage can inhibit anther dehiscence, pollen germination, and pollen tube growth, resulting incomplete fertilization (
Satake and Yoshida 1978).
Like other important agronomic traits of rice, the tolerance to a high temperature stress is controlled by quantitative genes or loci. It is also influenced by in-teractions between the genotype and the environment (
Lu et al. 1996). With remarkable development in molecular breeding techniques, genetic dissection of complex traits to identify quantitative trait loci (QTLs) has been conducted in recent years (
Descalsota et al. 2018). Detecting QTLs or genes about rice spikelet fertility under a high temperature has also been studied. Four quantitative trait loci (QTLs) (
qHTSF1.2, qHTSF2.1, qHTSF3.1, and
qHTSF4.1) associated with spikelet fertility in response to heat stress at flowering stage in the IR64/Giza178 population have been identified (
Ye et al. 2015). Two other QTLs (
qHTSF6.1 and
qHTSF11.2) have been mapped in the Milyang23/ Giza178 population (
Ye et al. 2015). More recently, three QTLs (
qSF1, qSF2, and
qSF3) on chromosomes 1, 2, and 3 from
F2 population of M9962 (heat tolerant) and Sinlek (heat sensitive) have been reported (
Nubankoh et al. 2019).
Conventional QTL mapping can be difficult to in-vestigate large amounts of genes that cover the whole genome. Genome-wide association study (GWAS) is a high-throughput platform for detecting various abiotic stress responses, including drought responses (
Pantaliao et al. 2016;
Guo et al. 2018), cold tolerance (
Schläppi et al. 2017;
Xiao et al. 2018), and salt tolerance (
Meyer et al. 2016) has begun. A previous study has revealed two QTL regions associated with high temperature tolerance of rice at the seedling stage and eight candidate genes based on linkage analysis (
Wei et al. 2020).
The objective of this study was to understand effects of high temperature on rice during the heading stage at the genetic level. We applied GWAS to obtain high-quality SNP data for various rice accessions and identified candidate genes associated with heat tolerance of rice at heading stage.
MATERIALS AND METHODS
Plant materials and genomic database
In this study, 98 rice accessions, including 14 Tropical japonica, 42 Temperate japonica, 36 Indica, 3 Aus, and 3 Admixture subgroups, were used (
Supplementary Table S1). Rice plants were cultivated in a paddy field at the experimental farm of Konkuk University at Yeoju City, Korea. The general rice cultivation method in Korea was applied. Each rice seedling was transplanted at a density of 15 cm × 30 cm. After two months of cultivation, each plant was transplanted into a single pot and then cultivated in the natural condition before treating it with a high temperature stress. Genomic genotypes of 98 accessions were acquired using an Illumina HiSeq 2500 Sequencing Platform. (Illumina Inc., San Diego, CA, USA). The average genome coverage was 8X. Filtered reads were aligned to the rice reference genome (IRGSP 1.0). Filtering parameters for genotypes were as follows: minor allele frequency (MAF) > 5%, missing data < 1%, and heterozygosis ratio < 5%. Filtering was implemented using Plink software v1.90 (
Purcell et al. 2007). Finally, approximately ~2 million SNPs were selected from 6.5 million raw data SNPs.
Measuring the distance between the auricles of flag leaf and penultimate leaf (immediate lower leaf) is common method to predict the development stage of rice without damaging panicles (Virmani
et al. 1993). At the booting stage, the inter auricle distance reaches 6-12 cm. It is a previous step toward early heading stage when the head of the grain shows up (
Nurhasanah et al. 2015). Therefore, to synchronize the developmental stage the treated panicle, rice plants having three or more tillers showing 3-6 cm of distance between auricles of flag leaf and penultimate leaf were moved into a greenhouse for high temperature treatment. During the high temperature treatment in the heading stage, the temperature in the greenhouse was recorded every hour to obtain the maximum temperature, the minimum temperature, and the average temperature (
Supplementary Fig. S1). Average treatment temperature is shown in
Supplementary Table S1. When panicle neck nodes of treated panicles were exposed entirely from the flag leaf, they were moved out of the greenhouse and cultivated in the natural condition until harvest. After fully matured, fertilities of spikelets were evaluated. Partially or fully filled spikelets were sorted as fertile spikelets while empty or whitened spikelets were sorted as sterile spikelets (
Thuy et al. 2020). Spikelet fertility under high temperature (SFHT) was calculated as the ratio of the number of fully ripened spikelets to the total number of spikelets. Average SFHT of three selected panicles in each pot was then computed to compare SFHT values among rice accessions.
For population structure analysis, filtered genotype data were analyzed with an Admixture 1.3.0 software (
Alexander and Lange 2011). The tested K range of populations was 1 to 5. Each cross-validation error was calculated. K results that showed a low cross-validation error compared to other K values were selected for analysis. Visualization of the population structure was performed using Pophelper structure Web App v1.0.10 (
http://pophelper.com) based on optimal K value. PCA of genotypes was conducted based on SNPs using Trait Analysis by Association, Evolution and Linkage (TASSEL) 5.0 and plink software (
Bradbury et al. 2007;
Purcell et al. 2007). All SNPs were filtered by eliminating the one with a minor allele fre-quency (MAF) < 0.05 in TASSEL. The scatter plot of PCA result was made in R 4.0 package (
Horton and Kleinman 2015). Neighbor-joining trees (NJ-Tree) were generated with MEGA X (
Kumar et al. 2018). The result was visualized with Tree of Life (iTOL) v4 (
https://itol.embl.de) (
Letunic and Bork 2019). PopLDdecay software (
Zhang et al. 2019) was used for calculating Linkage disequilibrium (LD). Pairwise LD was calculated for all SNPs and averaged across the whole genome. LD decay was measured as the chromosomal distance at which the average pairwise correlation coefficient (
r2) decreased to half of its maximum value.
Genome Association and Prediction Integrated Tool (GAPIT) was used for performing GWAS in R package (
Lipka et al. 2012). Among GAPIT models, Efficient Mixed Model Association (EMMA) algorithm and Mixed Linear Model (MLM) that could simultaneously handle the population structure (
Yu et al. 2006) were applied. Only SNPs showing no missing values and minor allele frequency (MAF) > 0.05 were used in genotype dataset. GWAS results were visualized with Q-Q plot and Manhattan plot. The
P-value threshold was set at ‒log
10(
P) ≥ 4.0. Potential candidate genes predicted to be closely related to phenotype were then identified within ± 250 Kb of LD of lead SNPs position (
Supplementary Fig. S2). RAP-DB (
http://rapdb.dna.aafrc.go.jp/) and Gramene (
http://www.gramene.org/) databases were used to check physical positions of SNPs and to identify gene annotation information (
Sakai et al. 2013;
Gupta et al. 2016). Haplotype analysis was performed for candidate genes based on SNPs localized within coding regions. A total of 98 rice accessions with the same haplotype were grouped to see if the average SFHT differed from each other.
To statistically compare the difference between SFHTs of haplotypes, analysis of variance (ANOVA) was conducted using PROC GLM in SAS 9.4 software (SAS Institute lnc., Cary, NC, USA). If there was a statistically significant difference, comparison with least significant difference (LSD) method was followed.
RESULTS
High temperature stress at heading stage
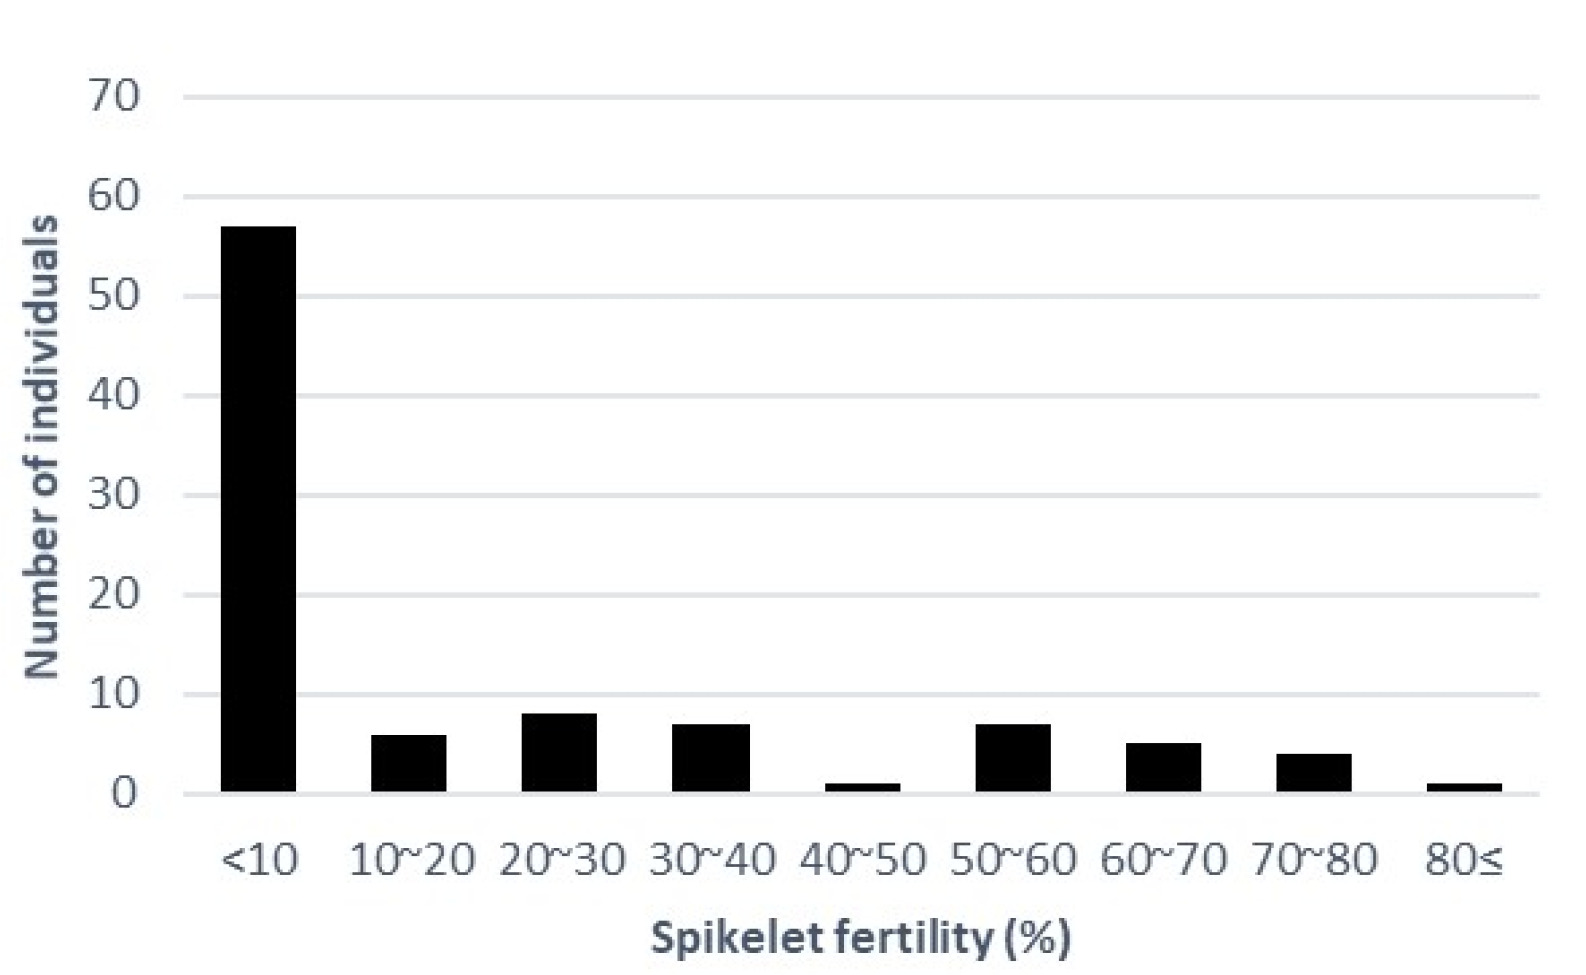
In this experiment, a high temperature was applied to the heading stage, not including the grain filling stage. The distribution of SFHTs for 98 rice accessions is shown in
Fig. 1. We measured the average SFHT for 98 rice accessions (
Supplementary Table S1). The majority of these rice accessions showed SFHT of less than 10%. Rice accessions showing SFHT more than 50% included 1 aus, 2 tropical japonica, 10 temperate japonica, and 3 indica. The accession of ‘Bori’ showed the highest SFHT at 83.97%. A total of 27 accessions showed complete sterility (0% of spikelet fertility), including 1 Aus, 2 Tropical japonica, 7 Temperate japonica, 14 Indica, and 3 Admixture.
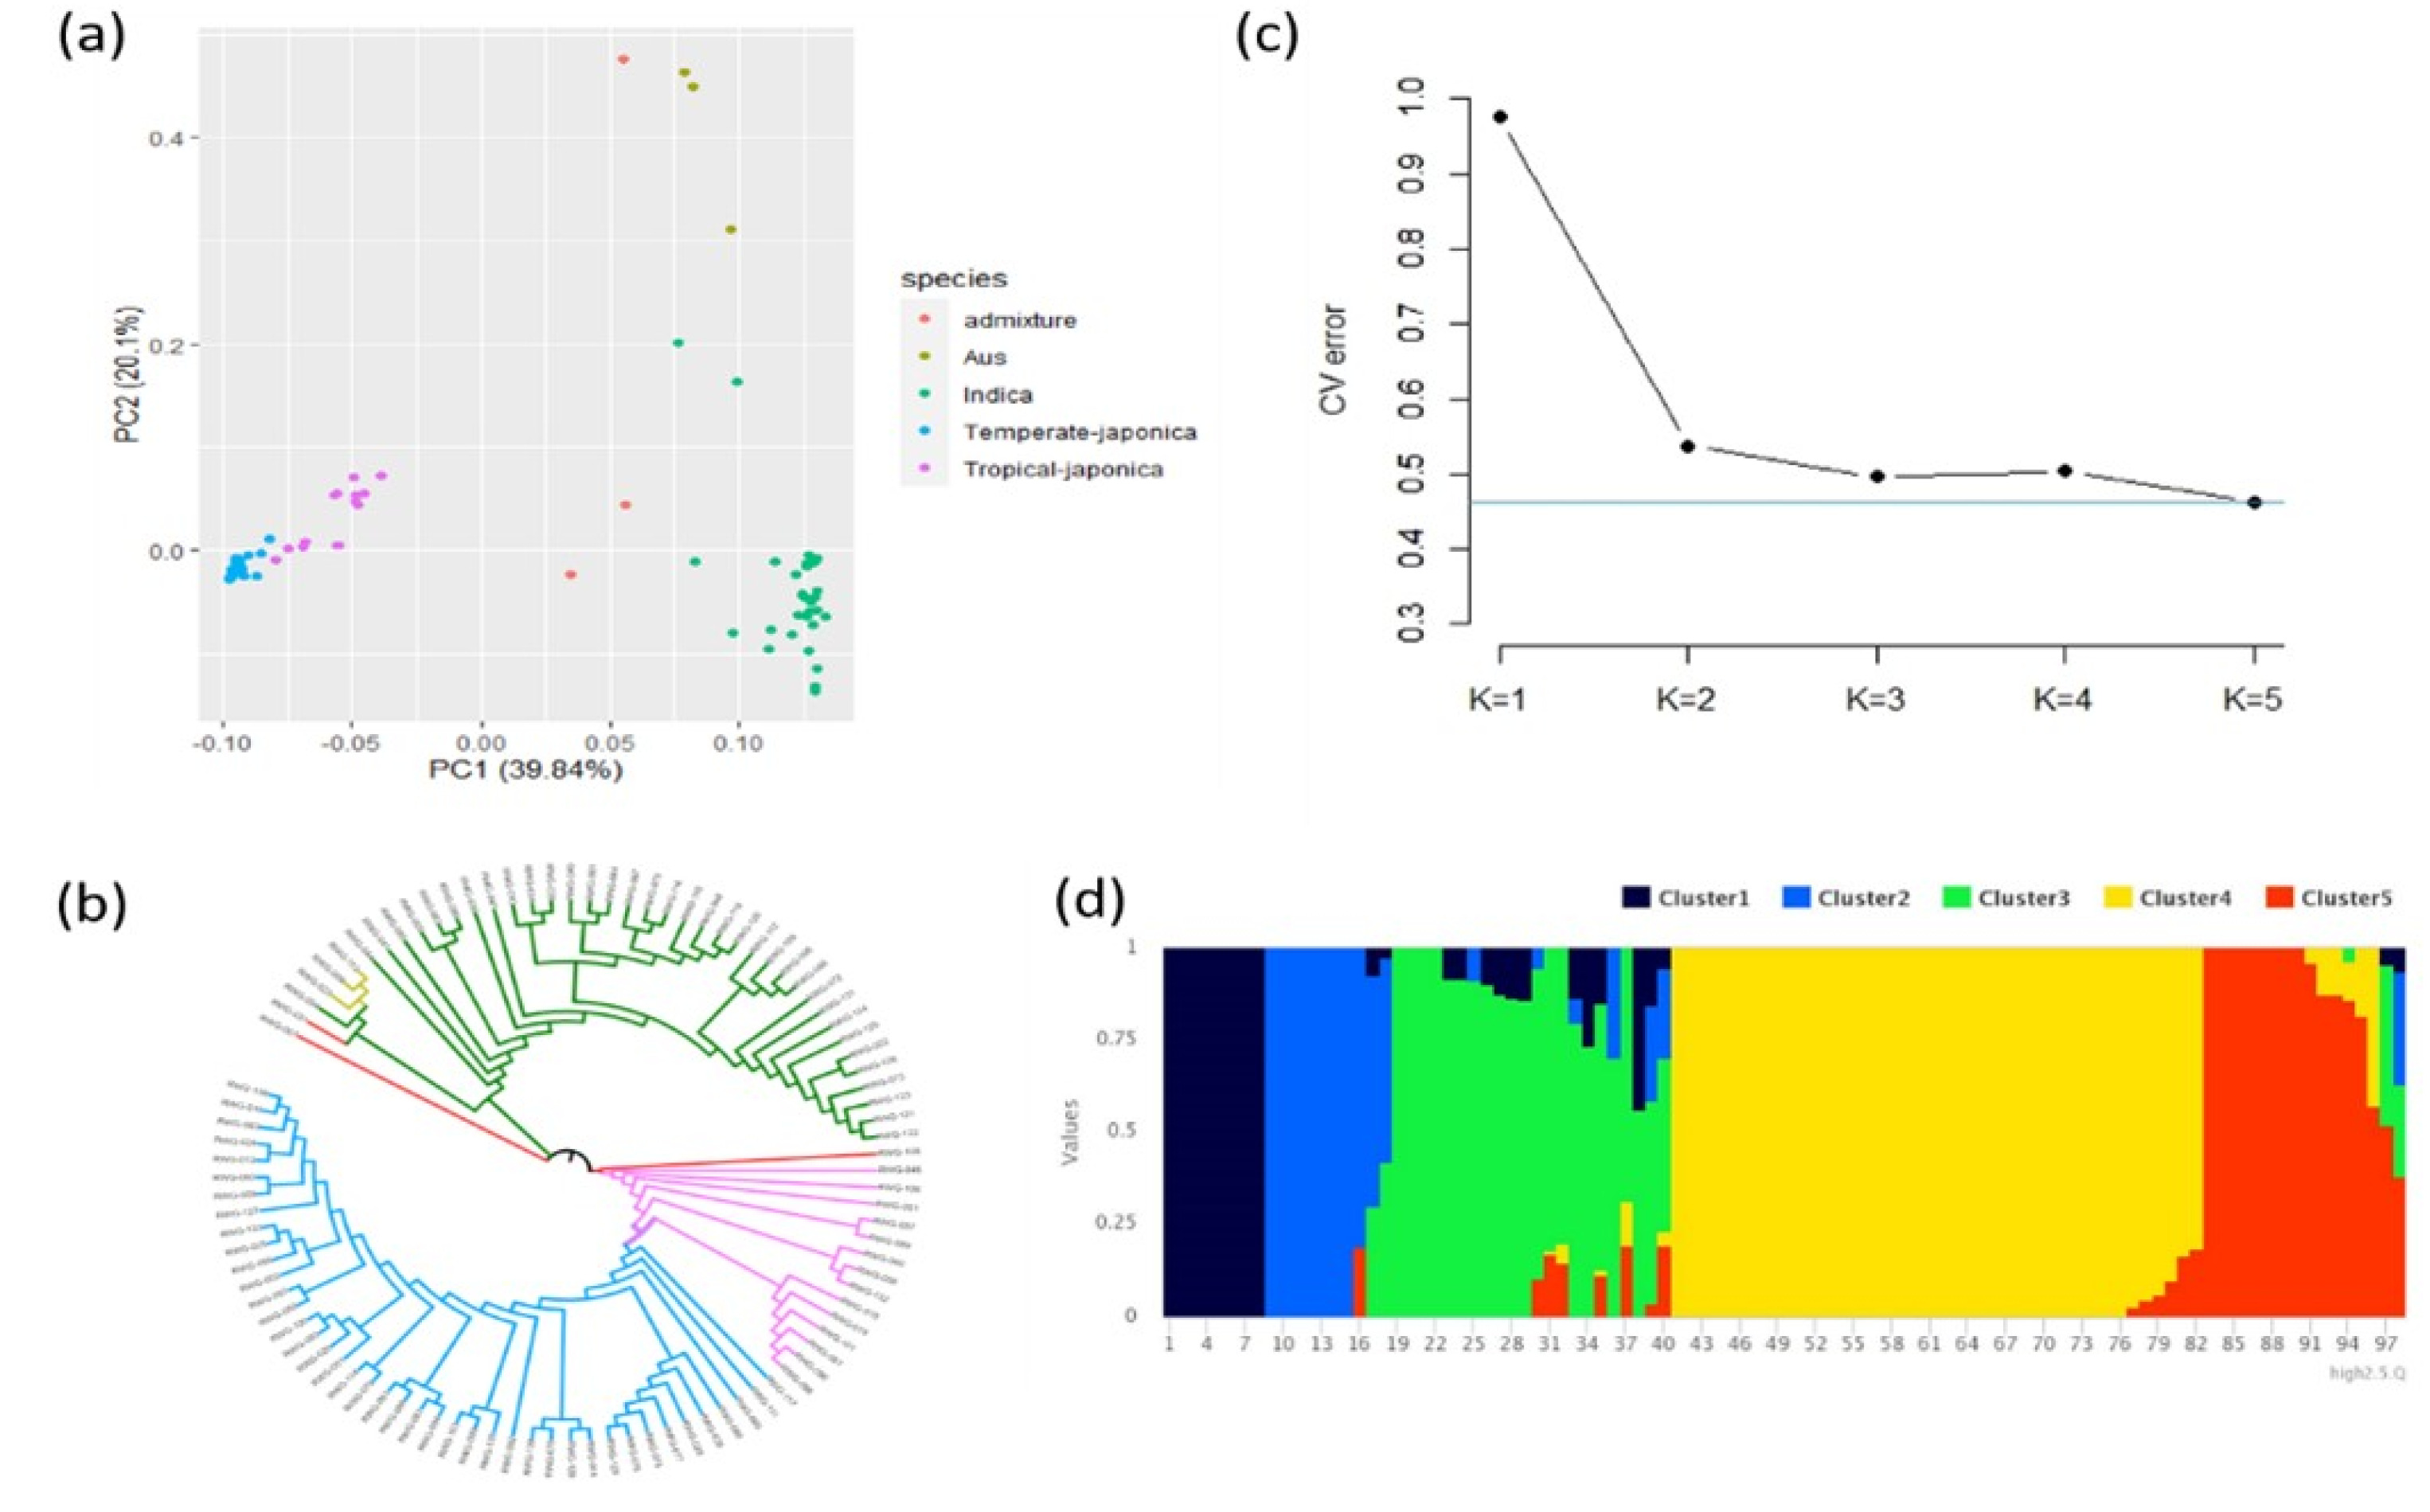
PCA was conducted with a total of 5 PCs based on genotype data. The first two PCs were selected for PCA visualization. According to PCA results, three subgroups (Temperate Japonica, Tropical japonica and Indica) were clearly distinguished (
Fig. 2a). PC1 and PC2 explained 39.84% and 20.1% of the total variance, respectively. The group of indica was obviously separated from japonica. However, aus and admixture were not clearly separated from other groups mainly due to the small size of the population. NJ-tree also indicated a distribution similar to PCA analysis (
Fig. 2b). The cross-validation error suggested an optimal K value of 5 for the population based on the lowest cross-validation error at K = 5 (
Fig. 2c). The population structure also showed a clear distribution at K = 5 and that accessions were distributed according to their subspecies (
Fig. 2d).
GWAS was performed using GAPIT to explore associated SNPs in the genome with the trait of SFHT (
Fig. 3). Several chromosomes contained SNPs with a high ‒log
10(
P) value. They aligned almost vertically like skyscrapers, suggesting that SNPs had significant associations with the trait of SFHT (
Barnett et al. 2014). The threshold was set to be ‒log
10(
P) = 4.0 for identification of association loci. Among lead SNPs showing ‒log
10(
P) value higher that 4, only two lead SNPs on chromosomes 9 and 10 were declared as SNP associated with the trait of SFHT because other lead SNPs were not aligned with near SNPs. Two association loci were detected (
Table 1). One associated QTL was detected on chromosome 10. It was designated as
qHTS10, showing 4.28 ‒log
10(
P) value and explaining 18.53% of total phenotypic variation. The other associated QTL was detected on chromosome 11. It was designated as
qHTS11, showing 4.63 ‒log
10(
P) value and explaining 20.4% of total phenotypic variation. The LD of 250 kb around of the lead SNPs was regarded as candidate genomic regions for genes associated with SFHT. Information of genes in candidate regions and SNPs inside the exon for those genes were obtained from RAP-DB database (
Sakai et al. 2013). For the segment of
qHTS10, 35 genes were located. Among them, non-protein-coding transcripts or hypothetical genes were filtered and 21 genes were remained. By applying this approach to
qHTS11, we reduced the number of candidate genes to be 18.
A total of 39 filtered and annotated genes located in the two QTLs were detected in the single-locus GWAS. They were then subjected to a haplotype analysis. In the phenotype comparison among haplotypes, only haplotypes with at least 4 rice accessions assigned to were used. Finally, a total of 3 candidate genes showing statistically significant difference among haplotypes were detected (
Supplementary Fig. S3-S5). Based on the difference and the known function, we focused on one candidate gene (Os10g0177200: EF-HAND 2 domain containing protein). Results of haplotype analysis for these candidate genes are shown in
Fig. 4. Heterozygote SNPs and those with missing data were not analyzed. SNPs from exon regions were used for haplotypes and haplotype variation analysis. Os10g0177200 contained seven SNPs on exons 3, 4, and 6 with amino acid changes: (C/T) with Aspartic acid to Asparagine, (T/C) with Isoleucine to Valine, (G/A) with Threonine to Methionine, (G/C) with Leucine to Valine, (G/T) with Phenylalanine to Leucine, (C/A) with Lysine to Asparagine, and (T/G) with Isoleucine to Leucine change. A total of 88 rice accessions were assigned to the group of Hap 1. The Hap 2 group showed the lowest SFHT. The Hap 3 group only had four rice accessions showing significantly higher SFHT of 45.94% than other groups of haplotypes.
DISCUSSION
In this study, the SFHT was evaluated as a marker for tolerance to high temperature. Although high temperature treatment was not identical under a greenhouse condition, we checked temperatures every hour and confirmed that the minimum average temperature was not less than 22℃ during the high temperature treatment. Since we replaced the rice in a natural condition after the panicle was fully excluded, the high temperature treatment was not used during the grain filling stage. Thus, the damage mainly occurred from the defect of pollen and failure of fertilization. The overall distribution of heat tolerant score was skewed to the left (low score). More than half of accessions showed SFHT less than 10%, indicating that the high temperature treatment was highly effective. Based on previously reported functions and haplotype analysis results, one candidate gene (Os10g0177200) encoding EF-HAND 2 domain containing protein was identified. EF-HAND 2 domain containing protein is known as one of
Ca2+ binding proteins (CBP) with a helix-loop-helix structure that could allow rapid movement of
Ca2+ ions into cells (
Chang et al. 2019) This signaling feature is known to play an important role in plant growth and development because
Ca2+ acts as a second intracellular messenger involved in plant en-vironmental stress resistance (
Zeng et al. 2017). The majority of
Ca2+ sensors possess the EF-hand motif, a helix-loop-helix structure that can form a turn-loop structure. It has been previously reported that
Ca2+ signaling plays a crucial role in conferring cold tolerance to plants (
Yuan et al. 2018). Recent studies have revealed that the perception of cold signals can regulate
Ca2+ channels and induce
Ca2+ transients (
Yuan et al. 2018). Based on the known role of
Ca2+ sensors, the EF-hand motif might play an important role in plant development and environmental stress response. For the gene of Os10g0177200, we used TENOR web search (Transcriptome ENcyclopedia Of Rice,
http://tenor.dna.affrc.go.jp/) to detect its mRNA level expression pattern under various conditions (
Kawahara et al. 2016). According to the gene expression database, drought stress can highly increase mRNA of Os10g0177200 in rice shoot and treatment with ABA can highly increase mRNA levels of Os10g0177200 in rice roots, suggesting that Os10g0177200 plays a role of in stress response (
Supplementary Fig. S6).
CONCLUSION
In this study, the trait of SFHT in rice was assessed in a panel of 98 diverse rice accessions. Two loci associated with high temperature tolerance were identified by GWAS. With haplotype analysis for comparing phenotype varia-tions, one candidate gene associated with heat tolerance at heading stage was found. Future evaluations of these candidate genes in the future might provide strategies for developing high temperature tolerant elite rice varieties.
SUPPLEMENTARY MATERIALS
ACKNOWLEDGEMENTS
This work was supported by the National Research Foundation of Korea (NRF) grant funded by the Korea government (MSIT) (No. NRF-2016R1D1A1B01011426) and was supported by Korea Institute of Planning and Evaluation for Technology in Food, Agriculture and Forestry (IPET) through Agri-Food Export Business Model Development Program, funded by Ministry of Agriculture, Food and Rural Affairs (MAFRA) (320105-3).
Fig. 1Distribution of spikelet fertility.

Fig. 2Population structure analysis. (a) Plot for principal component analysis (PCA). Red, brown, green, blue, pink indicated Admixture, Aus, Indica, Temperate-japonica, Tropical-japonica rice, respectively. (b) Plot for NJ-tree analysis. The color indicated the same as that used in PCA analysis. (c) Cross-validation (CV) error value in each K value. (d) Population structure result at K = 5.

Fig. 3(a) Manhattan plot of GWAS results. The yellow line means threshold (-log10 (P)≥ 4.0). (b) Q-Q plots for expected and observed ‒log10(P) value.
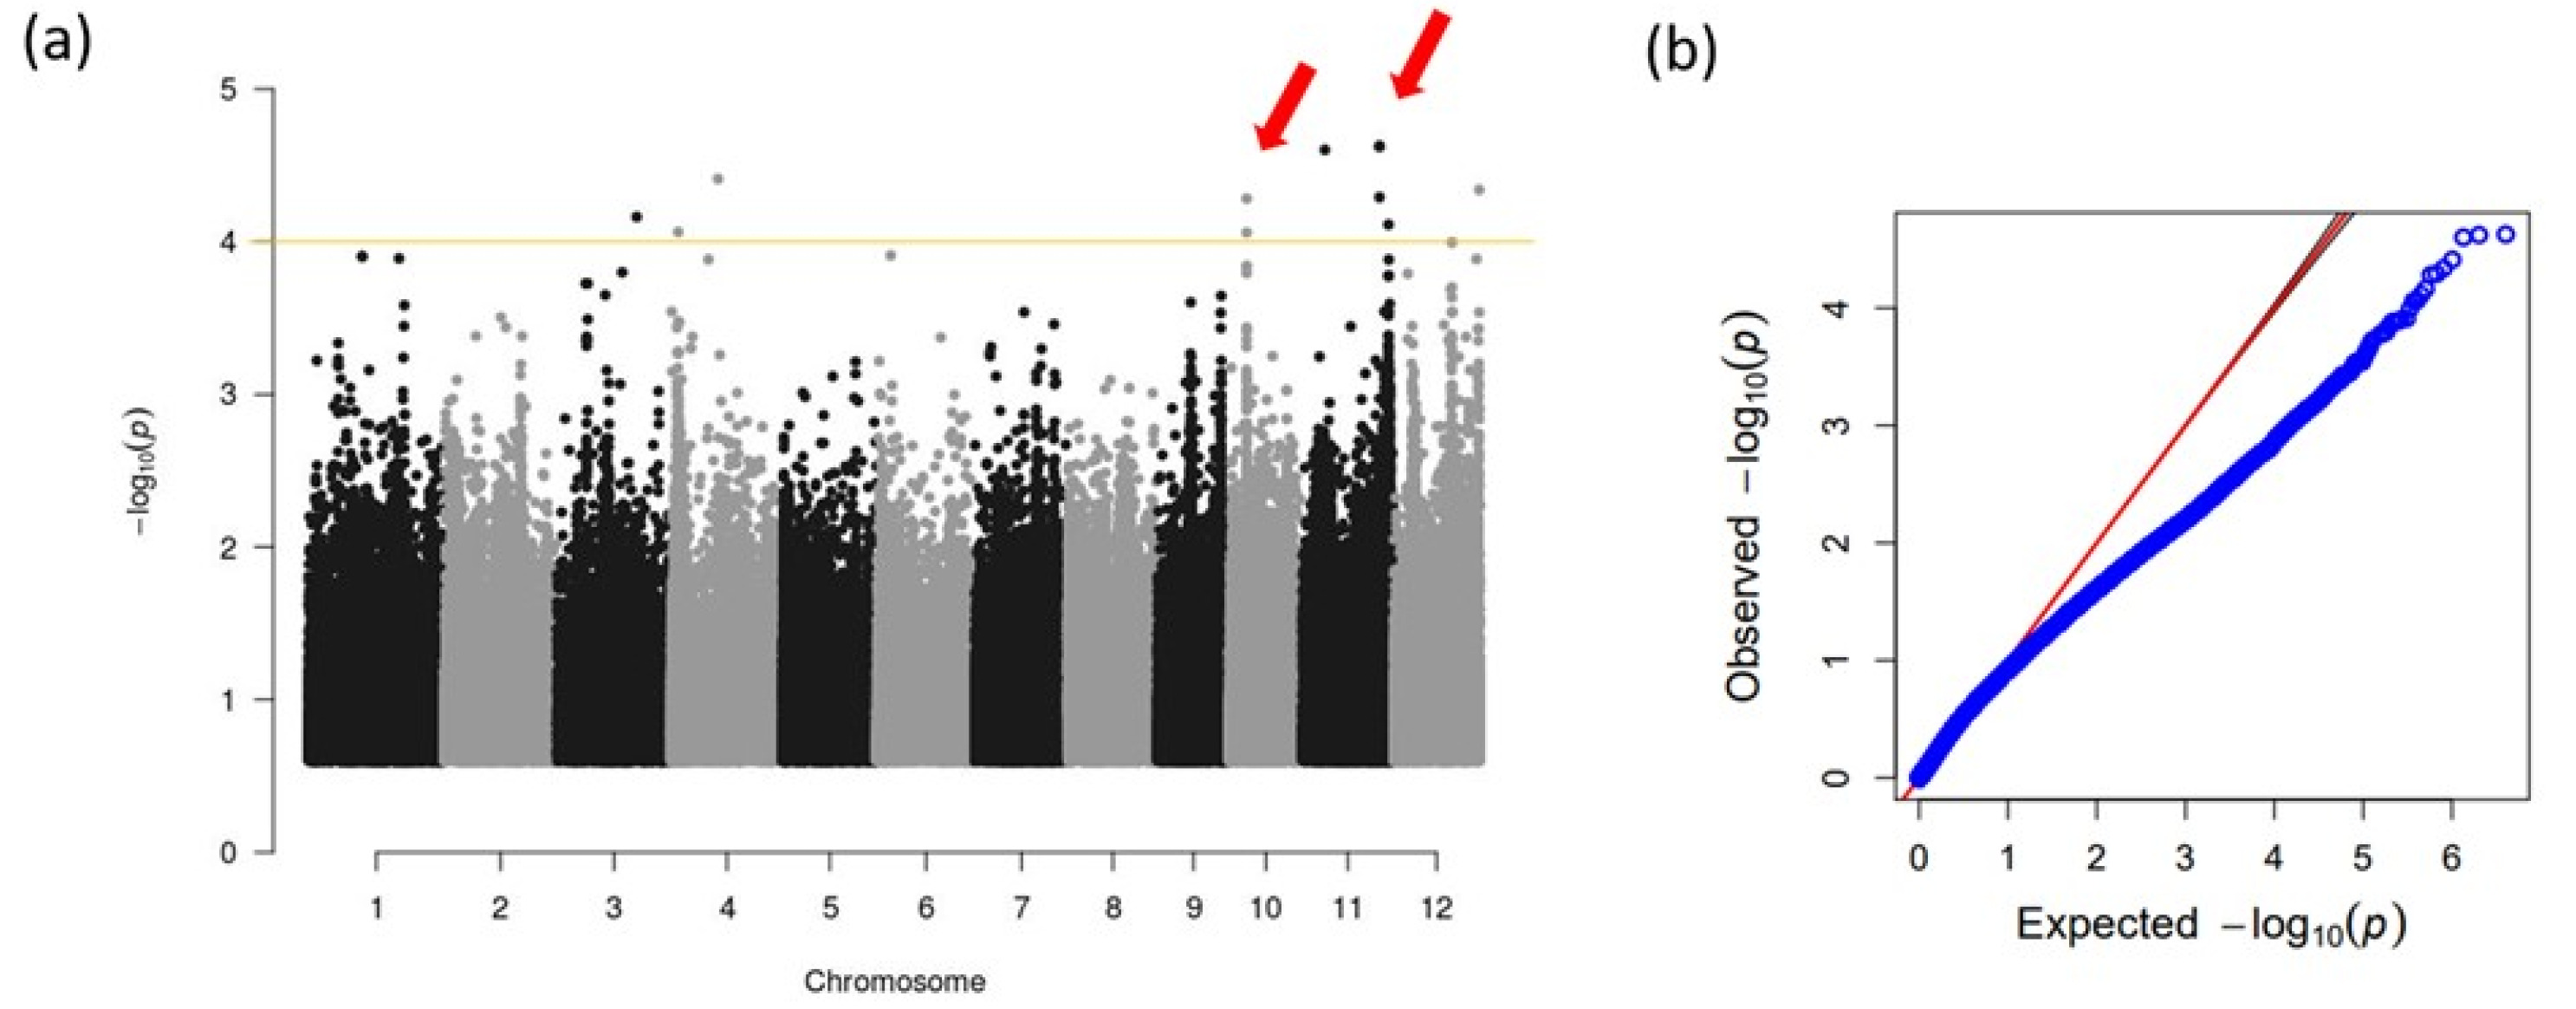
Fig. 4Haplotype analysis of Os10g0177200. (a) Gene structure of Os10g0177200. White box means non-coding region, black box means coding region and red line means relative position of SNP substitution. (b) Haplotype analysis result and phenotypic variation among haplotypes. *P-value < 0.05 (c) Frequency of haplotype group and subspecies.
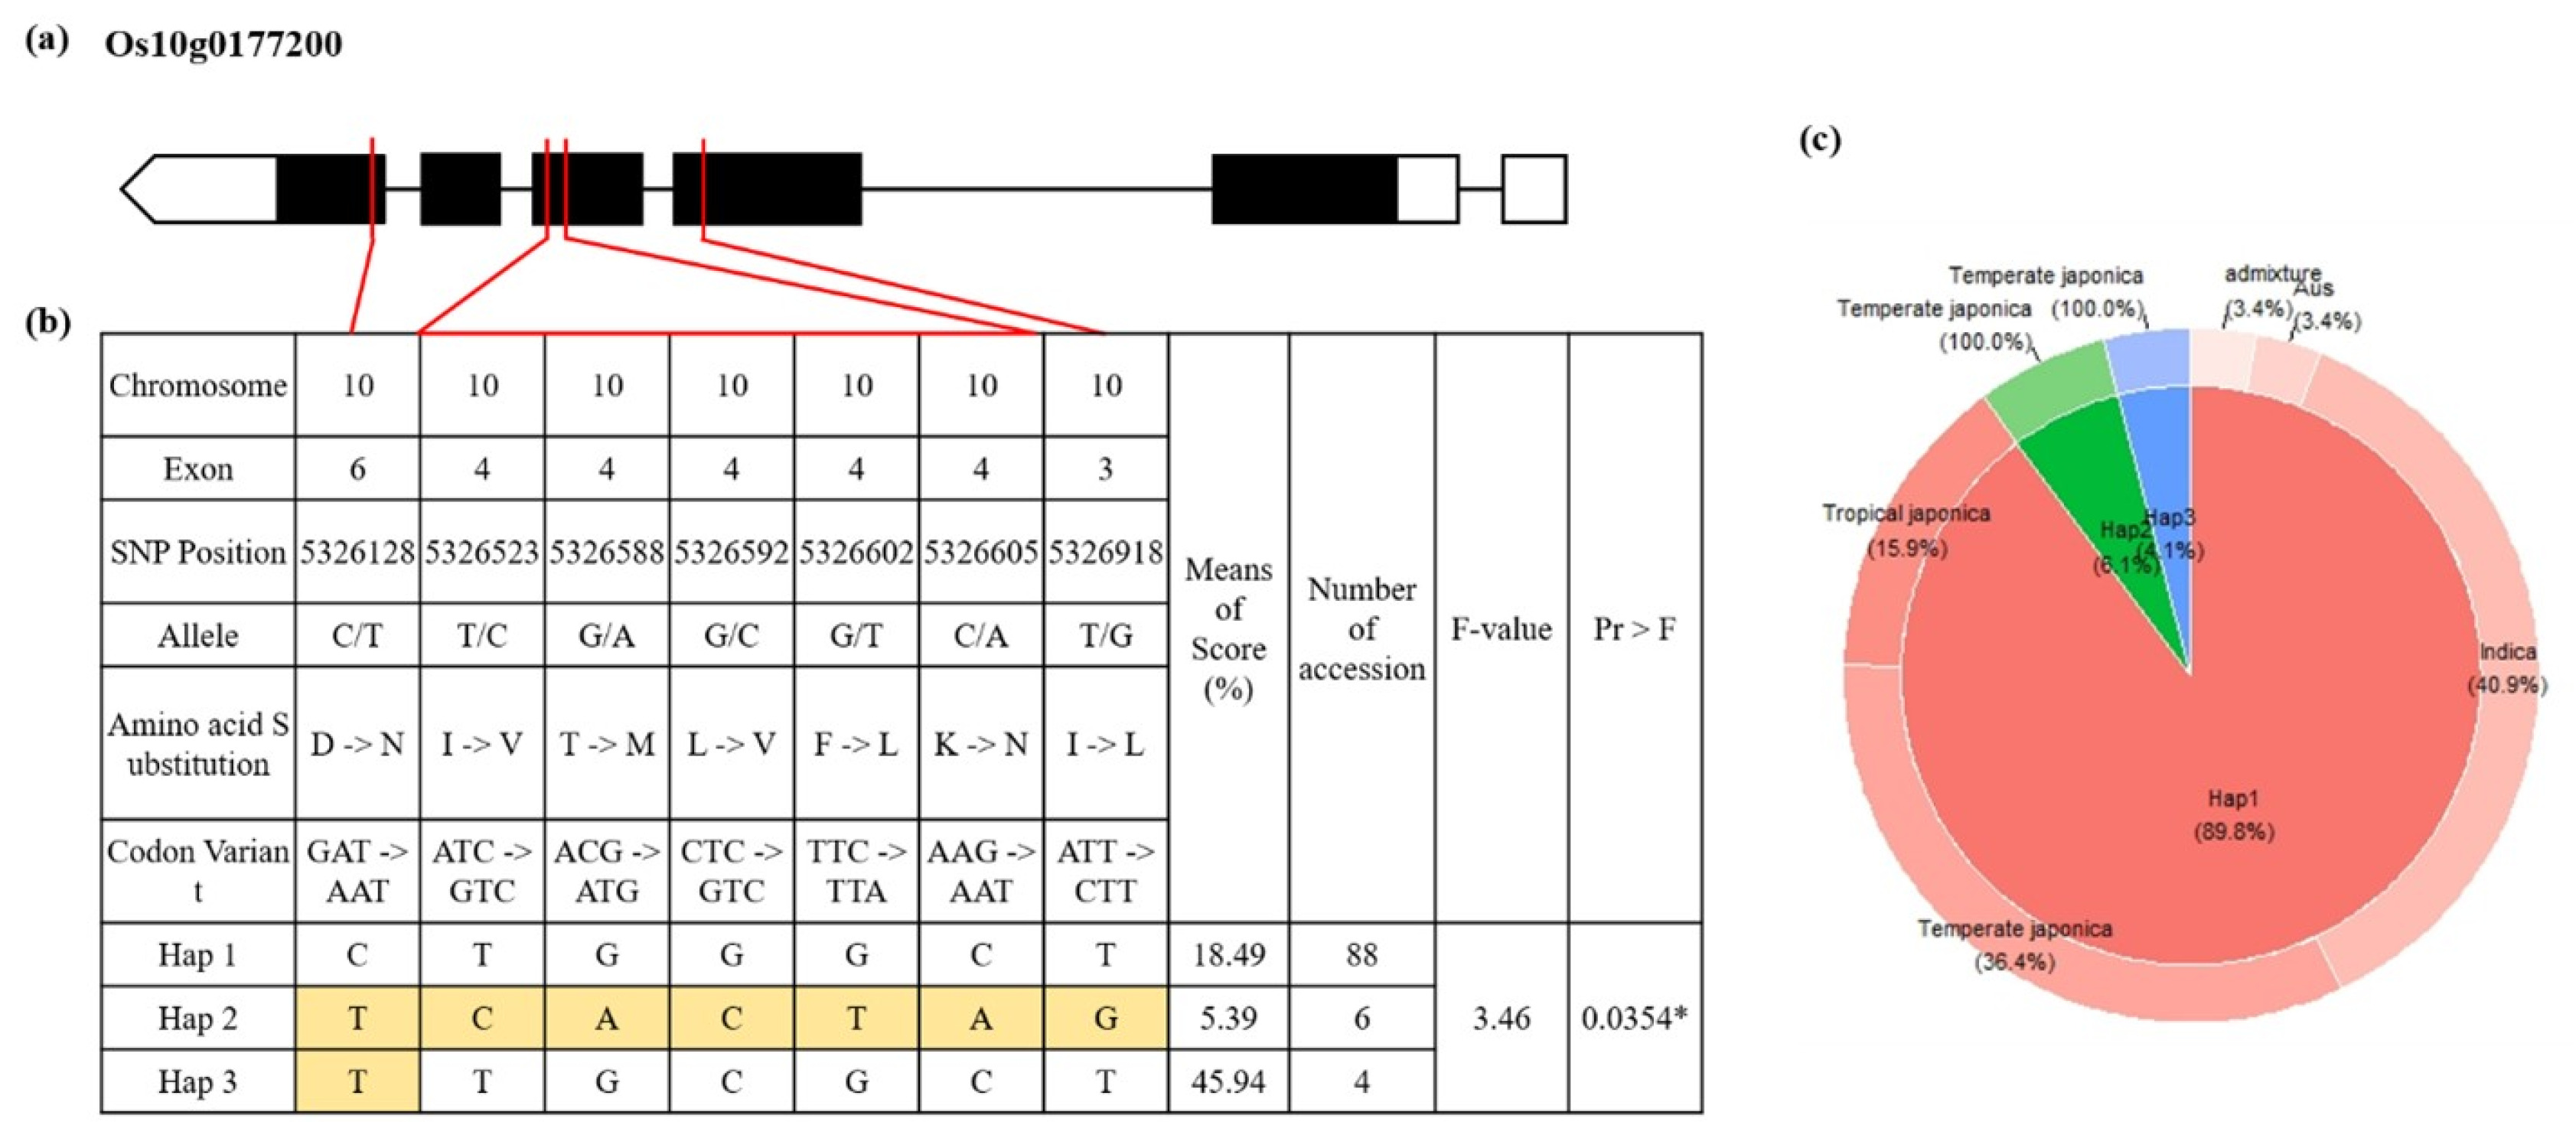
Table 1Genome-wide association loci detected in GWAS result.
Table 1
|
QTL |
Lead SNP |
CHRz)
|
LODy)
|
Phenotypic variation (%) |
|
qHTS10 |
chr10_5471850 |
10 |
4.28 |
18.53 |
|
qHTS11 |
chr11_24604007 |
11 |
4.63 |
20.40 |
References
- Aghamolki MTK, Yusop MK, Oad FC, Zakikhani H, Jaafar HZ, Kharidah S, et al. 2014. Heat stress effects on yield parameters of selected rice cultivars at reproductive growth stages. J. Food Agric. Environ.. 12: 741-746.
- Alexander DH, Lange K. 2011. Enhancements to the ADMIXTURE algorithm for individual ancestry estimation. BMC Bioinformatics. 12: 246
- Barnett GC, Thompson D, Fachal L, Kerns S, Talbot C, Elliott RM, et al. 2014. A genome wide association study (GWAS) providing evidence of an association between common genetic variants and late radiotherapy toxicity. Radio. Oncol.. 111: 178-185.
- Bradbury PJ, Zhang Z, Kroon DE, Casstevens TM, Ramdoss Y, Buckler ES, et al. 2007. TASSEL: software for as-sociation mapping of complex traits in diverse samples. Bioinformatics. 23: 2633-2635.
- Chang L, Dykes EJ, Li J, Moreno SNJ, Triana MAH. 2019. Characterization of Two EF‐hand Domain‐containing Proteins from Toxoplasma gondii. J. Eukaryot. Microbiol.. 66: 343-353.
- Descalsota GIL, Swamy BPM, Zaw H, Inabangan-Asilo MA, Amparado A, Mauleon R, et al. 2018. Genome-Wide Association mapping in a rice MAGIC plus population detects QTLs and genes useful for biofortification. Front. Plant Sci.. 9: 1347-1347.
- Guo Z, Yang W, Chang Y, Ma X, Tu H, Xiong F, et al. 2018. Genome-wide association studies of image traits reveal genetic architecture of drought resistance in rice. Mol. Plant.. 11: 789-805.
- Gupta P, Naithani S, Tello-Ruiz MK, Chougule K, D'Eustachio P, Fabregat A, et al. 2016. Gramene database: Navigating plant comparative genomics resources. Curr. Plant. Biol.. 7-8: 10-15.
- Hatfield JL, Prueger JH. 2015. Temperature extremes: Effect on plant growth and development. Weather Clim. Extrem.. 10: 4-10.
- Horton NJ, Kleinman K. 2015. Using R and RStudio for data management, statistical analysis, and graphics. CRC Press. Boca Raton, FL, U. S. A:
- Jagadish K. 2013. A phenotypic marker for quantifying heat stress impact during microsporogenesis in rice (Oryza sativa L.). Funct. Funct. Plant Biol.. 41(1): 48-55.
- Kaushal N, Bhandari K, Siddique KHM, Nayyar H. 2016. Food crops face rising temperatures: An overview of responses, adaptive mechanisms, and approaches to improve heat tolerance. Cogent. Food Agric.. 2: 1134380.
- Kawahara Y, Oono Y, Wakimoto H, Ogata J, Kanamori H, Sasaki H, et al. 2016. TENOR: database for comprehensive mRNA-Seq experiments in rice. Plant Cell Physiol.. 57: e7.
- Krishnan P, Ramakrishnan B, Reddy KR, Reddy V.R.. 2011. Chapter three - High-temperature effects on rice growth, yield, and grain quality. Adv. Agron.. 111: 87-206.
- Kumar S, Stecher G, Li M, Knyaz C, Tamura K. 2018. MEGA X: molecular evolutionary genetics analysis across computing platforms. Mol. Biol. Evol.. 35: 1547-1549.
- Letunic I, Bork P. 2019. Interactive Tree Of Life (iTOL) v4: recent updates and new developments. Nucleic Acids Res.. 47: W256-W259.
- Lipka AE, Tian F, Wang Q, Peiffer J, Li M, Bradbury PJ, et al. 2012. GAPIT: genome association and prediction integrated tool. Bioinformatics. 28: 2397-2399.
- Lu C, Shen L, Tan Z, Xu Y, He P, Chen Y, et al. 1996. Comparative mapping of QTLs for agronomic traits of rice across environments using a doubled haploid population. Theor. Appl. Genet.. 93: 1211-1217.
- Meyer RS, Choi JY, Sanches M, Plessis A, Flowers JM, Amas J, et al. 2016. Domestication history and geographical adaptation inferred from a SNP map of African rice. Nat. genet.. 48: 1083-1088.
- Nubankoh P, Wanchana S, Saensuk C, Ruanjaichon V, Cheabu S, Vanavichit A, et al. 2019. QTL-seq reveals genomic regions associated with spikelet fertility in response to a high temperature in rice (Oryza sativa L.). Plant Cell Rep.. 39: 149-162.
- Nurhasanah N, Sunaryo W, Pratama AN. 2015. Effect of genotype and developmental stage of pollen on the success anther culture of upland rice varieties from East Kalimantan. Asian Jr. of Microbiol. Biotech. Env. Sc.. 17(2): 329-340.
- Pantaliao GF, Narciso M, Guimarães C, Castro A, Colombari JM, Breseghello F, et al. 2016. Genome wide association study (GWAS) for grain yield in rice cultivated under water deficit. Genetica. 144: 651-664.
- Purcell S, Neale B, Todd-Brown K, Thomas L, Ferreira MAR, Bender D, et al. 2007. PLINK: a tool set for whole-genome association and population-based linkage analyses. Am. J. Hum. Genet.. 81: 559-75.
- Raza A, Razzaq A, Mehmood SS, Zou X, Zhang X, Lv Y, et al. 2019. Impact of climate change on crops adaptation and strategies to tackle its outcome: A Review. Plants (Basel). 8: 34
- Sánchez B, Rasmussen A, Porter JR. 2014. Temperatures and the growth and development of maize and rice: a review. Glob. Chang. Biol.. 20: 408-417.
- Sakai H, Lee SS, Tanaka T, Numa H, Kim J, Kawahara Y, et al. 2013. Rice Annotation Project Database (RAP-DB): an integrative and interactive database for rice genomics. Plant Cell Physiol.. 54: e6
- Satake T, Yoshida S. 1978. High temperature-induced sterility in indica rices at flowering. Jpn. J. Crop Sci.. 47: 6-17.
- Schläppi MR, Jackson AK, Eizenga GC, Wang A, Chu C, Shi Y, et al. 2017. Assessment of five chilling tolerance traits and GWAS mapping in rice using the USDA mini-core collection. Front. Plant Sci.. 8: 957
- Thuy T, Jeong JH, Lee HS, Yang SY, Im YH, Hwang WH, et al. 2020. Impact of Heat Stress on Pollen Fertility Rate at the Flowering Stage in Korean Rice (Oryza sativa L.) Cultivars. Korean J. Crop Sci.. 65: 22-29.
- Virmani SS, Sharma HL. 1993. Manual for Hybrid Rice Seed Production. International Rice Research Institute. Los Baños, Phillippines.
- Wahid A, Gelani S, Ashraf M, Foolad MR. 2007. Heat tolerance in plants: An overview. Environ. Exp. Bot.. 61: 199-223.
- Wei Z, Yuan Q, Lin H, Li X, Zhang C, Gao H, et al. 2020. Linkage Analysis, GWAS, Transcriptome analysis to identify candidate genes for rice seedlings in response to high temperature stress. BMC Plant Biol.. 21: 1-13.
- Xiao N, Gao Y, Qian H, Gao Q, Wu Y, Zhang D, et al. 2018. Identification of genes related to cold tolerance and a functional allele that confers cold tolerance. Plant physiol.. 177: 1108-1123.
- Ye C, Tenorio FA, Argayoso MA, Laz MA, Koh HJ, Redona ED, et al. 2015. Identifying and confirming quantitative trait loci associated with heat tolerance at flowering stage in different rice populations. BMC Genet.. 16: 41
- Yu J, Pressoir G, Briggs WH, Vroh Bi, Yamasaki M, Doebley JF, et al. 2006. A unified mixed-model method for association mapping that accounts for multiple levels of relatedness. Nat. Genet.. 38: 203-208.
- Yuan P, Yang T, Poovaiah B. 2018. Calcium signaling-mediated plant response to cold stress. Int. J. Mol. Sci.. 19: 3896
- Zeng H, Zhang Y, Zhang X, Pi Erxu, Zhu Y. 2017. Analysis of EF-Hand proteins in soybean genome suggests their potential roles in environmental and nutritional stress signaling. Front. Pant Sci.. 8: 877
- Zhang C, Dong SS, Xu JY, He WM, Yang TL. 2019. PopLDdecay: a fast and effective tool for linkage disequilibrium decay analysis based on variant call format files. Bioinformatics. 35: 1786-1788.