Abstract
Maize is a major staple food and source of income for over 90% of the population in South Sudan however, average yield is very low (0.5-0.9 t/ha). Little research has been done on maize improvement in the country and farmers mainly depend on local and unimproved cultivars. Identification and release of adapted and high yielding hybrids may elevate average maize yield (t/ha) among the resource-poor farmers in the country. Improved maize hybrids from the region have not been tested under South Sudanese environments. Objectives of the study were to: (i) determine genotype by environment interactions among some regional maize genotypes; (ii) estimate genetic components and heritability for yield performances; and (iii) identify high yielding maize hybrids adapted to agroecologies of South Sudan. At least 48 maize genotypes including elite hybrids and open-pollinated varieties (OPV) adapted across sub-Saharan Africa and two local cultivars collected from local farmers in South Sudan were evaluated across five locations within greenbelt and ironstone plateau agro-ecologies over three years (2013-2015). Experiments were set up in a 12 × 4 alpha lattice design with 2 replications. Standard agronomic practices were followed and data recorded on yield traits and resistance to major diseases. Across locations and years analysis revealed significant differences among genotypes due to genotype and genotype × environment interactions (P ≤ 0.01). Significant variability (P ≤ 0.01) existed among the genotypes for yield stability across environments. The study identified hybrids SC719 (8.3 t/ha), KH500-22A (8.0 t/ha) and Longe 10H (7.9 t/ha) as the best and stable candidates.
-
Key words: Maize, Adaptability, Genotype, Environment, Ecology, Hybrid
INTRODUCTION
Maize (
Zea mays L., 2n = 2x = 20 family Poaceae) is a universal cereal adapted to diverse agro-ecologies of both temperate and tropical regions of the world from 50°N to 40°S, and from sea level up to 4000 m altitude, with preference for a short-day photoperiod of 12.5 hours. The crop is originated in the Mesoamerica region (now called Mexico) about 10,000 years ago and is believed to have descended from a grass called teosinte (
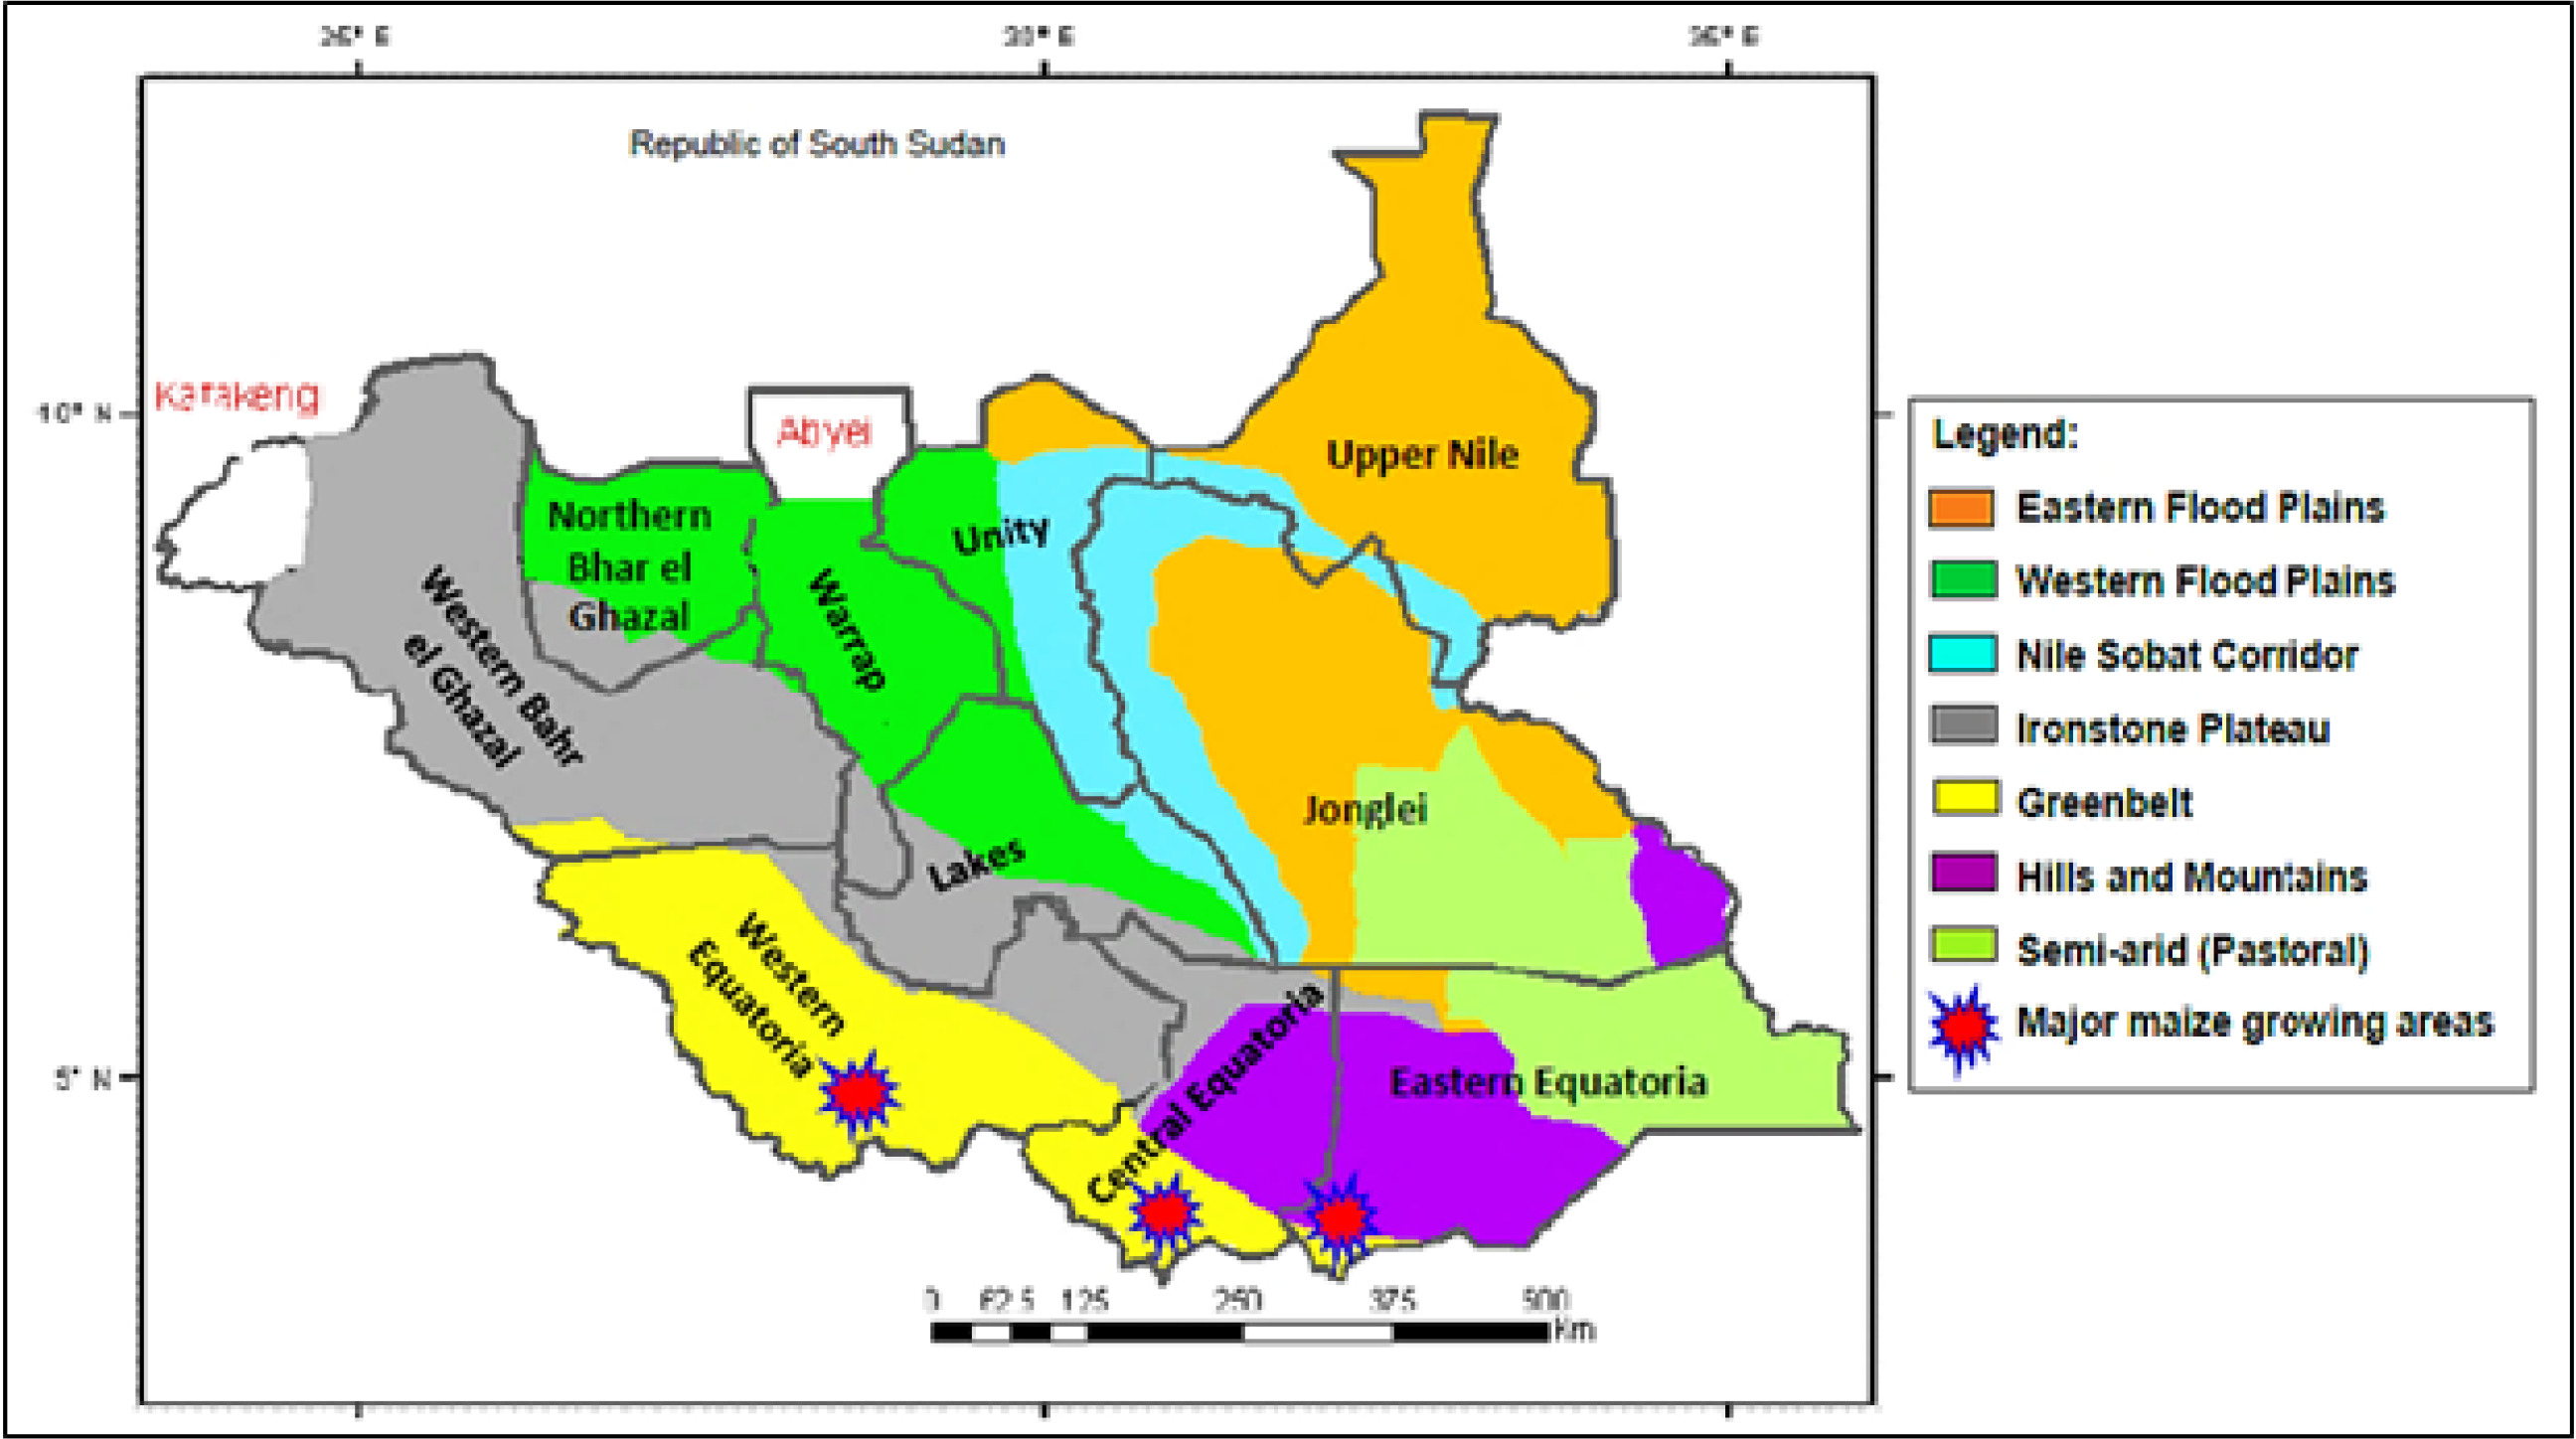
Awata et al. 2019). Maize is a major staple food and source of income for over 90% of the population in South Sudan. It is grown in most parts of the country with greenbelt zone being the major maize producer. The zone extends from Acholi hills, Imotong and Didinga mountains along South Sudan-Uganda border, 190 km south-east of Juba in Eastern Equatoria State; to South Sudan-DRC border, 360 km north-west of Juba in Western Equatoria State (
Jenkin et al. 1977) spanning Western, Central and Eastern Equatoria States (
Fig. 1) (
Jenkin et al. 1977;
Diao et al. 2012). Greenbelt zone is characterized by bi-modal rain patterns and the climatic conditions favour maximum maize production (
Jenkin et al. 1977;
Van Noordwijk 1984;
Odero 2008;
Food Security Technical Secretariat 2009).
Maize production in South Sudan is based on subsistence farming and farmers use grains (mainly sourced from Uganda and Kenya by WFP and NGOs for relief purposes) and unimproved varieties with very low average yield of 0.5-0.9 t/ha. Currently, annual net maize grain production is about 322,351 tons with a deficit of about 133,259 tons (
Diao et al. 2012;
Hoopen and Maiga 2012;
FAO/WFP 2016). Although some farmers obtain improved maize germplasm from east Africa through cross border activities, adaptations of those materials to South Sudanese en-vironments have not been tested hence farmers risk losing their crop and money. Other limiting factors for maize production include diseases, pests, low soil fertility and climatic changes (
Jenkin et al. 1977;
Bationo et al. 2006;
Odero 2008;
FAO/WFP 2016;
Binyason et al. 2017). Consequently, food shortages have persisted in the country where food reserves sometimes fall below the critical levels. As a result, devastating famines, widespread poverty and food insecurity affect an estimated 51% of the population (
Chokerah and Horvath 2012).
Little research has been done on maize improvement in South Sudan and subsequent release of improved varieties has been close to none. Therefore, identification of adapted high yielding hybrids and their quick release is necessary to elevate average maize yield in farmer fields to at least the regional level of 1.5-2.5 t/ha (
du Plessis 2003;
Belfield and Brown 2008). Objectives of the study were to: (i) determine genotype by environment interactions among selected maize genotypes; (ii) estimate genetic components and heritability for yield performances; and (iii) identify high yielding maize hybrids adapted to agroecologies of South Sudan. The information generated would be useful for maize breeding programs and variety release in South Sudan, hence boosts maize production and productivity among the small-scale farmers and enhances food security and livelihood in the country.
MATERIALS AND METHODS
Test environments
Rainfall
Not only the total amount of rainfall per year is important, but also its distribution over the year. Number of con-secutive months with adequate rainfalls determines the growth season for natural vegetation as well as crops. Rainfalls in the greenbelt zone is bimodal, with annual rainfall ranging from 1500-2000 mm, with less than 3 dry months (
Van Noordwijk 1984). The wet season usually starts in late March to early April and lasts until October or November (
Jenkin et al. 1977). This allows for two planting seasons per year especially for the early maturing crops. In ironstone plateau zone, rain begins in April/May with average annual rainfall of about 1180 mm (
FAO/WFP, 2016).
Soil type
Experiments were conducted within greenbelt and ironstone plateau agro-ecologies of South Sudan which are both characterized by “
Plinthic Ferralsols” type of soil (
Odero 2008). However, greenbelt has loamy-clay soil and is enriched with mosaic forests (savanna) with high crop productivity thus, considered a “bread-basket” of South Sudan where immense exchange of surplus produce exists with the neighboring zones. Ironstone plateau zone, extending across six States, has sandy-clay soil and is the largest agroecology in South Sudan. It is covered by deciduous woodland type of vegetation. Generally,
Plinthic Ferralsols has advanced weathering characteristics, with low capacity to retain and supply nutrients (cation exchange capacity) (
Bationo et al. 2006;
Odero 2008). This low retention capacity has marked consequences on fertilizer management. Therefore, inorganic fertilizers such as Nitrogen should be applied in small amount to avoid leaching since these soils occur in high rainfall region. Phosphate fertilizers are fixed by free irons and aluminum oxides thus, the soils require application of high rate of P fertilizers. Other constrains of the
Plinthic Ferralsols include deficiency in bases (Ca, K, Mg) which requires lime application. Incapability to retain bases applied as fertilizers, presence of aluminum with low pH (<5.2) which is toxic to many plants and active for fixation of phosphates, presence of free manganese in acid ferrasols which is toxic to some plants, deficiency of molybdenum which is important for growth of legumes and, hazards of iron and manganese toxicity in case of puddy-rice are some of the limiting factors characterizing the greenbelt zone soils (
Odero 2008). However, physically, ferrasols are excellent soils, well drained with good structure, and deep profile but root depth is almost unlimited which affects their water holding capacity.
Experimental sites
Experiments were conducted on-station and on-farm under field conditions over three years (2013-2015) in Palotaka Basic Seed Centre in Magwi County (Eastern Equatoria State); Yei Research Station and Mororbo Country Agriculture Department (Central Equatoria State); and Jambo and Kotobi (Western Equatoria State) (
Table 1).
Plant materials
A total of 48 maize genotypes including superior hybrids and OPV released in east and southern Africa and obtained from KARI (Kenya), NARO (Uganda), Seed Co Ltd (Zimbabwe) and Prime Seed (Ltd) were evaluated in repli-cated trials across greenbelt and ironstone plateau zones for yield performance and adaptability. The genotypes are mid-altitude germplasm belonging to intermediate maturity group. Longe 5 (an OPV previously released in Uganda and common among farmers in South Sudan) and 1 local cultivar collected from farmer field were included as local checks (
Supplementary Table S1). Experiments were conducted across five locations within greenbelt (Palotaka, Yei, Morobo) and ironstone plateau (Jambo, Kotobi) zones during April-August in 2013 - 2015 (
Table 1). The field was disk ploughed twice and then labeled prior to planting. Experiments were laid out following 12 × 4 alpha lattice design with a 2-row plot spaced 0.75 m between rows and 0.3m between hills. Two seeds were planted per hill and thinned to 1 resulting into 17 plants per row. Final plant density per ha was determined as follows:
where PD = plant density per ha and 10000 m
2 = an area equivalent to 1 ha. As a result, a final plant population of 44,444 plants was reared per ha. Fertilizer applications were based on recommendation by researchers from MAFS for maximum grain yield (t/ha), where Phosphorus (DAP) was applied at 120 kg/ha during planting. Nitrogen (Urea) fertilizer was administered first at 6 weeks after germination by top-dressing at 80 kg/ha followed by second application before flowering respectively. Experiments were weeded manually twice before flowering followed by one more weeding during or after flowering. Important agronomic data were recorded (
Supplementary Table S2). Plant stand was recorded for each plot after second weeding; anthesis date was determined when 50% of the plants per plot shed pollen; days to silking was determined when 50% of the plants developed silk; plant height (PH) and ear height (EH) were taken by randomly measuring five competitive plants in each plot at maturity; ear aspect at harvest was scored as 1 = nice uniform cobs with preferred grain texture in the ear and 5 = ugly cobs with undesirable grain texture in the ear; ear rot was scored as 1 = clean ear and 5 = rotten ear; plant aspect scored as 1 = short plant with uniform ear placement and 5 = tall plant with high ear placement. Field weight in kg/plot was measured on whole plot basis and grain moisture taken from randomly shelled portion of a plot.
Data analyses
Field weight (kg) per entry measured at harvest was first converted to grain yield (t/ha) by adjusting for 12.5 grain moisture and 80% shelling percentage as follows (
Kumar and Singh 2015):
where MC = grain moisture content at harvest; 0.8 = cob shelling percentage; 12.5 = standard grain moisture content; and Area harvested/plot (m
2) = equal to 0.3 m × 0.75 m. Data were analyzed separately for each location so as to determine the best linear unbiased predictions (BLUPs) of genotype effect on yield and related traits. Statistical model for single location was based on alpha incomplete block design and was fitted as follows (
Ott and Longnecker 2010):
where
Yijk = phenotypic observation of the
ith genotype in the
jth replication in the
kth incomplete block;
μ = population mean;
Gi = genetic effects of the
ith genotype;
Rj = effect of jth replication;
Bjk = effect of
kth incomplete block in
jth replication; and
Ɛijk = normally distributed error term with mean = 0 and variance = σ
2Ɛ. After testing for homogeneity of error variance, a combined analysis of variance across seasons and locations was attempted and best linear unbiased predictions (BLUPs) of means were determined using mixed model analysis (model III) of META-R, where genotypes were considered fixed effects while year, environment, replication and blocks within replication were random effects (
Odiyo et al. 2014;
Beyene et al. 2017;
Masuka et al. 2017). The statistical mixed model for combined analysis based on three-way ANOVA model (
SAS institute Inc 2016) was adopted as follows (
Abubakar and Ado 2009;
Moore and Dixon 2015):
where:
Yijkl = observation on
ith genotype in
jth environment in
kth replication in
lth incomplete block;
μ = general mean;
Gi = effect of genotype;
Lj = effect of location;
Sk = effect of season;
RL = effect of replication within location;
(GL)ij = effect of genotype × location interaction;
(GS)ik = effect of genotype × season interaction;
(LS)jk = effect of location and season interaction;
(GLS)ijk = effect of genotype × location × season interaction; and
Ɛijkl = error term associated with
ijklth observation. Skeletal ANOVA for GxE analysis across locations and years is outlined below (
Supplementary Table S3).
From the above (
Supplementary Table S3),
σ2g = genotypic variance;
σ2gey = variance due to genotype × environment × year interactions;
σ2E = environment variance,
H2 = broad sense heritability (repeatability) on Entry Mean Basis;
h2 = narrow sense (realized) heritability on plot mean basis;
SEs2g = standard error of genotypic variance;
SEH2 = standard error of broad-sense heritability;
SEh2 = standard error of narrow-sense heritability;
σ2Ɛ = error variance;
e = number of locations;
r = number of replications;
C = coefficient of component in the expected mean squares;
MSi = mean squares of
ith trait; and
Df = degree of freedom of
ith trait (
Awata et al. 2018). Significance of genotype mean squares was determined using F-tests (
P ≤ 0.01). Key parameters including standard deviation (σ), standard error of difference (SE), coefficient of variability (CV%) and Fisher’s protected least significant difference (LSD) among means of popu-lations at 5 % level were generated by the analysis of variance as following
Brown and Caligari (2008). Population standard deviation (σ), defined as variability among means of the population, was given by the equation:
Standard error (SE), defined as how closer (precise) a measurement is to the true (population) mean, was calculated as:
Coefficient of variation (CV%), referred to as the ability to detect if a sample is more variable for one trait than for the other, was computed as:
Fisher’s protected least significant difference (LSD), defined as a variation between two means that is signi-ficantly different at a-level (P ≤ 0.01), was calculated as:
LSD = t.05 (SEμ)
where xi = mean of genotype ith; N = population size; and t.05 = t value based on a value and the error degrees of freedom obtained from the ANOVA.
where COVp(xy) was the phenotypic (p) covariance between traits x and y, σ2px was the p variance for trait x and σ2py was the p variance for traits y.
After detecting the significance of GxE effects, stability analyses were analyzed using the additive main effects and multiplicative interactions (AMMI) and genotype and genotype-environment (GGE) biplot models using GenStat (14th Ed.). AMMI analysis has the power to combine additive components in a single model for the main effects of genotypes and environments, as well as multiplicative components for the interaction effect (
Miranda et al. 2009). Statistical model for AMMI analysis was fitted as below (
Ding et al. 2008):
where
Yijr = the phenotypic trait of genotype
i in environment
j for replicate
r,
µ = the population mean,
gi = the genotype main effects,
ej = the environment main effect,
λk = the singular (eigenvalue) value for the Interaction Principal Component (IPC) axis n,
αik and
ϒjk = the genotype and environment IPC scores (i.e. the left and right singular vectors) for axis n,
br(ej) = the effect of the block
r within the environment
j,
r = the number of blocks,
ρij = the residual containing all multiplicative terms not included in the model,
n = the number of axes or principal components (PC) retained by the model, and
Ɛijr = the experimental error, assumed independent with identical distribution. Degree of freedom (Df) for each IPCA was computed following the formula suggested by
Gollob (1968) (
Neisse et al. 2018):
where g = number of genotypes;
e = number of locations; and
n = sequence of the PCA for example, n = 1 for PCA1 and n = 2 for PCA2. Skeletal ANOVA for AMMI analysis across locations is shown below (
Supplementary Table S4). Hybrid stability was detected using biplot analysis of genotype and genotype × environment (GGE) interaction model as below (
Miranda et al. 2009):
where Yij = yield mean of ith genotype in jth environment; ȳ = overall mean of the genotypes in jth environment; λ1ξi1ϒj1 = the first principal component (IPCA1); λ2ξi2ϒj2 = the second principal component (IPCA2); λ1 and λ2 = the autovalues (characteristic roots) associated with IPCA1 and IPCA2; ξi1 and Ɛi2 = scores of the first and second principal components for the jth environment; and Ɛij = the error term.
RESULTS
Analysis of variance (ANOVA)
In the present study, performances of 48 regional hybrid and OPV maize were analyzed using the statistical procedures as described above. Results for analysis across locations, years and their respective interactions showed that genotypes were significantly different (
P ≤ 0.01) for most traits under study except for anthesis-silking interval (
Table 2). Traits with significant mean squares included silking date, plant height, ear aspect, grain yield and resistance to diseases. The study also found that genotype × year and genotype × year × location interactions had caused signifi-cant variations in mean performances for majority of the traits under study (
P ≤ 0.01). However, year did not affect anthesis-silking interval, plant height, ear height, husk cover, grain moisture content and gray leaf spot (
P > 0.05). Similarly, G × Y interactions did not affect most of the agronomic traits and diseases (
P > 0.05) except plant height, ear height and gray leaf spot (
P ≤ 0.01) respectively.
Results of analysis of variance across environments showed that the genotypes performed differently across locations and years. General mean performances of geno-types were calculated (data not shown). Best performing hybrids yielded above the checks and with mean grain yield of 8.3 to 6.4 t/ha while grain yield of one OPV was 3.9 t/ha compared to 3.1 and 0.6 t/ha for the two local checks which were OPV and farmer’s cultivar respectively (
Table 3). The superior hybrids and one OPV also showed reduced mean scores for disease severities compared to local checks with means ranging from 3.5 to 1.1 for
Turcicum leaf blight, 3.0 to 1.2 for maize streak virus, 2.5 to 1.2 for gray leaf spot and 2.7 to 1.0 for stem borer. In the current study, some hybrids showed reduced disease severities and high grain yield including SC719 (8.3 t/ha), KH500-22A (8.0 t/ha), KH500-46A (8.0 t/ha) and Longe 10H (7.9 t/ha) (
Table 3). Low to moderate CV values were observed for silking date (4.2), plant height (12.5), field weight (18.7), gray leaf spot (20.2),
Turcicum leaf blight (1.8) and grain yield (23.5). However, higher CV values were detected for stem borer (29.3), maize streak virus (32.0) and anthesis-silking interval (54.9).
Variance components due to genotype, genotype × location and genotype × location × year; and heritabiity estimates for yield traits and disease scores obtained from 48 regional and local maize genotypes evaluated across greenbelt and ironstone plateau zones of South Sudan are presented below (
Table 4). Variances due to genotype (s²
G), genotype × location (s²
GE) and genotype × location × year (s²
GEY) were highly significant (
P ≤ 0.01) for all traits except genotype × location (s²
GE) was not significant (
P > 0.05) for anthesis-silking interval; and genotype × location × year (s²
GEY) was not significant (
P > 0.05) for silking date, grain moisture content, maize streak virus and gray leaf spot. Comparably, the study found that absolute value of each variance was more than doubled its standard error.
Heritability estimates on entry mean basis across five locations over three years for traits under current study are presented in
Table 4. Broad-sense heritability estimates were higher than narrow-sense heritability estimates for all traits under study, and ranged from 64.8 (field weight) to 86.3 (silking date), with heritability value of 77.3 for grain yield (t/ha). The narrow-sense heritability values, which are the measure of heritable characters, were low to moderately high and ranged from 38.1 (field weight) to 53.5 (plant height), with a value of 41.9 for grain yield (t/ha).
The results of phenotypic correlation among some yield traits and disease scores are shown below (
Table 5). Grain yield was positively and significantly correlated with all agronomic traits. However, significant but negative correlations were detected between the grain yield and
Turcicum leaf blight, maize streak virus, gray leaf spot and stem borer. The major diseases (
Turcicum leaf blight, maize streak virus, gray leaf spot) and pest (stem borer) showed positive and strong correlations among themselves, ranging from 0.66 between maize streak virus and gray leaf spot to 0.85 between
Turcicum leaf blight and stem borer respectively.
Combined analysis of variance (ANOVA) of 48 maize genotypes evaluated across five locations and three years using AMMI model showed that location, genotype and genotype × location interaction were highly significant (
Table 6). Genotype, location and genotype × location interction were highly significant (
P ≤ 0.01). The GxE effect was further partitioned into interaction principal component axes (IPCA). Total GxE interactions explined by the first two IPCA main axes were 11.3% (IPCA1) and 9.7% (IPCA2).
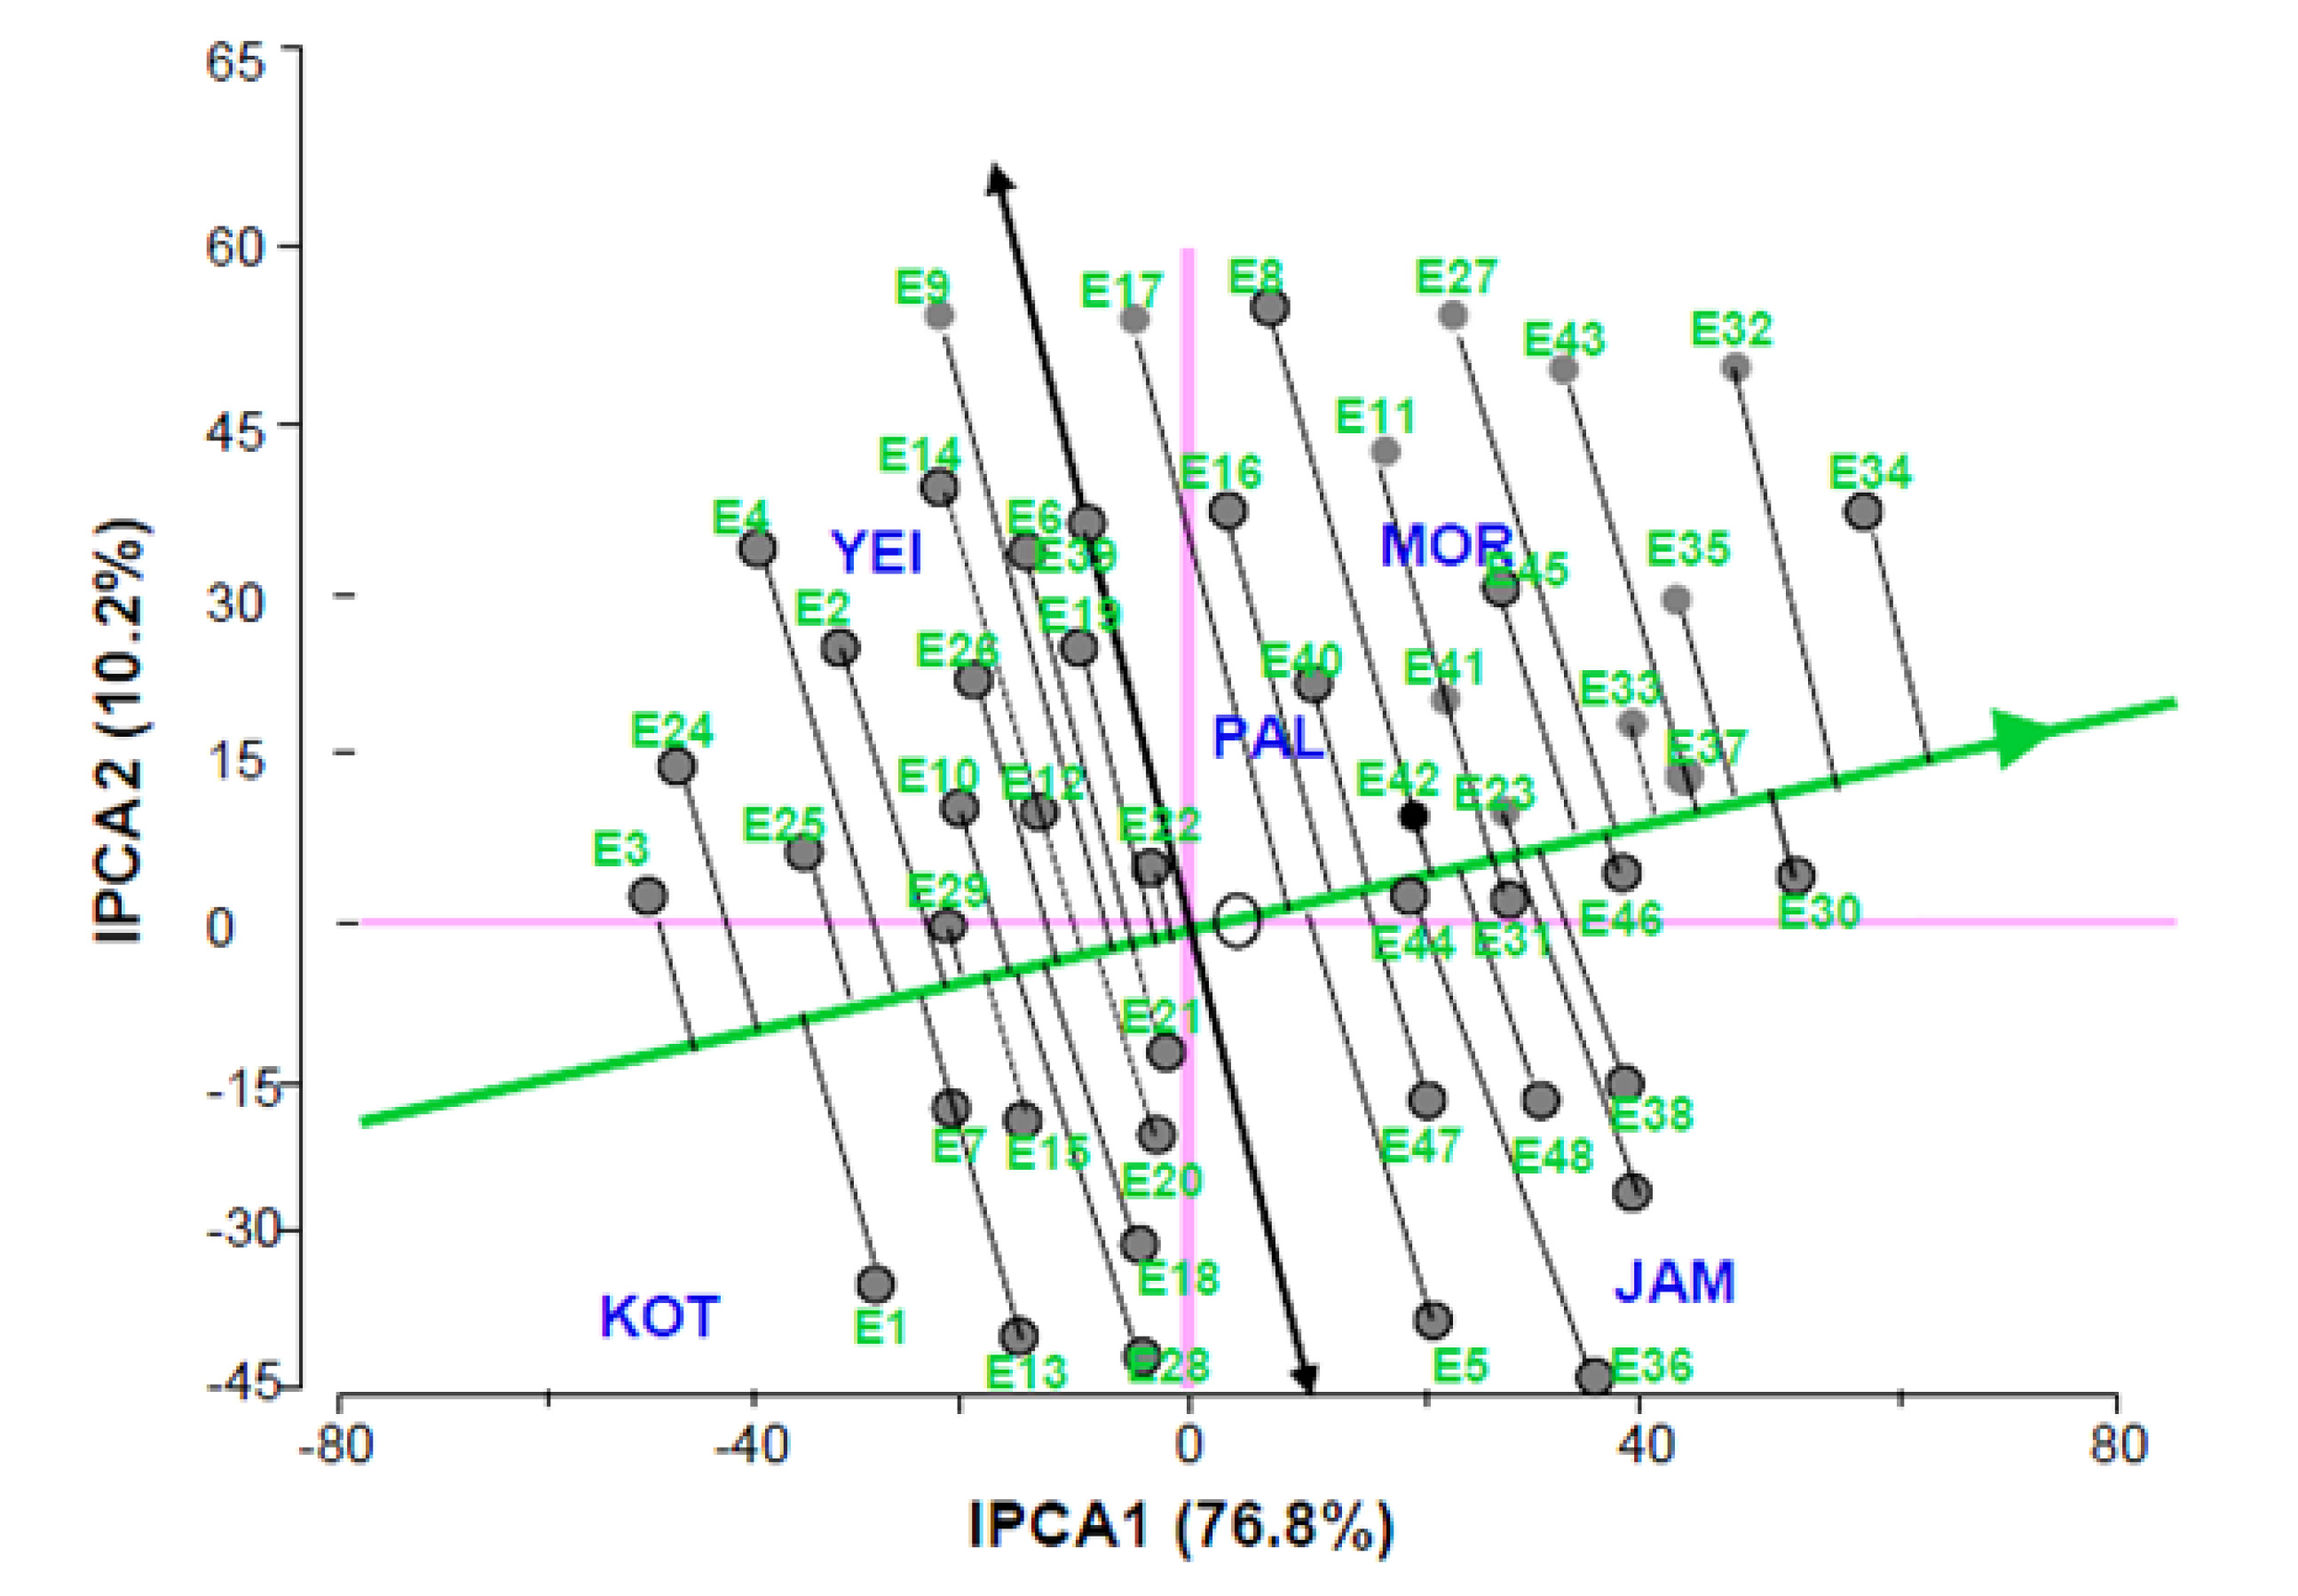
Results of mean performance and stability across environments are visualized by plotting genotypes and locations on the same graph. Associations between the genotypes and the locations are presented in the average-environment coordination (AEC) view of the GGE biplot (
Fig. 2). The green line is the average environment axis (AEA) and arrow on it points to the direction of a high yielding genotype across environments. The grey dots are genotypes and lines connecting genotypes to the AEA are vectors. Length of each vector equals the instability of each genotype (
Ding et al. 2008). The double-arrowed line indicates genotype instability in either direction. The longer the vector the greater the GxE interaction hence genotype instability. The results showed that hybrid E34 yielded the highest followed by hybrids E32 and E30. Hybrid E3 had the lowest mean grain yield (t/ha). Hybrids E9, E17, E8 and E36 were the most unstable, implying that these hybrids yielded higher in some environments and lower in others (
Miranda et al. 2009). Superior hybrids including E30, E37, E33 and E46 had higher yield with good stability across environments. In summary, the GGE biplot showed that large percentage of variation due to GxE interaction was contributed by the IPCA1 (76.8%) and IPCA2 (10.2%).
DISCUSSION
The highly significant variability due to genotype observed in this study implies the great diversity among the genotypes used. In maize breeding, three-way hybrid population is the most diverse compared to other populations. This is because the hybrid is a combination of three different parents. In this study, three-way hybrids were mainly used, meaning the genotypes were of different parental combinations which might have contributed to differences in their mean performances across environments. The current study observed that hybrids had higher grain yield (t/ha) compares to OPV, indicating the high yield potential of hybrid maize. The significant variations (
P ≤ 0.01) detected for most traits due to genotype × location interactions indicates that the genotypes used in the present study did not perform consistently across locations, meaning some genotypes performed better in some locations and worse in others. This observation also implies the need to use AMMI and GGE biplots to decompose the G × E interactions so as to determine the yield potential and stability of the three-way hybrids. Generally, the study found that location contributed more to variation in phenotypic performance than genotype, which confirms the environmental variations between the greenbelt and ironstone plateau agro-ecologies. This shows that the maize genotypes responded differently in the two agro-ecologies. The above findings are consistent with previous reports. Previous study (
Mafouasson et al. 2018) reported greater contribution to variability by environment than by genotype and GxE to performances of single cross hybrids.
Makumbi et al. (2015) reported significant effects of genotype, environment, and GxE for most traits in maize. The authors attributed the observations to differences in performance among the varieties as well as differential response of the varieties at different locations. Variations due year and year × location interactions observed in this study were significant, implying the diversity of the locations and years under study. However, grain yield (t/ha) was not affected by location × year interaction indicating that the genotypes performances due to location × year effect were consistent. Elsewhere,
Nzuve et al. (2013) found highly significant mean squares for grey leaf spot, grain yield and other agronomic traits in some maize inbred lines due to the genotype, environment and genotype by environment interaction. A study in watermelon observed that for all the yield traits evaluated, environment explained most of the variation while genotype and G × E were small (
Dia et al. 2016).
The differences in mean performance observed in this study indicate that genotypes have diverse genetic backgrounds and the test environments have favored some hybrids and OPV such that they over performed the rest of the genotypes. Previous study found significant variations in mean performances among some maize lines for grain yields (t/ha) and disease reactions (
Sibiya et al. 2013). The low to moderate CV values indicate that measurement within one trait did not vary much than the other. Also, the low CV could indicate uniformity of test environments as well as accuracy in measurement of the traits being investigated. The significant variance components ob-served in the current study show that these components have contributed to phenotypic variability of the traits. Significant G × E effects highlight the importance of evaluating each location separately. However, to minimize variation due genotype × location and genotype × location × year interactions, it is necessary to evaluate the genotypes across a number of locations and years respectively. The non-significance of the variance components implies that these components did not affect the phenotypic per-formances for the traits. These findings are in line with another study in a maize population which found that variance components due to environment, replication within environment, line, and environment × line inter-action were significantly different from zero for three foliar diseases (
Zwonitzer et al. 2010). Previous study in maize observed that the genotypic variance (σ
2g) and the genotype × environment variance (σ
2ge) for plant height and ear height were significant in all three F2:3 populations (
Li et al. 2016).
The high broad-sense heritability estimates observed in the current study confirm the importance of genetic effects in phenotypic performances. Therefore, breeding for improvement of maize for the above traits can be realized through recurrent selection in early generations. When heritablility estimate is low, genotypes should be tested for that trait over a wide range of locations so as to increase heritability. The moderately high narrow-sense heritability estimates observed in this study imply that additive gene actions were important for the observed performances. Heritability study found low to high heritability estimates for agronomic traits in maize (
Beyene et al. 2017). Previous study found high broad-sense heritability estimates for agronomic traits ranging from 0.05 to 0.83 under Striga infestation and 0.20 to 0.61 under Striga-free conditions (
Makumbi et al. 2015). Similarly, a study observed high broad-sense heritability estimates for some agronomic traits in sunflower (
Khan et al. 2013). High heritability estimates (0.92) for both plant height and ear height have been reported in maize (
Li et al. 2016).
The strong and positive conrrelations observed in the present study between grain yield and the agronomic traits show that agronomic traits have positively contributed to yield performance. This can also imply that it is possible to indirectly select for yield using any of the agronomic traits under study. The strong but negative correlations between yield and disease scores imply that the dieases have negatively affected mean performance for grain yield. The study also found negtive and weak correlation (‒0.41) between Turcicum leaf blight and anthesis-silking interval, meaning the trait was not strongly affected by Turcicum leaf blight infection. This could be due to the late onset of the disease since TLB infection in maize intensifies two weeks after flowering, a growth stage at which flowering is almost complete. Elsewhere, a report showed negative correlations and regression coefficients between grain yield and number of root lesions, grain yield and P. zeae densities, and grain yield and Meloidogyne spp. densities (
Kagoda et al. 2011). Elsewhere, positive correlations between grain yield with plant height, number of tillers, number of panicles, panicle length, shoot dry weight and harvest index have been reported in rice (
Kanbar et al. 2011).
Total G × E interactions based on AMMI were mainly explined by the first two IPCA main axes IPCA1 (11.3%) and IPCA2 (9.7%), indicating that genotype (IPCA1) and location (IPCA2) contributed most to the GxE effects. Previous report showed that the two interaction principal component axes had contributed to 29.0 (IPCA1) and 20.96 (IPCA2) of G × E interactions and yield stability of single cross hybrid maize (
Mafouasson et al. 2018). The current study observed that some hybrids had high average grain yield and good stability across environments. This implies that these hybrids yielded consistently across the environments. Also these hybrids were located close to each other and near the origin point (zero PCA scores), meaning they are similar and stable (
Yan and Tinker 2006). Further, these hybrids were located within the upper-right side quadrant of the AMMI biplot, confirming their good yield potential, especially in high yielding environments (
Anley et al. 2013).
In summary, commercial hybrid and OPV maize obtained from regional partners were evaluated in five locations across greenbelt and ironstone plateau agro-ecologies of South Sudan for three years (2013-2015). Trials were planted at Palotaka Basic Seeds Centre (EES), Yei Research Centre (CES), Morobo County Agriculture Department (CES), Jambo (WES) and Kotobi (WES). The study focused at identification of superior maize genotypes that could be released to replace the existing low yielding maize cultivars in South Sudan. The 48 genotypes segregated significantly with regards to yield traits and major diseases and pest across locations and years. Six hybrids SC0923, SC719, Longe 6H, Longe 10H, KH500-22A and KH500-46A showed above-average performances for grain yield (t/ha) and resistance to major diseases and pest across environments compared to checks. This study has identified genotypes with vast amount of variability for yield and yield components. Hybrids SC0923, SC719, Longe 6H, Longe 10H, KH500-22A, KH500-46A and OPV (ZM521) were identified as high yielding and best adapted to greenbelt and ironstone plateau zones of South Sudan. These materials can be considered for quick release to farmers in South Sudan. Furthermore, the 42 remaining genotypes showed varying genetic potentials which might have not been realized within the study environments. Thus, further research may be required to test these genetic materials for adaptability to other agro-ecological zones, especially the flood plain zone and Nile Sobat corridor of South Sudan, where maize is a common crop.
SUPPLEMENTARY MATERIALS
ACKNOWLEDGEMENTS
This research was part of Maize Breeding Project AGRA2011PASS057, supported through funding from Howard and Buffet Foundation, implemented by Alliance for Green Revolution in Africa (AGRA). We thank Kenya Agricultural and Livestock Research Organization (KALRO), National Agricultural Research Organization (NARO), and Seed Co. Limited (ZM) for availing planting materials for this study. We also recognize the County Agriculture Departments (CAD) in Morobo (CES) and Mundri (WES) for providing testing sites and collecting data for the experiments.
Fig. 1Agro-ecological zones of South Sudan and major maize growing areas (
FAO/WFP 2016).

Fig. 2GGE biplot ranking of 48 maize genotypes based on mean yield and stability across greenbelt and ironstone plateau zones of South Sudan over three years (2013-2015). The biplots were based on Scaling = 0, Centering = 2, and SVP = 1. The green line is the average environment axis (AEA) and arrow on it points to the direction of a high yielding genotype, the double-arrowed line is genotype instability in either direction, grey dots are the genotypes and lines connecting genotypes to the AEA are vectors, length of each vector equals the instability of each genotype.

Table 1Descriptions of locations used for evaluation of regional maize genotypes for yield and adaptability in South Sudan in 2013-2015.
Table 1
|
Location |
Latitude |
Longitude |
Elevation (masl) |
Rainfall (mm/year) |
Average temp. (℃) |
Agroecology |
Soil type |
Environment |
|
Morobo |
3°41′03.48″ N |
30°46′35.26″ E |
1208 |
1482 |
23.7 |
Greenbelt |
Loamy clay |
Mid altitude |
|
Palotaka |
3°59′04.14″ N |
32°29′25.83″ E |
1027 |
1166 |
25.6 |
Greenbelt |
Loamy clay |
Mid altitude |
|
Yei |
4°05′44.39″ N |
30°40′37.76″ E |
826 |
1336 |
24.6 |
Greenbelt |
Loamy clay |
Mid altitude |
|
Jambo |
5°04′00.15″ N |
30°44′00.20″ E |
627 |
1112 |
26.4 |
Ironstone Plateau |
Sandy clay |
Low altitude |
|
Kotobi |
5°14′42.53″ N |
30°11′58.56″ E |
600 |
1186 |
26.1 |
Ironstone Plateau |
Sandy clay |
Low altitude |
Table 2Mean Squares for yield traits and disease scores obtained from 48 regional maize hybrids and OPV evaluated across greenbelt and ironstone plateau zones over three years (2013-2015) in South Sudan.
Table 2
|
Source of variation |
Df |
Mean squares |
|
SD |
ASI |
PH |
EH |
HC |
FW |
MOIS |
TLB |
MSV |
GLS |
STB |
GY |
|
Location (e) |
4 |
3181.3**
|
943.9 |
7528.81**
|
5744.2**
|
4.5*
|
0.4**
|
1423.0*
|
4.8**
|
132.0**
|
11.0*
|
23.6*
|
1301.0**
|
|
Year (y) |
2 |
1016.8**
|
26.3 |
20812.31 |
1738.5 |
1.2 |
0.6*
|
1210.0 |
1.4*
|
101.6**
|
2.3 |
9.4*
|
926.8*
|
|
Location × year |
8 |
23.7**
|
19.6 |
916.4*
|
336.3**
|
0.7 |
1.0**
|
93.1 |
3.1*
|
78.2*
|
6.3 |
1.7*
|
111.4**
|
|
Rep/location |
10 |
18.4**
|
20.2**
|
573.12**
|
216.0**
|
1.0*
|
0.9*
|
16.8**
|
1.1**
|
21.9*
|
10.2*
|
12.3 |
325.1**
|
|
Genotype (g) |
47 |
26.8**
|
2.9 |
327.07**
|
529.1**
|
3.3**
|
1.7**
|
15.2**
|
2.8**
|
31.8**
|
17.3**
|
20.1 |
278.6**
|
|
G × E |
188 |
21.7**
|
2.1**
|
717.32**
|
287.7**
|
1.1**
|
2.0**
|
7.8**
|
1.6**
|
0.9**
|
0.4**
|
14.9**
|
135.2**
|
|
G × Y |
94 |
15.8 |
6.1 |
537.91*
|
302.4*
|
0.8 |
1.3 |
46.2 |
0.2 |
3.2 |
5.2*
|
0.4 |
21.8 |
|
G × L × Y |
564 |
9.3*
|
3.2 |
211.12*
|
111.7 |
0.6 |
0.8*
|
21.3 |
2.1*
|
1.8 |
0.7 |
11.3*
|
68.3*
|
|
Error (ԑ) |
705 |
9.0 |
2.1 |
318.6 |
217.8 |
0.3 |
0.3 |
7.5 |
0.1 |
0.6 |
1.1 |
0.6 |
136.2 |
|
Total |
1439 |
|
|
|
|
|
|
|
|
|
|
|
|
|
Mean |
|
72.6 |
2.4 |
188.0 |
99.2 |
2.1 |
4.8 |
23.2 |
2.1 |
2.2 |
1.9 |
1.2 |
4.3 |
|
CV (%) |
|
4.2 |
54.9 |
12.5 |
20.1 |
48.0 |
18.7 |
32.1 |
1.8 |
32.0 |
20.2 |
29.3 |
21.6 |
Table 3Mean values of major yield traits and disease scores of selected regional hybrids and OPV compared to standard checks evaluated across greenbelt and ironstone plateau zones over three years (2013-2015) in South Sudan.
Table 3
|
Entry |
Genotype |
SD |
ASI |
PH |
FW |
GLS |
TLB |
MSV |
STB |
GY |
|
E30 |
SC719 |
73 |
1 |
222 |
10.2 |
1.9 |
2.5 |
2.2 |
1.0 |
8.3 |
|
E37 |
KH500-22A |
74 |
2 |
198 |
10.0 |
1.5 |
1.6 |
1.6 |
1.0 |
8.0 |
|
E46 |
KH500-46A |
73 |
3 |
153 |
9.8 |
1.2 |
1.1 |
1.2 |
1.2 |
8.0 |
|
E33 |
Longe 10H |
70 |
1 |
200 |
9.8 |
1.3 |
1.3 |
1.5 |
1.5 |
7.9 |
|
E23 |
SC0923 |
66 |
2 |
180 |
9.7 |
2.0 |
1.8 |
1.2 |
1.0 |
7.7 |
|
E31 |
Longe 6H |
69 |
3 |
212 |
8.8 |
1.6 |
1.5 |
1.6 |
1.0 |
7.2 |
|
E42 |
KH500-35A |
73 |
2 |
191 |
8.5 |
2.2 |
1.9 |
3.0 |
1.0 |
6.8 |
|
E47 |
KH500-47A |
73 |
2 |
182 |
8.0 |
1.8 |
1.8 |
2.5 |
1.3 |
6.4 |
|
E44 |
KH500-44A |
73 |
2 |
197 |
8.1 |
1.6 |
1.3 |
1.5 |
1.0 |
6.4 |
|
E21 |
ZM521 |
73 |
3 |
187 |
5.0 |
2.1 |
1.6 |
2.7 |
1.2 |
3.9 |
|
Checks |
|
E2 |
Longe 5 |
69 |
2 |
202 |
4.6 |
1.8 |
1.6 |
2.2 |
1.0 |
3.1 |
|
E1 |
Loca cultivar |
67 |
3 |
181 |
1.2 |
2.5 |
3.5 |
2.3 |
2.7 |
0.6 |
|
Mean |
72.6 |
2.4 |
188 |
4.8 |
1.9 |
2.1 |
2.2 |
1.2 |
3.9 |
|
C.V (%) |
4.2 |
54.9 |
12.5 |
18.7 |
20.2 |
1.8 |
32 |
29.3 |
23.5 |
|
LSD (5%) |
6.1 |
2.9 |
33.1 |
1.0 |
0.8 |
0.8 |
1.6 |
0.6 |
1.3 |
|
S.E |
3.0 |
1.4 |
11.4 |
0.5 |
0.4 |
1.9 |
0.8 |
0.3 |
1.1 |
Table 4Variance components and their interactions with locations and years; and heritabiity estimates for yield traits and disease scores obtained from 48 regional and local maize genotypes evaluated across greenbelt and ironstone plateau zones over three years (2013-2015) in South Sudan.
Table 4
|
Variance component |
SD |
ASI |
PH |
FW |
MOIS |
TLB |
MSV |
GLS |
STB |
GY (t/ha) |
|
σ2g
|
0.3**
|
0.2 |
9.0**
|
0.1**
|
1.3**
|
0.1**
|
0.1**
|
0.2**
|
0.2**
|
3.3**
|
|
σ2ge
|
1.6**
|
0.2 |
55.3**
|
0.1**
|
1.0*
|
0.2**
|
0.1*
|
0.1**
|
2.6**
|
17.0**
|
|
σ2gey
|
0.2 |
0.1*
|
53.7*
|
0.3*
|
4.9 |
0.3*
|
0.6 |
0.2 |
0.1*
|
20.9**
|
|
σ2ε
|
9.0 |
2.1 |
211.2 |
0.3 |
7.5 |
0.1 |
0.6 |
0.4 |
0.6 |
26.8 |
|
H2
|
86.3 |
78.1 |
82.5 |
64.8 |
71.4 |
80.2 |
76.9 |
83.8 |
80.4 |
77.3 |
|
h2
|
50.2 |
42.7 |
53.5 |
38.1 |
45.7 |
39.1 |
44.6 |
52.2 |
47.3 |
41.9 |
|
SEσ2g
|
0.02 |
0.01 |
0.21 |
0.12 |
1.02 |
0.01 |
0.05 |
1.04 |
0.03 |
0.03 |
|
SEH2
|
0.09 |
0.07 |
0.04 |
0.05 |
0.41 |
0.02 |
0.07 |
0.20 |
0.05 |
1.10 |
|
SEh2
|
0.02 |
0.02 |
0.01 |
0.03 |
0.21 |
0.01 |
0.01 |
1.03 |
0.01 |
0.07 |
Table 5Phenotypic correlation among some yield traits and disease scores obtained from 48 regional maize hybrids and local culrtivars evaluated across greenbelt and ironstone plateau zones over three years (2013-2015) in South Sudan.
Table 5
|
Silking date (SD) |
Anthesis-silking interval (ASI) |
Plant height (PH) |
Ear aspect (EA) |
Field weight (FW) |
Moisture content (MOIS) |
Turcicum leaf bight (TLB) |
Maize streak virus (MSV) |
Gray leaf spot (GLS) |
Stem borer (STB) |
Grain yield (t/ha) (GY) |
|
Silking date (SD) |
1 |
|
|
|
|
|
|
|
|
|
|
|
Anthesis-silk interval (ASI) |
0.81** |
1 |
|
|
|
|
|
|
|
|
|
|
Plant height (PH) |
0.63** |
0.74** |
1 |
|
|
|
|
|
|
|
|
|
Ear aspect (EA) |
0.58* |
0.86** |
0.73** |
1 |
|
|
|
|
|
|
|
|
Field weight (FW) |
0.69** |
0.70** |
0.78** |
0.77** |
1 |
|
|
|
|
|
|
|
Moisture content (MOIS) |
0.73** |
0.45* |
0.84** |
0.91** |
0.83** |
1 |
|
|
|
|
|
|
Turcicum leaf bight (TLB) |
‒0.52* |
‒0.41 |
‒0.63** |
‒0.68** |
‒0.57** |
‒0.76** |
1 |
|
|
|
|
|
Maize streak virus (MSV) |
‒0.91** |
‒0.68* |
‒0.87** |
‒0.65** |
‒0.85** |
‒0.72** |
0.83** |
1 |
|
|
|
|
Gray leaf spot (GLS) |
‒0.58* |
‒0.84** |
‒0.69** |
‒0.86** |
‒0.68** |
‒0.95** |
0.74** |
0.66** |
1 |
|
|
|
Stem borer (STB) |
‒0.32 |
‒0.41 |
‒0.53* |
‒0.82** |
‒0.78** |
‒0.87** |
0.85** |
0.71** |
0.82** |
1 |
|
|
Grain yield (t/ha) (GY) |
0.88** |
0.79** |
0.75** |
0.71** |
0.81** |
0.66** |
‒0.79** |
‒0.88** |
‒0.78** |
‒0.85** |
1 |
Table 6Results of AMMI analysis for yield traits and disease scores obtained from 48 regional maize hybrids and local culrtivars evaluated across greenbelt and ironstone plateau zones over three years (2013-2015) in South Sudan.
Table 6
|
Source of variation |
DF |
Sum of squares |
Mean squares |
Contribution to total variation (%) |
G × E explained (%) |
|
Replication (R) |
1 |
18.6 |
18.6 |
0.2 |
|
|
Genotype (G) |
47 |
625.1 |
13.3**
|
6.8 |
|
|
Location (E) |
4 |
142.8 |
35.7**
|
0.4 |
|
|
G × E interactions |
188 |
488.8 |
2.6**
|
|
|
|
IPCA1 |
50 |
55.0 |
1.1 |
|
11.3 |
|
IPCA2 |
48 |
38.4 |
0.8 |
|
9.7 |
|
Residual |
90 |
36.0 |
0.4 |
|
5.4 |
|
Pooled error |
239 |
2676.8 |
11.2 |
|
|
|
Total |
906 |
|
|
|
|
References
- Abubakar L, Ado S. 2009. Genotype × Environment Inter-action for Resistance to Purple Blotch (Aternaria Porri L. (Ellis) Cif.) in Onion (Allium Cepa L.) in Nigeria. Asian J. Res. Crop. Sci.. 1(1): 15-25.
- Anley W, Zeleke H, Dessalegn Y. 2013. Genotype × Environ-ment Interaction of Maize (Zea Mays L.) across North Western Ethiopia. J. Plant Breed. Crop Sci.. 5(9): 171-181.
- Awata LAO, Tongoona P, Danquah E, Efie BE. Marchelo-dragga PW2018. Common Mating Designs in Agricultural Research and Their Reliability in Estimation of Genetic Parameters. IOSR J. Agric. Vet. Sci. 11(7): 16-36.
- Awata LAO, Tongoona P, Danquah E, Ifie BE, Suresh LM, Jumbo MB, et al. 2019. Understanding tropical maize (Zea mays L.): The major monocot in modernization and sustainability of agriculture in sub-Saharan Africa. International Journal of Advance Agricultural Research. 7: 32-77.
- Bationo A, Hartemink A, Lungu O, Naimi M, Okoth P, Smaling E, et al. 2006. African Soils: Their Productivity and Profitability of Fertilizer Use. The Africa Fertilizer Summit. Abuja, Nigeria.
- Belfield S, Brown C. 2008. Field Crop Manual: Maize a Guide to Upland Production in Cambidia. New South Wales. U. K.
- Betran FJ, Hallauer AR. 1996. Variability in Three Hybrid Maize Populations. J. Hered.. 87(4): 319-328.
- Beyene Y, Gowda M, Stephen M, Suresh LM, Olsen M, Oikeh SO, et al. 2017. Genetic Analysis of Tropical Maize Inbred Lines for Resistance to Maize Lethal Necrosis Disease. Euphytica. 213(224): 1-13.
- Binyason S, Baka S, Marchelo-d'Ragga P, Deng A. 2017. An Episode of the Fall Armyworm, Spodosptera frugiperda Smith., Outbreak on Maize Crop in Magwi County of Imatong State, Republic of South Sudan. In: In 22nd Meeting and Conference of the African Association of Insect Scientists; Wad Medani, Sudan.
- Brown J, Caligari PDS. 2008. An Introduction to Plant Breeding. Blackwell Publishing. Oxford, U. K:
- Chokerah J, Horvath B. 2012. Investing in Agriculture for Food Security and Economic Transformation. UNDP. Juba, South Sudan.
- Diao X, You L, Alpuerto V, Folledo R. 2012. Assessing Agricultural Potential in South Sudan - A Spatial Analysis Method. Application of Geographic Information System. pp. 139-
- Dia M, Wehner TC, Hassell R, Price DS, Boyhan GE, Olson S, et al. 2016. Genotype × Environment Interaction and Stability Analysis for Watermelon Fruit Yield in the United States. Crop Sci.. 56(4): 1645-1661.
- Ding M, Tier B, Yan W, Wu H X, Powell MB, McRae T. 2008. Application of the GGE Biplot to Evaluate Genotype, Environment and GxE Interaction on P . Radiata: A Case Study GGE Biplot Application. N. Z. J. For. Sci.. 38(1): 132-142.
- du Plessis J. 2003. Maize Production. Department of Agriculture. Pretoria, South Africa.
- FAO/WFP.2016. Crop and Food Security Assessment Mission to South Sudan. FAO/WFP. Juba, South Sudan.
- Food Security Technical Secretariat2009. Southern Sudan Agro Meteorological Update Food Security Technical Secretariat. Juba, South Sudan.
- Gollob H. 1968. A statistical model which combines features of factor ana-lytic and analysis of variance techniques. Psychometrika. 33: 73-115.
- Hoopen EM, Maiga A. 2012. Maize Production and Processing. CTA and ISF. Wageningen, Netherlands.
- Jenkin R, Howard W, Thomas P, Abell T, Deane G. 1977. Land Resource Study: Forestry Development Prospects in the Imatong Centraal Foret Reserve, Southern Sudan. Ministry of Overseas Development. Surbiton, U. K.
- Kagoda F, Derera J, Tongoona P, Coyne DL, Talwana HL. 2011. Grain Yield and Heterosis of Maize Hybrids under Nematode Infested and Nematicide Treated Conditions. J. Nematol.. 43(3-4): 209-219.
- Kanbar A, Kondo K, Shashidhar H. 2011. Comparative Efficiency of Pedigree, Modified Bulk and Single Seed Descent Breeding Methods of Selection for Developing High-Yielding Lines in Rice (Oryza Sativa L.) under Aerobic. Journal of Plant Breeding. 2: 184-193.
- Khan H, Rehman HU, Bakht J, Khan SA, Hussain I, Khan A, et al. 2013. Genotype × Environment Interaction and Heritability Estimates for Some Agronomic Characters in Sunflower. J. Anim. Plant Sci.. 23(4): 1177-1184.
- Kumar P, Singh NK. 2015. Determining Hehaviour of Maize Genotypes and Growing Environments Using AMMI Statistics. SAARC Journal of Agriculture. 13(1): 162-173.
- Li X, Zhou Z, Ding J, Wu Y, Zhou B, Wang R, et al. 2016. Combined Linkage and Association Mapping Reveals QTL and Candidate Genes for Plant and Ear Height in Maize. Front. Plant Sci.. 7: 1-11.
- Mafouasson H, Gracen V, Yeboah M, Ntsomboh-Ntsefong G, Tandzi L, Mutengwa C. 2018. Genotype-by-Environment Interaction and Yield Stability of Maize Single Cross Hybrids Developed from Tropical Inbred Lines. Agronomy. 8(5): 62
- Makumbi D, Diallo A, Kanampiu F, Mugo S, Karaya H. 2015. Agronomic Performance and Genotype × Environment Interaction of Herbicide-Resistant Maize Varieties in Eastern Africa. Crop Sci.. 55: 540-555.
- Masuka B, Atlin GN, Olsen M, Magorokosho C, Labuschagne M, Crossa J, et al. 2017. Gains in Maize Genetic Improvement in Eastern and Southern Africa. Crop Sci.. 57: 168-179.
- Miranda GV, Souza LV, De Guimarães LJM, Namorato H, Oliveira LR, Soares MO. 2009. Multivariate Analyses of Genotype x Environment Interaction of Popcorn. Pesqui. Agropecu. Bras.. 44(1): 45-50.
- Moore KJ, Dixon PM. 2015. Analysis of Combined Experiments Revisited. Agronmy Journal. 107(2): 763-771.
- Neisse AC, Kirch JL, Homgyu K. 2018. AMMI and GGE Biplot for genotype × environment interaction: a medoid-based hierarchical cluster analysis approach for high dimensional data. Biometrical Letter. 55(2): 97-121.
- Nzuve F, Githiri S, Mukunya D, Gethi J. 2013. Combining Abilities of Maize Inbred Lines for Grey Leaf Spot (GLS), Grain Yield and Selected Agronomic Traits in Kenya. J. Plant Breed. Crop. Sci.. 5(3): 41-47.
- Odero AN. 2006. Livelihood Characterisation of South Sudan: The Use of Physiographic and Agro-Climatic Layers. Vulnerability Analysis and Mapping Unit World Food Programme. Khartoum, Sudan.
- Odiyo O, Njoroge K, Chemining G, Beyene Y. 2014. Performance and Adaptability of Doubled Haploid Maize Testcross Hybrids under Drought Stress and Non-Stress Conditions. International Research Journal of Agricultural Science and Soil Science. 4(8): 150-158.
- Ott R, Longnecker M. 2010. Introdution to Statistical Methods and Data Analysis. Macmillan Publishing Solutions. Belmont, CA, U. S. A.
- SAS institute Inc2016. SASⓇ 9.4 Intelligence Platform: Data Administration Guide SAS Institute Inc.. Cary, NC, U. S. A.
- Sibiya J, Tongoona P, Derera J. 2013. Combining Ability and GGE Biplot Analyses for Resistance to Northern Leaf Blight in Tropical and Subtropical Elite Maize Inbred Lines. Euphytica.. 191(2): 245-257.
- Van Noordwijk M. 1984. Ecology Textbook for the Sudan. Grafische Kring Groningen. Amsterdam, Netherlands.
- Yan W, Tinker NA. 2006. Biplot Analysis of Multi-Environment Trial Data: Principles and Applications. Can. J. Plant Sci.. 86(3): 623-645.
- Ziyomo C, Bernardo R. 2013. Drought Tolerance in Maize: Indirect Selection through Secondary Traits versus Genomewide Selection. Crop Sci.. 53(4): 1269-1275.
- Zwonitzer JC, Coles ND, Krakowsky MD, Arellano C, Holland JB, McMullen MD, et al. 2010. Mapping Resistance Quantitative Trait Loci for Three Foliar Diseases in a Maize Recombinant Inbred Line Population - Evidence for Multiple Disease Resistance? Phytopathology. 100(1): 72-79.