Abstract
Rice culm is an important trait for determining rice lodging yield, and stem diameter has been suggested as a yield-related trait; however, studies for the genetic basis of its phenotypic variation are still required. In this study, we used 160 recombination inbred lines derived from a cross of two different rice varieties [‘Milyang23’ (Tongil rice) and ‘Giho’ (japonica)] for quantitative trait locus (QTL) mapping with nine stem traits. The analysis showed that QTLs for the diameters of the first, second, third and fourth internode traits were independently separated in the top of chromosome 1, whereas four lengths of internodes were estimated as being related to the semidwarf1 (sd1) gene. A major-effect QTL (q2ID1) was identified that the overlapped region of our previous mapping with a large genomic region. Therefore, we performed high-resolution genetic mapping for fine-mapping of q2ID1 to a ~140 kb region between Ind1_1 and Ind1_2 of genetic markers, with candidate genes predicted using a reference genome. We ultimately identified nine of the 15 candidate genes with specific gene functions and analyzed the sequence variations between two parents. These results offer valuable gene and/or genetic information on stem diameter to improve lodging resistance and yield.
-
Key words: Rice, Lodging resistance, Stem diameter, QTL mapping, Candidate genes
INTRODUCTION
Rice (
Oryza sativa L.) is one of the most important food crops in the world, and rice production has rapidly changed because of the ‘Green Revolution’. In the 1960s, rice productivity was significantly increased by the widespread use of semi-dwarf varieties (
Khush 1999). These dwarf varieties consisting of the
semidwarf 1 (
sd1) gene were introduced from the Chinese variety ‘Dee-Geo-Woo-Gen’ and crossed with ‘Peta’, which is a tall plant, in order to develop the new high-yielding semi-dwarf cultivar ‘IR8’ (
Khush 2001;
Sasaki et al. 2002;
Spielmeyer et al. 2002). The advent of the
sd1 gene enables resistance to lodging from shortened culms and response to high fertilizer inputs and a greater harvest index for producing high yields (
Takai et al. 2013). In Korea, Tongil rice (IR667-98-1-2) was the first semi-dwarf variety produced by a three-way cross of
indica/japonica types in 1972 (
Kim et al. 2014). The development of Tongil rice resulted in an increase in rice production, which promoted the ‘Green Revolution’ in South Korea.
In rice breeding, lodging resistance is an essential factor that affects the environment in order to achieve high grain yield (
Setter et al. 1997). Various stem-related traits for lodging resistance are important parameters, because phenotypes are determined by morphological components that increase basal internode lengths and thickness (
Ookawa and Ishihara 1992;
Zuber et al. 1999;
Kashiwagi and Ishimaru 2004). Severe lodging prevents the transport of water and nutrients and assimilation through the xylem and phloem, resulting in reduced assimilation to grain filling (
Isham et al. 2007). Lodging often occurs at the lower internodes; hence, the lengths of basal internodes are particularly associated with
sd1 and inhibited elongation of the lower stem (
Zhu et al. 2008). Furthermore, stem-weight and -diameter traits directly correlate with lodging resistance to improve physical strength (
Kashiwagi et al. 2008;
Yano et al. 2015).
Molecular markers have been developed for map construction, QTL analysis, and genome-wide association studies. Previous rice studies reported QTL mapping based on restriction fragment length polymorphisms (RFLPs), randomly-amplified polymorphic DNA (RAPD), amplified fragment length polymorphisms (AFLPs), simple sequence repeats (SSRs), and cleaved amplified polymorphic sequence (CAPS) (
Bernado 2008;
Varshney et al. 2009). However, the validation and functional characterization of QTLs and genes are still required, as most of them are located in large genomic regions with limited low-density markers, and they do not provide accurate QTL information capable of controlling lodging-related traits (
Wang et al. 2011). Therefore, development of additional molecular markers is necessary to fine map or clone genes associated with important agronomical traits based on a high-resolution genetic map (
Zhang et al. 2021).
The advent of next-generation sequencing (NGS) technologies has enabled high-throughput genotyping and analysis for defining genome structure in various plant cultivars using fast and cost-effective platforms (
Huang et al. 2009). Among NGS platforms, resequencing is an actively utilized approach that uses a reference genome to construct a genetic map and perform QTL/gene identification in many plants (
McNally et al. 2009). Most genome analyses are based on DNA sequences, such as single nucleotide polymorphisms (SNPs) and inser-tion-deletion (InDel), that are widely used for genetic analysis and marker development (
Kim et al. 2014). The detection of DNA polymorphisms by NGS enables effective comparison of sequences and genome structure and has been applied for identifying genetic variations, genetic map construction, and QTL/gene detection (
Guo et al. 2014).
In our previous study, we reported the detection of a major QTL within a large area related to stem diameter in the 160 recombinant inbred lines derived from a cross between ‘Milyang23’ and ‘Giho’ (MGRILs) (
Lee et al. 2016). This QTL region also reportedly affects multiple traits, such as yield (
Kashiwagi et al. 2008); however, it remains to be determined whether this QTL region corresponds to a single gene that affects multiple traits. To resolve the target genomic region of chromosome 1, we analyzed QTLs for stem traits to determine phenotypic relationships and used for fine-mapping and candidate gene prediction based on a high-resolution map created by resequencing MGRILs (
Lee et al. 2020). These findings provide useful genetic information of QTLs/genes associated with stem traits, which will enhance rice breeding programs.
MATERIALS AND METHODS
Plant materials
Two different rice types [‘Milyang23’ (M; a three-way cross of
indica and
japonica rice varieties known as the Tongil-type) and ‘Giho’ (G;
japonica rice)] were initially crossed in 1988 (
Fig. 1).
The population of 160 RILs was derived from a cross between two parental lines generated over F
25 and maintained at the National Institute of Agricultural Sciences (Jeonju, Republic of Korea) (
Lee et al. 2020). Two parental lines explained the genetic differences in rice types, such as length, diameter, and yield, providing the segregation of marker alleles for important agronomical QTLs and genes in RILs (
Cho et al. 1998;
Cho et al. 2007).
Rice seeds were sown in a pot, as described in our previous study (
Lee et al. 2020). At the harvest stage, nine stem traits were investigated using MGRILs, including lengths of the first (1IL), second (2IL), third (3IL), fourth (4IL) internodes; diameters of the first (1ID), second (2ID), third (3ID), fourth (4ID) internodes and culm length (CL), with three replicates. To compare the differences of stem traits, the length of main culm data was used from
Lee et al. (2020). The length of stem internodes was measured in centimeters from both ends of each internodes and diameter was determined in millimeter for the thickest location of each stem, respectively. The descriptive statistics and histograms were generated, and correlation analyses performed using phenotype data by Microsoft Excel 2016 (Microsoft Corp., Redmond, WA, USA) or R software (
R Core Team, 2013).
A genetic map for the MGRIL population was constructed by resequencing data and comprised 3,563 SNP markers from our previous study (
Lee et al. 2020). QTL analysis was performed using Windows QTL Cartographer (v.2.5) (
Wang et al. 2012). Composite interval mapping (CIM) analysis was performed using a walk speed of 1 cM and >3.0 logarithm of odds (LOD) threshold parameters, which provided estimates of additive effects and explained the percentage of phenotypic variance (PVE). QTL detection according to its LOD peak was determined by 1,000 permutations with a 95% confidence interval. To analyze phenotypic relationships (their interactions) between stem length and diameter, epistatic effects of QTLs were determined with a LOD threshold ≥ 4.0, and a
P < 0.0001 using IciMapping (v.4.1) (
Meng et al. 2015). All named QTLs are followed by the initial ‘
q’ (denotes ‘QTL’), followed by the trait name with the rice chromosome number (
McCouch and Cgsnl 2008).
To narrow down a target QTL region, two additional InDel markers were amplified from the genomic DNA (gDNA) of MGRILs (
Supplementary Table S1). Primers were designed using CLC Genomic Workbench (v.6.0; CLC Bio, Aarhus, Denmark) according to InDel regions from two different rice varieties (‘Milyang23’ and ‘Giho’). InDel sequences were designed between 500 bp of both the left and right flanking sequences for the forward and reverse primers. Polymerase chain reactions (PCR) was conducted in a total volume of 10 µL and contained 10 ng of gDNA, 0.2 mM of forward and reverse primers, and the Ex-Taq polymerase (Takara, Shiga, Japan) and under the following cycling conditions: initial denaturation at 95°C for 3 minutes, followed by 32 cycles of denaturation at 95°C for 30 seconds, annealing at 61°C for 30 seconds, extension at 72°C for 30 seconds and a final extension at 72°C for 2 minutes. The amplified products were visu-alized on a 1.5% (w/v) agarose gel.
The genotype from recombinant plants was selected between flanking markers involving the interval at 95% probability of QTL region. For one-way analysis of variance (ANOVA), the observed data from plant materials was used to test the phenotypic differences between three RILs and two parental lines using R software (
R Core Team, 2013). Tukey’s tests for multiple comparisons were performed for the genetic analysis. Statistical analysis for mean comparison was performed at the 0.05 significance level.
To predict candidate genes from the target QTL region, we used the genome browser from Rice Annotation Project Database (RAP-DB;
http://rapdb.dna.go.jp/) to annotate genes from the ‘Nipponbare’ reference genome (IRGSP- 1.0). Candidate gene detection and sequence variances identification were analyzed between ‘Milyang23’ and ‘Giho’. A previous study aligned resequencing data to the ‘Nipponbare’ reference sequence, which identified SNPs and InDels within this population (
Lee et al. 2020). According to these SNPs and InDels, sequence variances were classified into 5ʹ untranslated regions (UTRs), coding sequences (CDSs), 3ʹ UTRs and introns, respectively.
RESULTS
Phenotypic variation in stem traits
We identified phenotypic variations in nine stem traits in two parental lines and their 160 RILs (
Table 1). The 160 RILs exhibited substantial variations, which resulted in all traits displaying transgressive segregation. ‘Milyang23’ (tongil rice) has a shorter culm and thicker diameter than ‘Giho’ (
japonica) due to the presence of the
sd1 gene in an
indica rice variety (
Kim et al. 2014). Additionally, ‘Milyang23’ showed higher 4IL, 1ID, 2ID, 3ID and 4ID, and lower 1IL, 2IL, 3IL and CL traits than ‘Giho’. The coefficients of variation was calculated as 16.88%, 22.26%, 31.07%, 39.65% for each stem internode lengths (1IL, 2IL, 3IL and 4IL), 16.15%, 13.52%, 12.95%, 13.69% for each stem internode diameters (1ID, 2ID, 3ID and 4ID), and 20.56% for CL. Moreover, we observed a positive correlation among the four IL and ID traits (
P < 0.001) (
Table 2). Among the IL traits, 1IL was correlated with all eight stem traits, whereas 4IL showed a negatively correlation with 1ID and 2ID (r = ‒0.096 and ‒0.040), respectively. For the CL, we observed a highly positive correlation between four ILs (
P < 0.001) but a less correlation at four IDs (
P ≤ 0.01). The values for 3ID and 4ID (r = 0.865) was the most, and those for 4IL and 2ID (r = ‒0.040) was least at correlation analysis in this population.
We integrated the genetic map generated by
Lee et al. (2020) and the phenotypic data of stem traits from the present study for QTL analysis, resulting in identification of 30 QTLs for nine stem traits (
Table 3). For four IL traits, a total of 11 QTLs were detected in chromosomes 1, 5, 8, 9 and 10, with PVEs and LOD values ranging from 3.67% to 51.10% and 3.53 to 30.07, respectively. Three QTLs for 1IL were identified in chromosomes 1, 5 and 9 (
q1IL1,
q1IL5 and
q1IL9) with PVEs of 20.65%, 19.63% and 4.64%, respectively. For 2IL, three QTLs in chromosomes 1 and 8 were detected with PVEs of 51.10%, 46.88% and 4.17%. Additionally, two QTLs (
q3IL1 and
q3IL5) for 3IL located in chromosomes 1 and 5 accounted for LOD values of 30.07 and 5.48, respectively, and in the 4IL trait, three QTLs were detected on chromosomes 1 and 10, accounting for LOD values of 8.43, 28.81 and 3.75.
A total of 15 QTLs were identified among four IDs and showed PVEs and LOD values ranging from 6.30% to 21.24% and 3.36 to 11.02, respectively. Among these, four QTLs in the 1ID trait (q1ID1, q1ID5.1, q1ID5.2 and q1ID6) were located at chromosomes 1, 5 and 6, with PVEs of 8.93%, 15.45%, 21.24% and 8.50%, respectively. For 2ID, four QTLs were detected in chromosomes 1, 4 and 5, with LOD values of 3.83, 3.95, 4.00 and 5.47 in each QTL. Three QTLs in chromosomes 5, 8 and 10 were detected for 3ID, with LOD values and PVEs ranging from 6.30% to 10.86% and 3.36 to 5.77, respectively. For 4ID, four QTLs showed LOD values of 4.13, 4.94, 4.82 and 3.39, and PVEs of 8.08%, 9.56%, 9.36% and 6.72%, respectively.
For the CL, a total of four QTLs were located at chromosomes 1, 5 and 6, with LOD values and PVEs ranging from 5.68 to 40.88 and 4.62% to 57.50%, respectively. Among all QTLs, qCL1, had relatively higher LOD values and PVEs.
These findings showed that two regions in chromosome 1, containing four QTLs (q1ID1, q2ID1, q4ID1.1 and q4ID1.2) and six QTLs (q1IL1, q2IL1.1, q2IL1.2, q3IL1, q4IL1.2 and qCL1) which mapped in each multiple region, respectively. Among these QTLs, six QTLs for length of internode and culm had high LOD values which overlapped with the sd1 gene region (Chr 1: 38,190,000 bp to 38,850,000 bp).
Epistatic QTLs
Stem is a complex trait, and epistatic effects of QTLs might exist between their different QTL interactions. Therefore, we analyzed the effects of epistatic QTLs for ILs, IDs and the CL in the MGRIL population (Supple-mentary Table S2). A total of seven epistatic QTLs (LOD ≥ 4.0) were detected and located in chromosomes 1, 2, 4, 5, 6 and 7, including four ILs, two IDs and one CL in each trait. These QTLs accounted for PVEs ranging from 5.34% to 23.69%. Three QTL interactions in chromosomes 1 and 5 affected by 1IL, 2IL and CL involved same flanking markers between Chr1_4303 and Chr1_4317 in chromo-some 1; however, we identified no QTL interactions in the 3IL, 1ID and 3ID traits in MGRIL populations.
Fine-mapping and candidate gene analysis
We focused on the
q2ID1 locus, because this region was repeatedly detected in our previous study (
Lee et al. 2016). To screen candidate genes in the
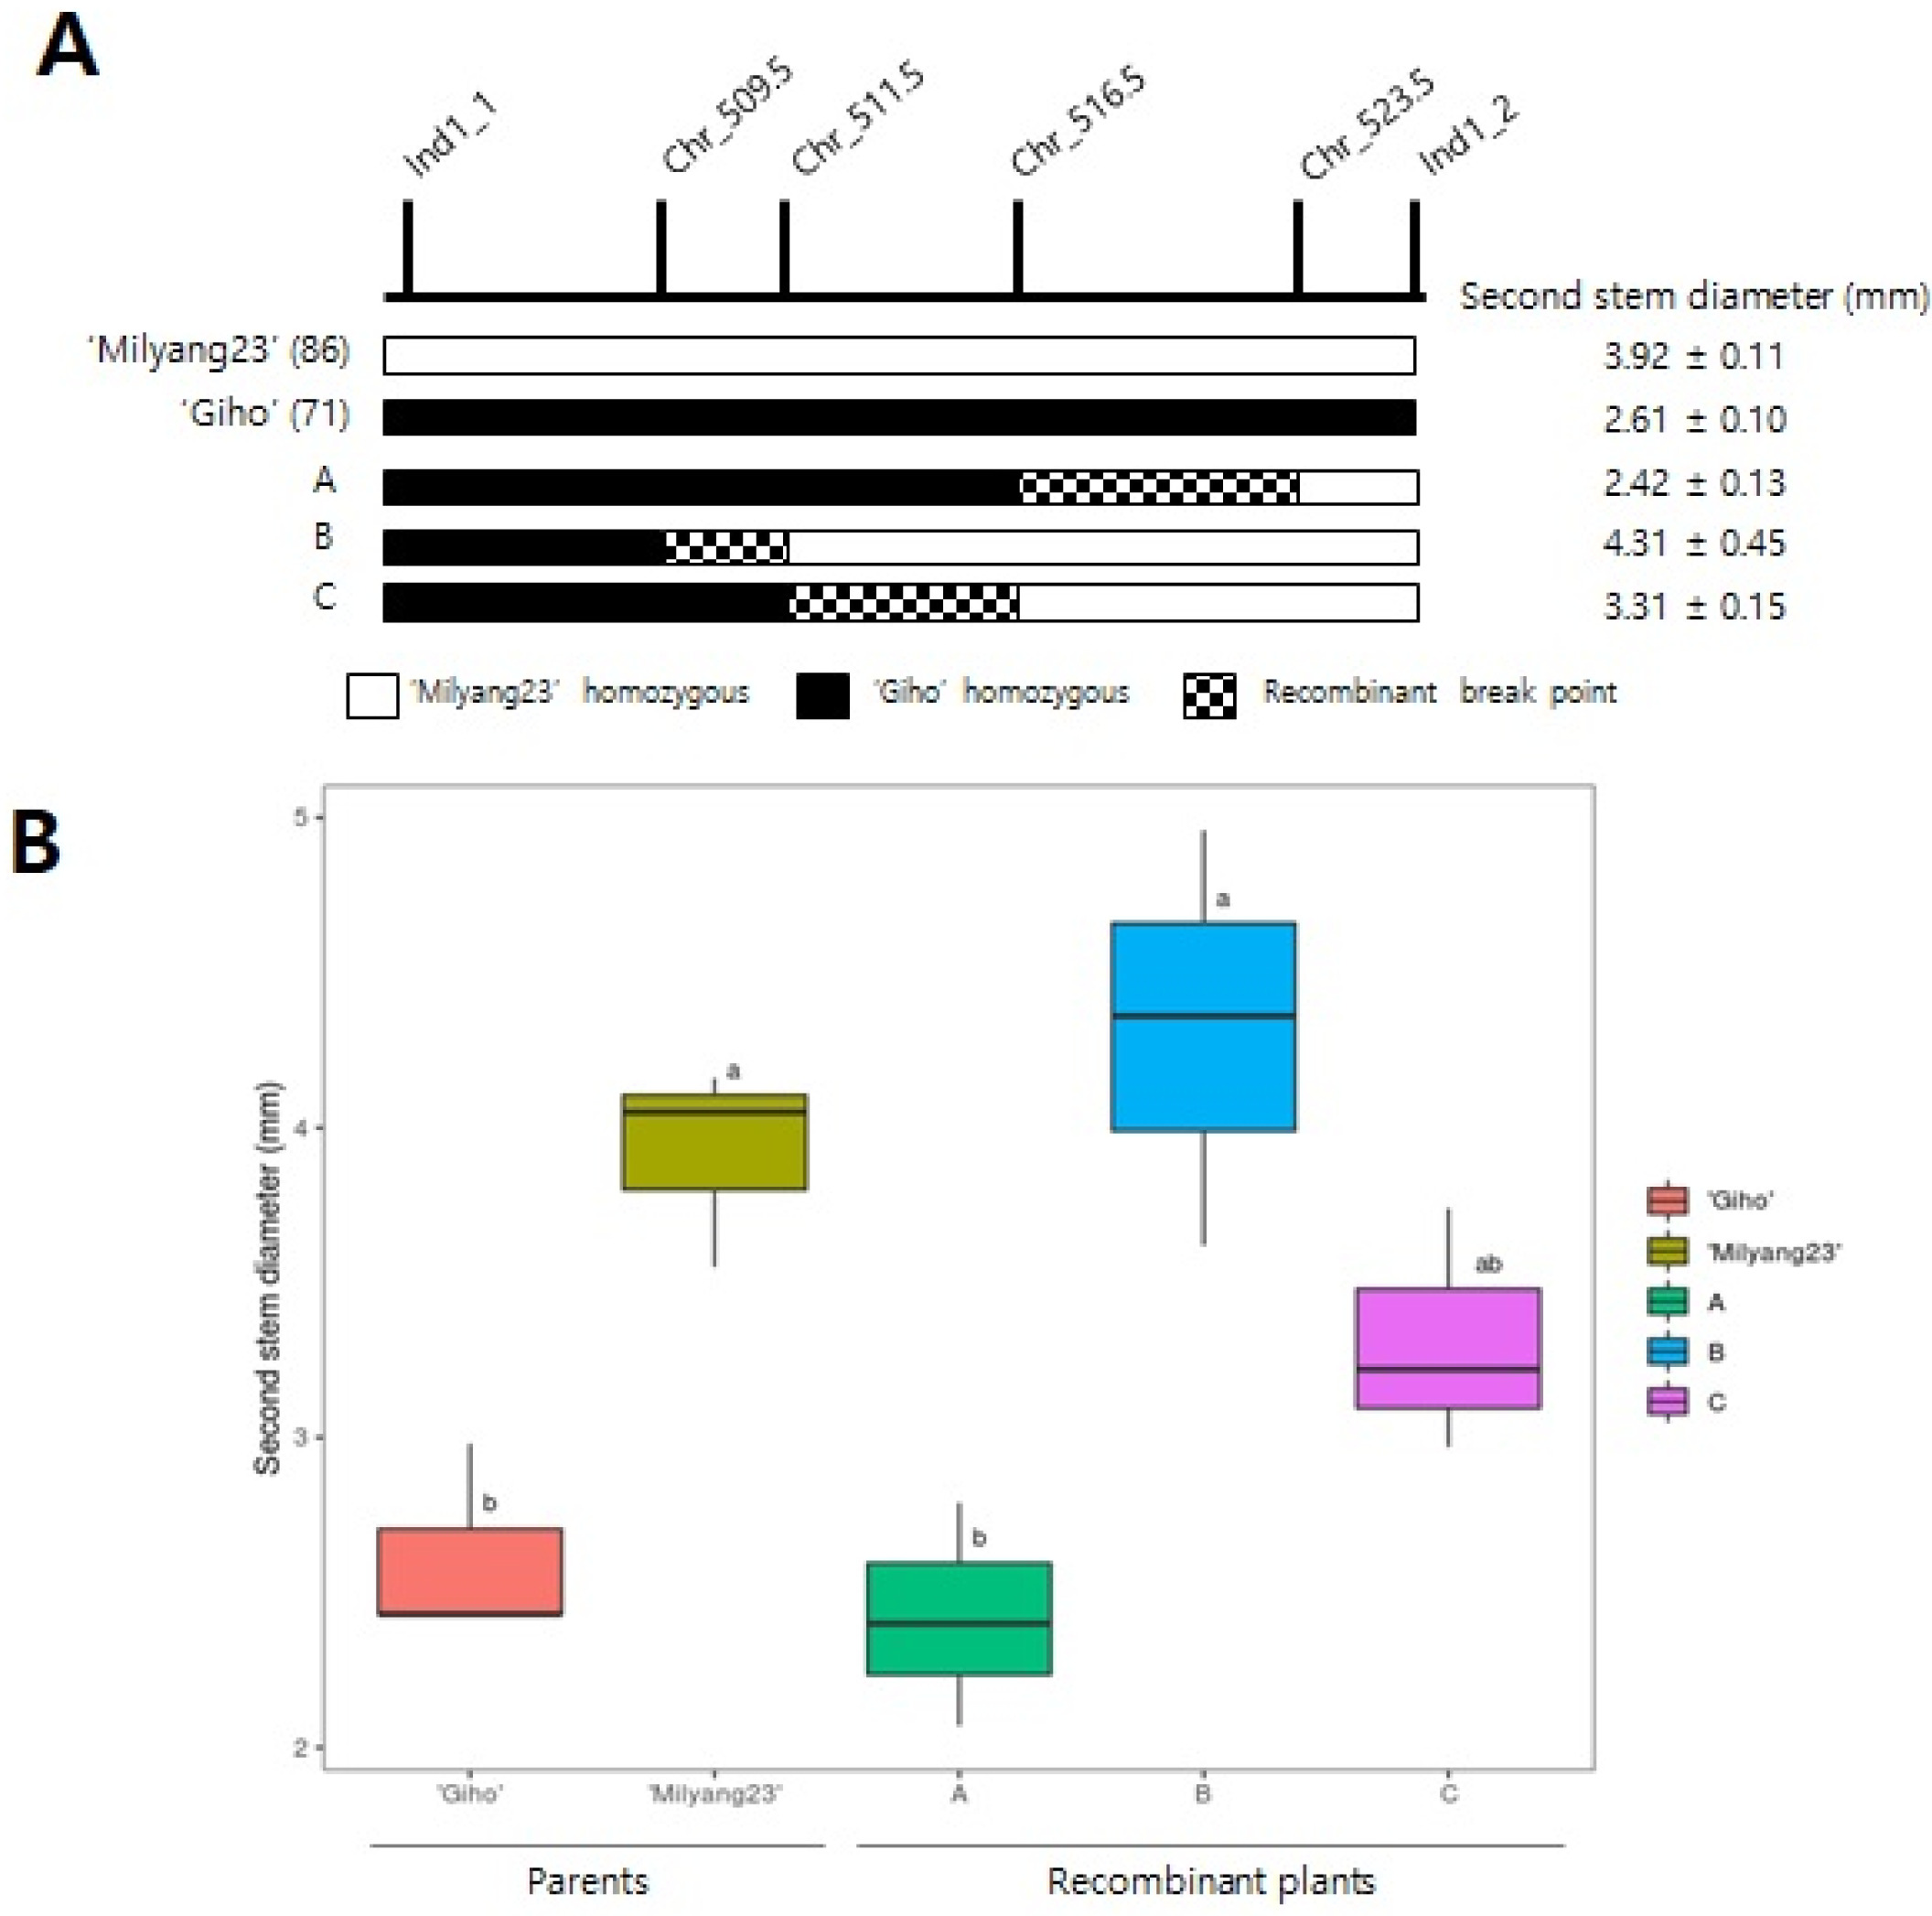
q2ID1, fine-mapping was performed using between Ind1_1 and Ind1_2 additional markers (
Fig. 2A). In this QTL region, recombination points were uniquely observed in plants A, B and C, whereas the remaining 157 lines were separated into same genotype of two parents (i.e., either ‘Milyang23’ or ‘Giho’). We counted the RILs between two parental groups in 86 ‘Milyang23’ and 71 ‘Giho’ genotypes, respectively. One-way ANOVA revealed that plant B included those with higher at second stem diameter relative to the other plants (
Fig. 2B). Therefore, the
q2ID1 was annotated within the marker interval for predicting candidate genes in a ~140 kb region (Chr 1: 5,095,000 bp to 5,235,000 bp) based on data from RAP-DB.
According to RAP-DB, a 140 kb q2ID1 region harboring a total of 15 candidate genes was predicted between Chr1_509.5 and Chr1_523.5 markers
(
Table 4). Among these genes, nine were identified with specific functions, including a zinc finger and indeterminate domain (IDD) family transcription factor (
Os01g019500), a prenylated rab acceptor PRA1 family protein (
Os01g0196500), a 260-kDa major acidic fibroblast growth factor- stimulated phosphoprotein (
Os01g0196600) and cytochrome P450 (
Os01g0197100). The other six genes are non-protein coding transcripts of hypothetical conserved genes, including
Os01g0195066 and
Os01g0195300. Addi-tionally, we analyzed sequence variations between ‘Milyang23’ and ‘Giho’ candidate genes in order to identify variations in genomic regions that usually affect phenotype (
Supplementary Table S3). A total of 24 SNPs and two InDels were identified in the protein coding regions, with these distributed in eight of nine genes (not in
Os01g0195500) within the mapped region.
DISCUSSION
The development of semi-dwarf varieties in rice harboring the
sd1 gene resulted in increased rice yields according to elevated lodging resistance (
Sasaki et al. 2002;
Kim et al. 2014). Reduced plant height following inclusion of the
sd1 gene decreased the effects of the upper part of the plant on the lower part (
Isham et al. 2007). However, the presence of semi-dwarf rice and wheat can potentially limit canopy photosynthesis, biomass produc-tion and grain yields (
Kuroda et al. 1989;
Gent 1995;
Isham et al. 2007).
Ookawa and Ishihara (1992) reported that plant height was not the most important factor in determining lodging resistance. The RIL population used in this study was obtained from a cross between two different rice varieties with different stem morphologies, and showed substantial variations in stem diameter traits. In the 160 RILs, Tongil-type rice displayed shorter and thicker culms than
japonica rice, implying that this population appeared to be more highly affected by crossing with
indica type, which comprises 91.8% of Tongil-type rice (
Kim et al. 2014). ‘Milyang23’ phenotypes might be showed higher 4IL, 1ID, 2ID, 3ID and 4ID than ‘Giho’. We observed a high correlation between stem diameter traits (1ID, 2ID, 3ID and 4ID) relative to length traits (1IL, 2IL, 3IL and 4IL). To identify factors from Tongil rice is important in MGRIL population and these findings can be provided valuable genetic resources for use in rice breeding. Therefore, we used nine stem traits which have phenotypic differences, and performed QTL mapping based on a high-resolution genetic map by
Lee et al. (2020).
Genetic analysis using populations is useful for identifying genetic loci and genes associated with target traits. In rice, stem diameter represents a major trait for improving lodging resistance, as it increases yield. Although many studies reported genetic mechanisms associated with lodging, additional efforts to explore stem diameter are still required to identify new genes for enabling the creation of high-yielding rice (
Sasaki et al. 2002;
Isham et al. 2007;
Kashiwagi et al. 2008;
Ookawa et al. 2010;
Yano et al. 2015). The present study identified a total of 30 QTLs of stem traits and analyzed their QTL interactions by epistatic mapping. QTL analysis is a powerful tool that allows breeders to identify possible new variations and investigate genetic factors underlying traits. Because QTLs represent complex traits controlled by multiple genetic and environmental factors, their interactions are referred to as epistatic based on their large influence on phenotypes (
Liang et al. 2016). A previous study detected a stem diameter QTL (
sdm1) that showed significantly greater pushing resistance in ‘NIL 28’, which is a near isogenic line (NIL) population derived from a cross between ‘Nipponbare’ (
japonica) and ‘Kasalath’ (
indica) (
Kashiwagi et al. 2008). Additionally, a QTL from MGRILs was identified in a similar region (
sdm1); however, the QTL interval was too large and made screening potential candidate genes related to the stem diameter trait difficult (
Lee et al. 2016). The comparison between
Lee et al. (2016) and this study has been confirmed that stem diameter traits conferred by
q2ID1 are stable in different environments, suggesting that this target QTL region might be required for fine-mapping. In the present study, we demonstrated that stem diameter QTLs in chromosome 1 were independently separated from CL or IL traits, and might be suitable for identifying new genetic factors in this region. Similarly, a previously cloned QTL (
Gn1a locus) was reported as being associated with grain number (
Os01g0197700) (
Ashikari et al. 2005), and other studies showed that stem elongation reduces plant height in rice and wheat yields (
Koch et al. 2017;
Shah et al. 2019).
High-resolution genetic maps are widely used for QTL mapping and candidate gene identification in relation to the complex traits of plants. Previous studies using RFLP, RAPD, AFLP, SSR and CAPS markers have been undertaken on biparental populations of rice (
Cho et al. 2007;
Ji et al. 2012;
Lee et al. 2016). Recently, high-throu-gh-put NGS has revealed large numbers of DNA polymorphisms, such as SNPs and InDels, and provided the genetic basis for developing new molecular markers, even those resulting from recombinant events (
Gao et al. 2013;
Lee et al. 2020). A previous study employing resequencing methods using NGS revealed the high-effi-ciency and precision of generating high-resolution genetic maps from 160 RILs (
Lee et al. 2020). Furthermore, an ultra-high-density map generated from 241 RILs derived from a cross between two elite
indica subspecies was used for genotyping and QTL analysis of yield traits, and demonstrated better power and resolution than a traditional RFLP/SSR genetic map (
Yu et al. 2011).
The efficiency of QTL mapping largely depends on marker density and population size (
Chen et al. 2014). In general, most QTL mapping studies have uses advanced fixed homozygous populations, such as RILs or NILs due to the high recombination frequency within a limited population, and can be genotyped only once and phenotyped repeatedly (
Singer et al. 2006;
Wang et al. 2011;
Yu et al. 2011). For example, in RILs, the high recombination frequency is advantageous because of the occurrence of multiple meiotic events during repeated self-fertilization (
Jansen, 2004). To directly perform fine-mapping, heterozygous plants are required such as NIL for population development and increasing an accuracy of phenotype determination (
Zhang et al. 2021). Additionally, the resolution for QTL mapping can be improved by using a large population size and greater marker density to more precisely detect recombination events (
Chen et al. 2014). However, it was difficult to access using RILs in this study, so that we focused identifying candidate genes at minimum QTL region with additional markers. As a result, we succeeded in narrowing the target QTL region to a ~140 kb interval by using a large number of genetic markers; however, we were unable to further narrow the mapping interval due to a low recombination rate and the limited of population size. In other words, although we performed fine-mapping based on 3,563 SNP-based bin markers (
Lee et al. 2020), the identification of specific genes was limited due to the lack of recombination lines, which is insufficient for analyses. Bin markers were developed based on the genotypes of RILs; therefore, QTL regions existing at specific recom-bination points were increasingly accessible, although difficult to identify within flanking marker regions.
In fine-mapping, we found three recombinant plants between flanking markers in the
q2ID1 region (interval at 95% probability). The result of substitution mapping narrowed the
q2ID1 locus to ~140 kb, which included 15 candidate genes. One of these genes encodes an IDD family transcription factor involved in regulating secondary cell wall formation in rice. A previous study showed that overexpression of miR396a or
OsIDD2 in rice lines resulted in dwarfism as a consequence of increased levels of mi396 RNA, which is regulated by
SLR1 to control cell proliferation related to stem elongation (
Lu et al. 2020). Another study found that the
dwarf ebisu (
d2) gene encodes a novel cytochrome P450 encoded by
CYP90D and involved in regulating brassinosteroid (BR) biosynthesis in dwarf plants (
Hong et al. 2003). Previous studies of rice and wheat revealed that gibberellins are the most important factors determining plant height; however, a rice dwarf mutant involving a variation in the
d61 gene was identified as being caused by a loss-of-function mutation in
OsBR1, which encodes a putative protein kinase similar to BR1 in
Arabidopsis thaliana. Therefore, these findings suggest the necessity of further identification of candidate genes via expression analysis in rice breeding programs. Although we did not apply expression analysis in the present study, it is possible that hypothetical proteins with unknown functions and sequence variations might provide useful genetic information concerning the
q2ID1 locus; therefore, further studies are needed to verify changes in expression between two parental lines and several superior lines of RILs demonstrating variations in stem diameter.
Supplemental Materials
ACKNOWLEDGEMENTS
This work was supported by a grant from the National Institute of Agricultural Sciences (Project No. PJ013442), Rural Development Administration, Korea.
Fig. 1Phenotypic morphology of two parental lines. (A) Designation of the 1st to 4th internodes between ‘Milyang23’ (left) and ‘Giho’ (right). (B) Image illustrating the length comparison of each internode between the parents. Error bars represent mean ± standard deviation (SD). (C) Panicles. (D) Differences of diameters among the 1st, 2nd, 3rd and 4th stem internodes. Image depicting P1: ‘Milyang23’, P2: ‘Giho’.
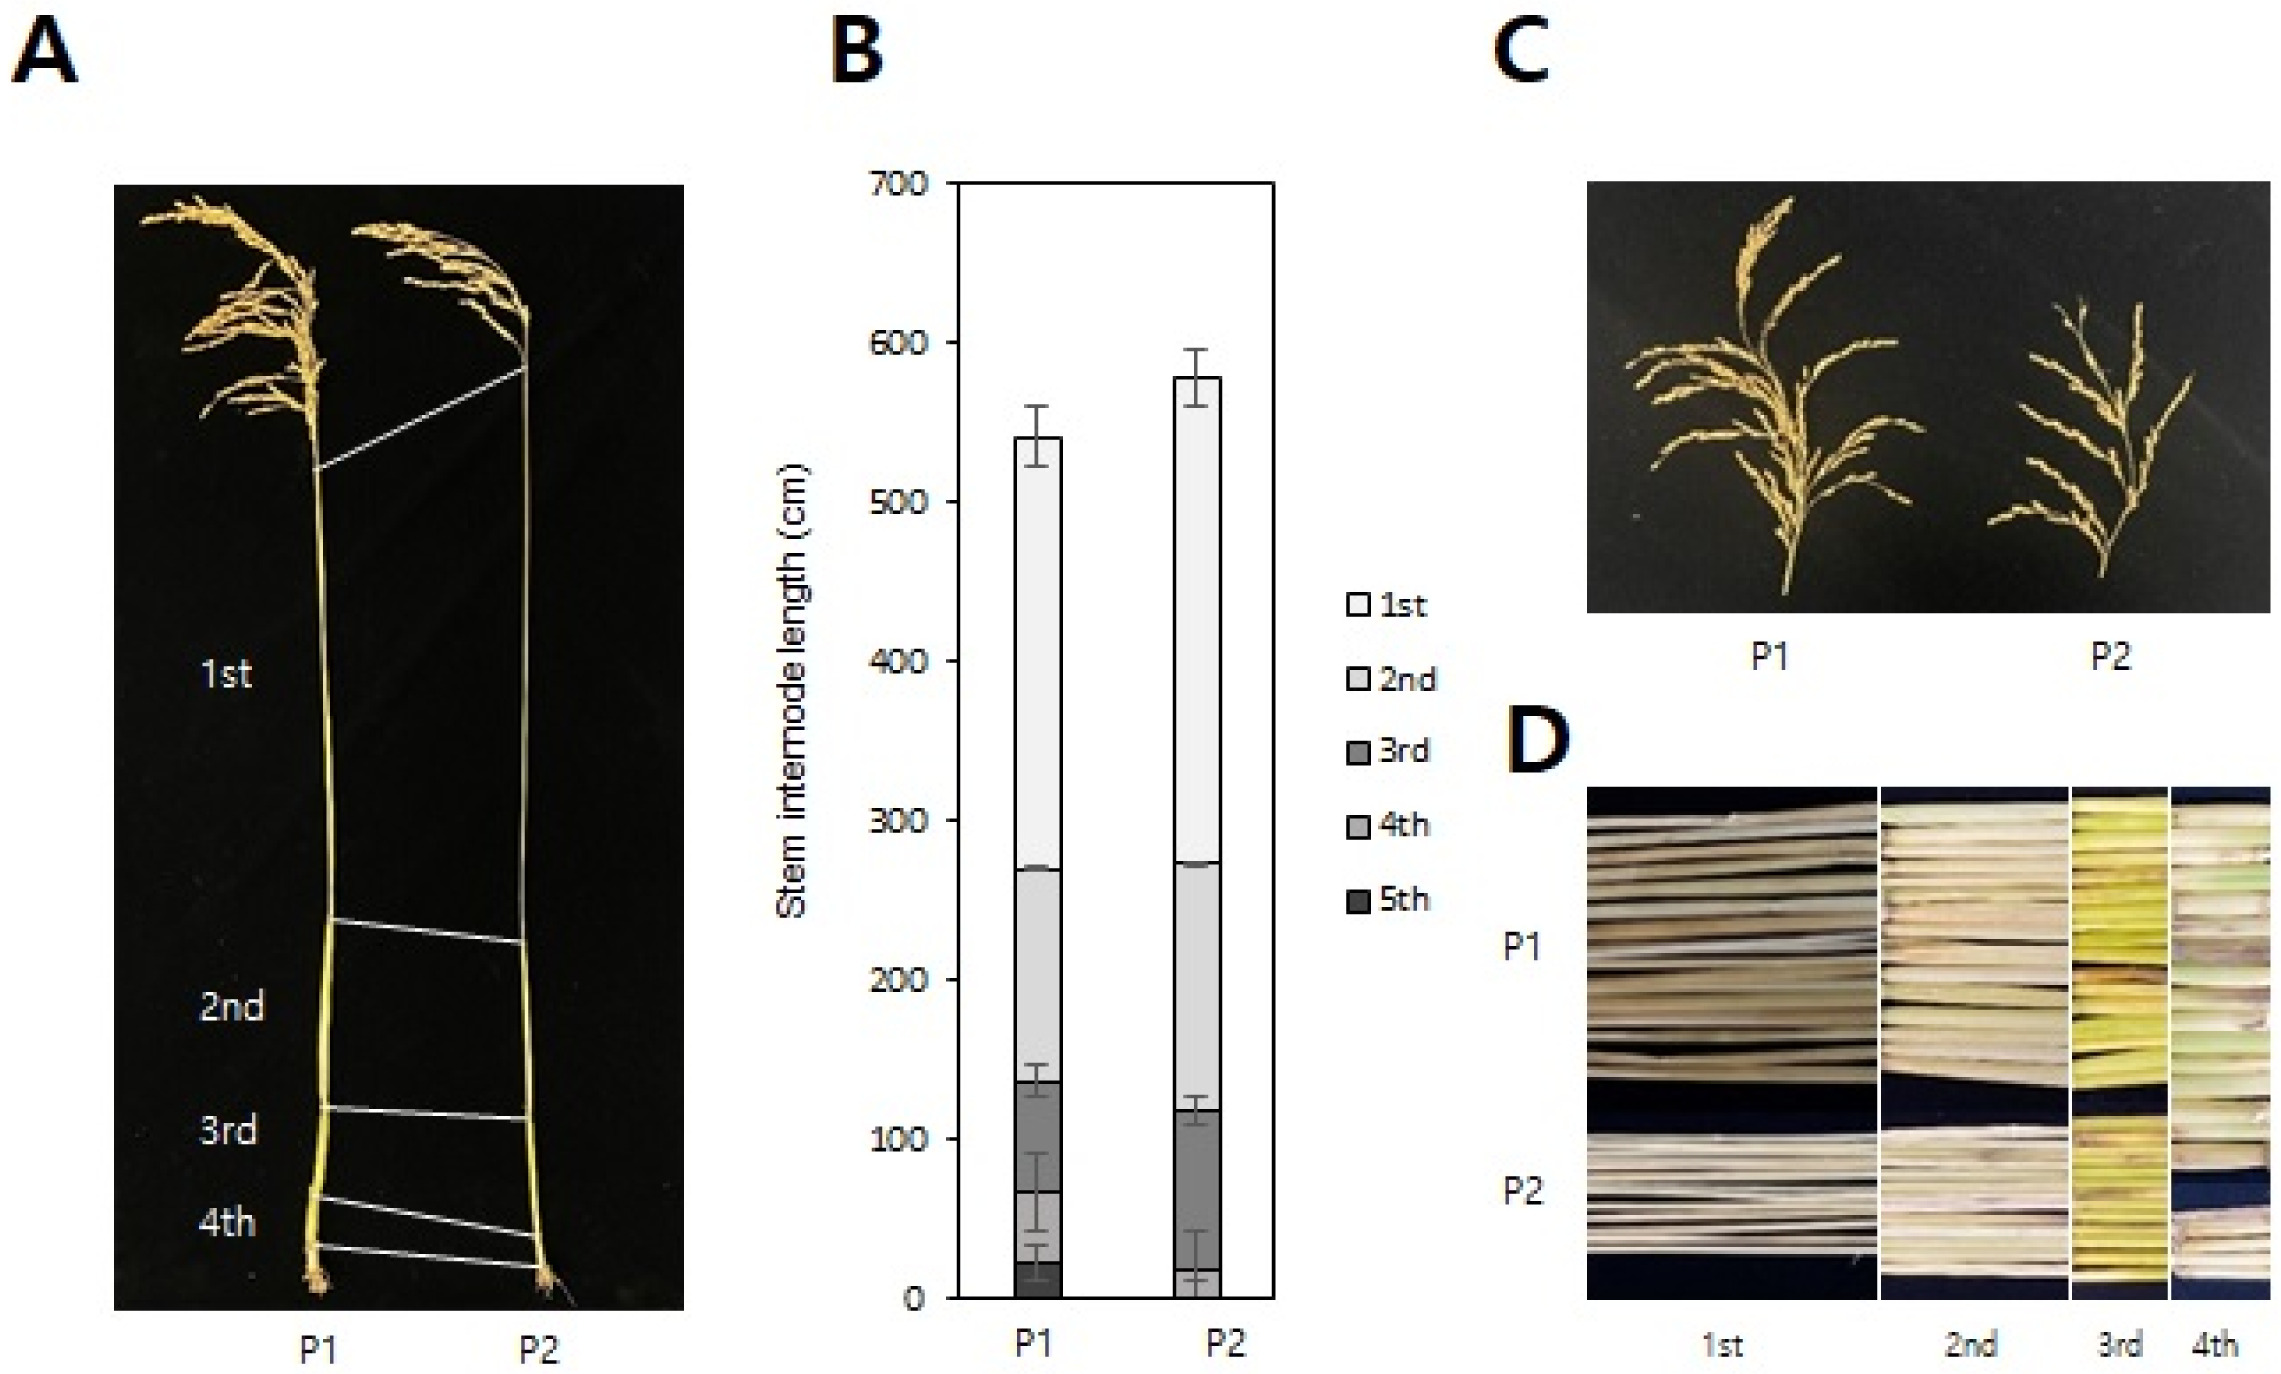
Fig. 2Fine-mapping of the q2ID1 QTL on chromosome 1. (A) Schematic representation of graphic genotypes of three recombinant plants (A-C) derived from a cross between ‘Milyang23’ and ‘Giho’. White, homozygous for ‘Milyang23’; black, homozygous for ‘Giho’ and hatched black for recombination points. Vertical lines indicate the location of genetic markers. (B) Boxplots are indicating the mean values of second stem diameter trait for each plant. The values followed by same letters in each bars are not significantly different at the 0.05 probability level based on Tukey test.

Table 1Descriptive statistics of phenotypic variations for stem traits in 160 RILs derived from a cross between ‘Milyang23’ and ‘Giho’.
Table 1
|
Traitz)
|
Parenty)
|
RIL population (n = 160)x) |
|
‘Milyang23’ |
‘Giho’ |
Range |
Mean ± SD |
Skewness |
Kurtosis |
CV (%) |
|
1IL |
27.1 |
30.5 |
15.17-40.57 |
27.76 ± 4.69 |
0.29 |
0.05 |
16.88 |
|
2IL |
13.3 |
15.4 |
1.63-23.60 |
15.64 ± 3.48 |
‒0.41 |
0.62 |
22.26 |
|
3IL |
7 |
10 |
3.97-20.80 |
12.55 ± 3.90 |
‒0.12 |
‒0.89 |
31.07 |
|
4IL |
4.5 |
1.9 |
0.00-15.27 |
8.37 ± 3.32 |
‒0.03 |
‒0.66 |
39.65 |
|
1ID |
2.38 |
1.28 |
1.28-2.80 |
1.80 ± 0.29 |
0.71 |
0.49 |
16.15 |
|
2ID |
3.92 |
2.61 |
2.23-4.42 |
3.11 ± 0.42 |
0.59 |
0.56 |
13.52 |
|
3ID |
4.39 |
3.01 |
2.90-5.79 |
3.81 ± 0.49 |
0.79 |
1.56 |
12.95 |
|
4ID |
4.88 |
3.27 |
1.85-6.79 |
4.36 ± 0.60 |
0.2 |
2.62 |
13.69 |
|
CLw)
|
54 |
57.8 |
37.67-101.87 |
66.46 ± 13.66 |
0 |
‒0.84 |
20.56 |
Table 2Correlation coefficient of stem traits in MGRIL population.
Table 2
|
Traitz)
|
1IL |
2IL |
3IL |
4IL |
1ID |
2ID |
3ID |
4ID |
|
2IL |
0.590***
|
|
|
|
|
|
|
|
|
3IL |
0.402***
|
0.725***
|
|
|
|
|
|
|
|
4IL |
0.334***
|
0.570***
|
0.764***
|
|
|
|
|
|
|
1ID |
0.361***
|
0.11 |
0.047 |
‒0.096 |
|
|
|
|
|
2ID |
0.348***
|
0.257**
|
0.106 |
‒0.040 |
0.749***
|
|
|
|
|
3ID |
0.294***
|
0.227**
|
0.195*
|
0.06 |
0.694***
|
0.815***
|
|
|
|
4ID |
0.219***
|
0.188*
|
0.226**
|
0.133*
|
0.563***
|
0.716***
|
0.865**
|
|
|
CLy)
|
0.741***
|
0.845***
|
0.850***
|
0.809***
|
0.151*
|
0.201*
|
0.230**
|
0.221**
|
Table 3Detection of stem trait QTLs based on a high-resolution genetic map by Lee et al. (2020).
Table 3
|
Traitz)
|
Chr |
QTL name |
Position (cM) |
Genetic interval (cM) |
LOD |
PVEy)
|
Additive effectx)
|
|
1IL |
1 |
q1IL1
|
163.3 |
162.5-164.1 |
13.14 |
20.65 |
‒2.16 |
|
5 |
q1IL5
|
81.2 |
78.5-82.0 |
12.68 |
19.63 |
2.19 |
|
9 |
q1IL9
|
45.3 |
44.4-46.5 |
45.31 |
4.64 |
‒1.02 |
|
2IL |
1 |
q2IL1.1
|
162.3 |
162.0-163.0 |
26.24 |
51.1 |
‒2.60 |
|
1 |
q2IL1.2
|
168.8 |
167.5-169.3 |
23.14 |
46.88 |
‒2.51 |
|
8 |
q2IL8
|
8.2 |
5.7-9.4 |
3.53 |
4.17 |
0.74 |
|
3IL |
1 |
q3IL1
|
163.3 |
163.0-163.9 |
30.07 |
49.92 |
‒2.78 |
|
5 |
q3IL5
|
186.3 |
170.6-196.3 |
5.48 |
12.35 |
1.41 |
|
4IL |
1 |
q4IL1.1
|
154.5 |
154.1-154.8 |
8.43 |
15.74 |
‒1.40 |
|
1 |
q4IL1.2
|
164.2 |
163.4-167.4 |
28.81 |
41.18 |
‒2.19 |
|
10 |
q4IL10
|
54 |
53.1-55.4 |
3.75 |
3.67 |
‒0.66 |
|
1ID |
1 |
q1ID1
|
25.1 |
24.5-26.3 |
5.01 |
8.93 |
0.09 |
|
5 |
q1ID5.1
|
72.1 |
70.9-72.8 |
7.66 |
15.45 |
0.12 |
|
5 |
q1ID5.2
|
77.8 |
77.5-78.5 |
11.02 |
21.24 |
0.14 |
|
6 |
q1ID6
|
5.2 |
1.4-8.4 |
4.54 |
8.5 |
0.09 |
|
2ID |
1 |
q2ID1
|
25.1 |
24.4-25.4 |
3.83 |
7.33 |
0.12 |
|
4 |
q2ID4
|
344.5 |
343.9-345.7 |
3.95 |
7.43 |
0.12 |
|
5 |
q2ID5.1
|
62.4 |
62.0-63.0 |
4 |
7.87 |
0.12 |
|
5 |
q2ID5.2
|
72.1 |
70.6-72.8 |
5.47 |
10.53 |
0.14 |
|
3ID |
5 |
q3ID5
|
73.1 |
71.9-73.4 |
5.77 |
10.86 |
0.16 |
|
8 |
q3ID8
|
91.9 |
90.9-94.6 |
4.61 |
8.57 |
0.15 |
|
10 |
q3ID10
|
84.2 |
82.3-100.4 |
3.36 |
6.3 |
‒0.12 |
|
4ID |
1 |
q4ID1.1
|
40.9 |
39.6-41.3 |
4.13 |
8.08 |
0.16 |
|
1 |
q4ID1.2
|
49.7 |
48.2-51.7 |
4.94 |
9.56 |
0.18 |
|
4 |
q4ID4.1
|
293.1 |
292.3-295.2 |
4.82 |
9.36 |
‒0.18 |
|
4 |
q4ID4.2
|
305.6 |
303.4-306.9 |
3.39 |
6.72 |
‒0.15 |
|
CL |
1 |
qCL1
|
163.3 |
162.6-163.9 |
40.88 |
57.5 |
‒10.71 |
|
5 |
qCL5.1
|
72.8 |
72.1-73.3 |
7.97 |
7.34 |
4 |
|
5 |
qCL5.2
|
80.9 |
80.4-81.2 |
11.15 |
9.84 |
4.97 |
|
6 |
qCL6
|
0 |
0.0-0.9 |
5.68 |
4.62 |
3.04 |
Table 4List of candidate genes located in q2ID1 on chromosome 1.
Table 4
|
Gene locus ID |
Description of function |
Start position (bp) |
End position (bp) |
|
Os01g0195000 |
Zinc finger and indeterminate domain (IDD) family transcription factor, regulation of secondary cell wall formation, INDETERMINATE DOMAIN 2 |
5,099,555 |
5,102,080 |
|
Os01g0195066 |
Non-protein coding transcript |
5,102,129 |
5,102,343 |
|
Os01g0195100 |
Non-protein coding transcript |
5,103,843 |
5,108,907 |
|
Os01g0195200 |
Similar to serine/threonine-protein kinase PBS1 (EC 2.7.1.37) (AvrPphB susceptible protein 1) |
5,109,949 |
5,112,457 |
|
Os01g0195300 |
Hypothetical conserved gene |
5,128,137 |
5,128,696 |
|
Os01g0195400 |
Harpin-induced 1 domain containing protein |
5,131,629 |
5,132,915 |
|
Os01g0195500 |
Translation initiation factor SUI1 domain containing protein |
5,138,518 |
5,140,925 |
|
Os01g0195700 |
Hypothetical conserved gene |
5,148,879 |
5,149,201 |
|
Os01g0195801 |
Hypothetical conserved gene |
5,149,335 |
5,150,341 |
|
Os01g0196133 |
Similar to H0315A08.1 protein |
5,196,418 |
5,197,056 |
|
Os01g0196300 |
Basic helix-loop-helix (bHLH) transcription factor, diterpenoid phytoalexin factor, biosynthesis of diterpenoid phytoalexins, stress response, DITERPENIOD PHYTOALEXIN FACTOR |
5,201,862 |
5,203,996 |
|
Os01g0196500 |
Prenylated rab acceptor PRA1 family protein |
5,213,979 |
5,216,701 |
|
Os01g0196600 |
Similar to 260-kDa major acidic fibroblast growth factor-stimulated phosphoprotein |
5,218,573 |
5,220,335 |
|
Os01g0196800 |
Hypothetical protein |
5,227,044 |
5,229,966 |
|
Os01g0197100 |
Cytochrome P450, brassinosteroids biosynthesis, regulation of plant architecture, DWARF EBISU |
5,236,623 |
5,244,520 |
References
- Ashikari M, Sakakibara H, Lin SY, Yamamoto T, Takashi T, Nishimura A, et al. 2005. Cytokinin oxidase regulates rice grain production. Science. 309: 741-745.
- Bernado R. 2008. Molecular markers and selection for complex traits in plants: Learning from the last 20 years. Crop. Sci.. 48: 1649-1664.
- Chen Z, Wang B, Dong X, Liu H, Ren L, Chen J, et al. 2014. An ultra-high density bin-map for rapid QTL mapping for tassel and ear architecture in a large F2 maize population. BMC Genomics. 15: 1-10.
- Cho YG, Kang MR, Kim YW, Eun MY, Chung TY, Lee YT. 1998. Development of RFLP framework map of rice (Oryza sativa L.) using recombinant inbred population derived from Milyang23/Gihobyeo cross. Korean J. Breed. Sci.. 30: 289-297.
- Cho YG, Kang HJ, Lee JS, Lee YT, Lim SJ, Gauch H, et al. 2007. Identification of quantitative trait loci in rice for yield, yield components, and agronomic trait across years and locations. Crop Sci.. 47: 2403-2417.
- Gao ZY, Zhao SC, He WN, Guo LB, Peng YL, Wang JJ, et al. 2013. Dissecting yield-associated loci in super hybrid rice by resequencing recombinant inbred lines and improving parental genome sequences. Proc. Natl. Acad. Sci. U.S.A.. 110: 14492-14497.
- Gent MPN. 1995. Canopy light interception, gas exchange, and biomass in reduced height isolines of winter wheat. Crop Sci.. 35: 1636-1642.
- Guo L, Gao Z, Qian Q. 2014. Application of resequencing to rice genomics, functional genomics and evolutionary analysis. Rice. 7: 1-10.
- Huang X, Feng Q, Qian Q, Zhao Q, Wang L, Wang A, et al. 2009. High-throughput genotyping by whole-genome resequencing. Genome Res.. 19: 1068-1076.
- Hong Z, Ueguchi-Tanaka M, Umemura K, Uozu S, Fujioka S, Takatsuto S, et al. 2003. A rice brassinosteroid deficient mutant, ebisu dwarf (d2), is caused by a loss of function of a new member of cytochrome P450. Plant Cell. 15: 2900-2910.
- Isham MS, Peng S, Visperas RM, Ereful N, Bhuiya MSU, Julfiquar AW. 2007. Lodging-related morphological traits of hybrid rice in a tropical irrigated ecosystem. Field Crops Res.. 101: 240-248.
- Jansen RC. 2004. Quantitative trait loci in inbred lines. Handbook of Statistical Genetics pp. 445-476..
- Jeon YA, Kang YJ, Sim KC, Lee HS, Xin L, Kang JW, et al. 2018. Genetic analysis and mapping genes for culm length and internode diameter in progeny from an interspecific cross in rice. Plant Breed. Biotech.. 6: 140-146.
- Ji H, Kim H, Lee GS, Yoon UH, Kim TH, Seol YJ, et al. 2012. Development of rice molecular genetic and physical map using PCR-based DNA markers with the recombinant inbred population derived from Milyang23/Gihobyeo cross. Korean J. Breed. Sci.. 44: 273-281.
- Kashiwagi T, Ishimaru K. 2004. Identification and functional analysis of a locus for improvement of lodging resistance in rice. Plant Physiol.. 134: 676-683.
- Kashiwagi T, Togawa E, Hirotsu N, Ishimaru K. 2008. Improvement of lodging resistance with QTLs for stem diameter in rice (Oryza sativa L.). Theor. Appl. Genet.. 117: 749-757.
- Khush GS. 1999. Green revolution: preparing for the 21st century. Genome. 42: 646-655.
- Khush GS. 2001. Green revolution: the way forward. Nat. Rev. Genet.. 2: 815-822.
- Kim B, Kim DG, Lee G, Seo J, Choi IY, Choi BS, et al. 2014. Defining the genome structure of 'Tongil' rice, an important cultivar in the Korean "Green Revolution". Rice. 7: 1-9.
- Koch F, Aisenberg G, Monteiro M, Pedó T, Zimmer P, Villela F, et al. 2017. Growth of wheat plants submitted to the application of the growth regulator trinexapac-ethyl and vigor of the produced seeds. Agrocienc. Urug.. 21: 24-32.
- Kuroda E, Ookawa T, Ishihara K. 1989. Analysis of difference of dry matter production between rice cultivars with different plant height in relation to gas diffusion inside stands. Jpn. J. Crop Sci.. 58: 374-382.
- Lee HJ, Jeong IS, Ji H, Lee GS, Yoon UH, Kim TH. 2014. Development of new CAPS markers and their application in QTL analysis of stem diameter in rice. Korean J. Breed. Sci.. 46: 116-128.
- Lee YJ, Byeon EJ, Bae SH, Ji H, Lee GS, Yoon UH, et al. 2016. Development of NGS-based new CAPS markers and QTL analysis of stem diameter using Mil-yang23/Gihobyeo recombinant inbred lines (MGRIL). Korean J. Breed. Sci.. 48: 217-233.
- Lee YJ, Hyung NI, Kim TH. 2020. High-resolution bin maps provide insights for QTL mapping of yield-related traits with Milyang23/Gihobyeo recombinant inbred lines. Plant Breed. Biotech.. 8: 293-306.
- Liang H, Xu L, Yu Y, Yang H, Dong W, Zhang H. 2016. Identification of QTLs with main, epistatic and QTL by environment interaction effects for seed shape and hundred-seed weight in soybean across multiple years. J. Genet.. 95: 475-477.
- Lu Y, Feng Z, Meng Y, Bian L, Xie H, Mysore KS, et al. 2020. SLENDER RICE1 and Oryza sativa INDE-TERMINATE DOMAIN2 Regulating OsmiR396 are involved in stem elongation. Plant Physiol.. 182: 2213-2227.
- McCouch SR, Cgsnl . 2008. Gene nomenclature system for rice. Rice. 1: 72-84.
- McNally KL, Childs KL, Bohnert R, Davidson RM, Zhao K, Ulat VJ, et al. 2009. Genomewide SNP variation reveals relationships among landraces and modern varieties of rice. Proc. Natl. Acad. Sci. U.S.A.. 106: 12273-12278.
- Meng L, Li H, Zhang L, Wang J. 2015. QTL IciMapping: Integrated software for genetic linakge map construction and quantitative trait locus mapping biparental population. Crop. J.. 3: 269-283.
- Ookawa T, Ishihara K. 1992. Varietal difference of physical characteristics of the culm related to lodging resistance in paddy rice. Jpn. J. Crop. Sci.. 61: 419-425.
- Ookawa T, Tokonori H, Yano M, Murata K, Ando T, Miura H, et al. 2010. New approach for rice improvement using a pleiotropic QTL gene for lodging resistance and yield. Nat. Commun.. 1: 1-11.
- R Core Team.2013. R: A language and environment for statistical computing. R Foundation Statistical Com-puting. Vienna.
- Sasaki A, Ashikari M, Ueguchi-Tanaka M, Itoh H, Nishimura A, Swapan D, et al. 2002. Green revolution: A mutant gibberellin-synthesis gene in rice. Nature. 416: 701-702.
- Setter TL, Laureles EV, Mazaredo AM. 1997. Lodging reduces yield of rice by self-shading and reduction in canopy photosynthesis. Field Crops Res.. 49: 95-106.
- Shah L, Yahya M, Shah SMA, Naddem M, Ail A, Ail A, et al. 2019. Improving lodging resistance: using wheat and rice as classical examples. Int. J. Mol. Sci.. 20: 4211
- Singer T, Fan Y, Chang HS, Zhu T, Hazen SP, Briggs SP. 2006. A high-resolution map of Arabidopsis recombinant inbred lines by whole-genome exon array hybridization. PLoS Genet.. 2: e144
- Spielmeyer W, Ellis MH, Chandler PM. 2002. Semidwarf (sd-1), "green revolution" rice contains a defective gibberellin 20-oxidase gene. Proc. Natl. Acad. Sci. U.S.A.. 99: 9043-9048.
- Takai T, Adachi S, Taguchi-Shiobara F, Sanoh-Arai Y, Iwasawa N, Yoshinaga S, et al. 2013. A natural variant of NAL1, selected in high-yield rice breeding programs, pleiotropically increases photosynthesis rate. Sci. Rep.. 3: 1-11.
- Terashima K, Ogata T, Akita S. 1994. Eco-physiological characteristics related with lodging tolerance of rice in direct sowing cultivation. II. Root growth characteristics of tolerant cultivars to root lodging. Jpn. J. Crop. Sci.. 63: 34-41.
- Varshney RK, Nayak SN, May GD, Jackson SA. 2009. Next-generation sequencing technologies and their implications for crop genetics and breeding. Trends Biotechnol.. 27: 522-530.
- Wang L, Wang A, Huang X, Zhao Q, Dong G, Qian Q, et al. 2011. Mapping 49 quantitative trait loci at high resolution through sequencing-based genotyping of rice recombinant inbred lines. Theor. Appl. Genet.. 122: 327-340.
- Wang S, Basten CJ, Zeng ZB. 2012. Windows QTL Cartographer 2.5. Department of Statistics, North Carolina State University, Raleigh, NC.
- Yano K, Ookawa T, Aya K, Ochiai Y, Hirasawa T, Ebitani T. 2015. Isolation of a novel lodging resistance QTL gene involved in strigolactone and its pyramiding with a QTL gene involved in another mechanism. Mol. Plant. 8: 303-314.
- Yu H, Xie W, Wang J, Xing Y, Xu C, Li X, et al. 2011. Gains in QTL detection using an ultra-high density SNP map based on population sequencing relative to traditional RFLP/SSR markers. PLoS One. 6: e17595
- Zhang L, Zou Y, Bian Z, Xie D, Yeilaghi H, Fan X, et al. 2021. Fine mapping and candidate gene prediction of the quantitative trait locus qPL8 for panicle length in rice. Phyton. 90: 789
- Zuber U, Winzeler H, Messmer MM, Keller M, Keller B, Schmid JE, et al. 1999. Morphological traits associated with lodging resistance of spring wheat (Triticum aestivem L.). J. Agron. Crop Sci.. 182: 17-24.
- Zhu LH, Zhong DB, Xu JL, Yu SB, Li ZK. 2008. Differential expression of lodging resistance related QTLs in rice (Oryza sativa L.). Plant Sci.. 175: 898-905.