Abstract
Rice is a temperature-sensitive crop, its yield is severely affected by low temperature, especially cold stress at the seedling stage will delay heading. To understand the genetic basis of cold tolerance, we evaluated the cold tolerance at the seedling stage of 136 rice accessions. To evaluate cold tolerance, we treated rice seedlings with cold water irrigation for ten days and scored the cold tolerance on a 1-9 scale, based on their low-temperature response and subsequent recovery. The genome-wide association study for cold tolerance revealed seven QTLs on chromosomes 1, 3, 6, 7, 10, and 12. The genomic region of the qCWS7 on chromosome 7 overlapped with a previously reported QTL associated with cold tolerance in the germinating stage. Similarly, qCWS1-1, qCWS1-2, qCWS3, qCWS6, and qCWS10 overlapped with a previously reported QTL associated with drought-stress tolerance. Subsequent bioinformatic and haplotype analyses suggested that five candidate genes affect cold tolerance: Os01g0228600 encoding a cytosolic hydroxypyruvate reductase, Os03g0115000 encoding a cupredoxin domain containing protein, Os06g0612800 encoding a stress-associated protein (SAP) gene family, Os12g0552500 encoding a universal stress protein (USP), and Os10g0482900 encoding a thioredoxin fold domain containing protein.
-
Key words: GWAS, Rice, Seedling, Cold water treatment
INTRODUCTION
Rice (
Oryza sativa L.), one of the most important staple crops, feeds more than 2.7 billion people worldwide (
Fairhurst and Dobermann 2002). In general, rice is exposed to various environmental conditions during its life cycle. Especially, rice is more sensitive to cold stress than are other crops, such as wheat (
Triticum aestivum L.) and barley (
Hordeum vulgare L.), because rice originates in tropical and subtropical regions. Low temperatures in reproductive stages critically to affect grain fertility and quality and reduce yield in high-latitude or high-altitude regions of China, Japan, Korea, and other parts of the world (
Jena et al. 2012). For example, 750,000 kg of rice production was reduced by cold stress at the seedling stage in the Hangzhou region in 1980 (Xiong 1984). Rice production of South Korea is also affected by cold stress every 10 to 15 years because of its geographical location and 20% of agricultural land faces possible cold stress in every year (Yea
et al. 2008).
Cold stress can be classified as chilling (0-15°C) or freezing (< 0°C) stress. Cold stress at the seedling stage causes the delayed of growth and defective root growth. Especially, defective roots caused by cold stress cause suppress early-stage growth and tiller growth (
Ham et al. 2021). The typical symptoms of cold stress are discoloration, yellowing, and withering, including reduced chlorophyll contents and fluorescence, which hinders the photosynthesis of rice (
Kanneganti and Gupta 2008;
Kim et al. 2009). The cold response also produces reactive oxygen species and malondialdehyde, which contributes to damaged cells and impaired cellular metabolism (
Nakashima et al. 2007;
Xie et al. 2009). On cold-tolerance responses of rice, to maintain the proper functioning of rice cells, proline must be accumulated in a cell to stabilize protein synthesis (
Kandpal and Rao 1985). For cultivation method, phosphorus fertilizer and deep irrigation may be applied to prevent cold-stress damages, but doing so is difficult, because weather forecasts can’t perfectly forecast low temperatures and the damage appearance has various patterns and causes (
Ham et al. 2021).
In general, the most efficient method for preventing cold-stress damage is a genetic modification to develop tolerant varieties with the aid of genetic studies, many of which have tried to find QTLs and have identified genes related to cold tolerance. A Genome-wide association study (GWAS) is the analysis that finds the linkage between a single nucleotide polymorphism (SNP) marker and phenotype through the association analysis. Recently, a GWAS has been widely used to discover the genetic control of cold tolerance in rice seedlings (
Shakiba et al. 2017).
Ham et al. (2021), evaluated the cold tolerance in a temperature-controlled growth chamber, which did not ideally represent the natural field conditions or the status of roots. Here, we evaluated cold tolerance by using cold-water irrigation to provide a natural rice-growing environment and to direct the cold treatment to root area in the controlled growth chamber, and natural cold regions. With 136 rice germplasms in the Korean Rice Core Set (
Kim et al. 2007;
Kim et al. 2016), we conducted a GWAS to survey the QTLs related to cold tolerance in the seedling stage.
MATERIALS AND METHODS
Plant materials and genotype
The KRICE_CORE of 136 accessions (
Kim et al. 2007;
Kim et al. 2016) consisted of 62
Temperate japonica, 19
Tropical japonica, 42
Indica, 8
Aus, 3
Aromatic and 2 Admixture accessions. We implemented sequencing analysis of 136 accessions from the Illumina HiSeq 2500 Sequencing Systems Platform (Illumina Inc., San Diego, CA, USA). In brief, average genome coverage was 8× and we aligned filtered reads were aligned to the rice reference genome (IRGSP 1.0). The filtering parameters for genotypes were as follows; minor allele frequency (MAF) > 5%, missing data < 1%, and heterozygosis ratio < 5%, as implemented using Plink software v1.90 (
Kim et al. 2016).
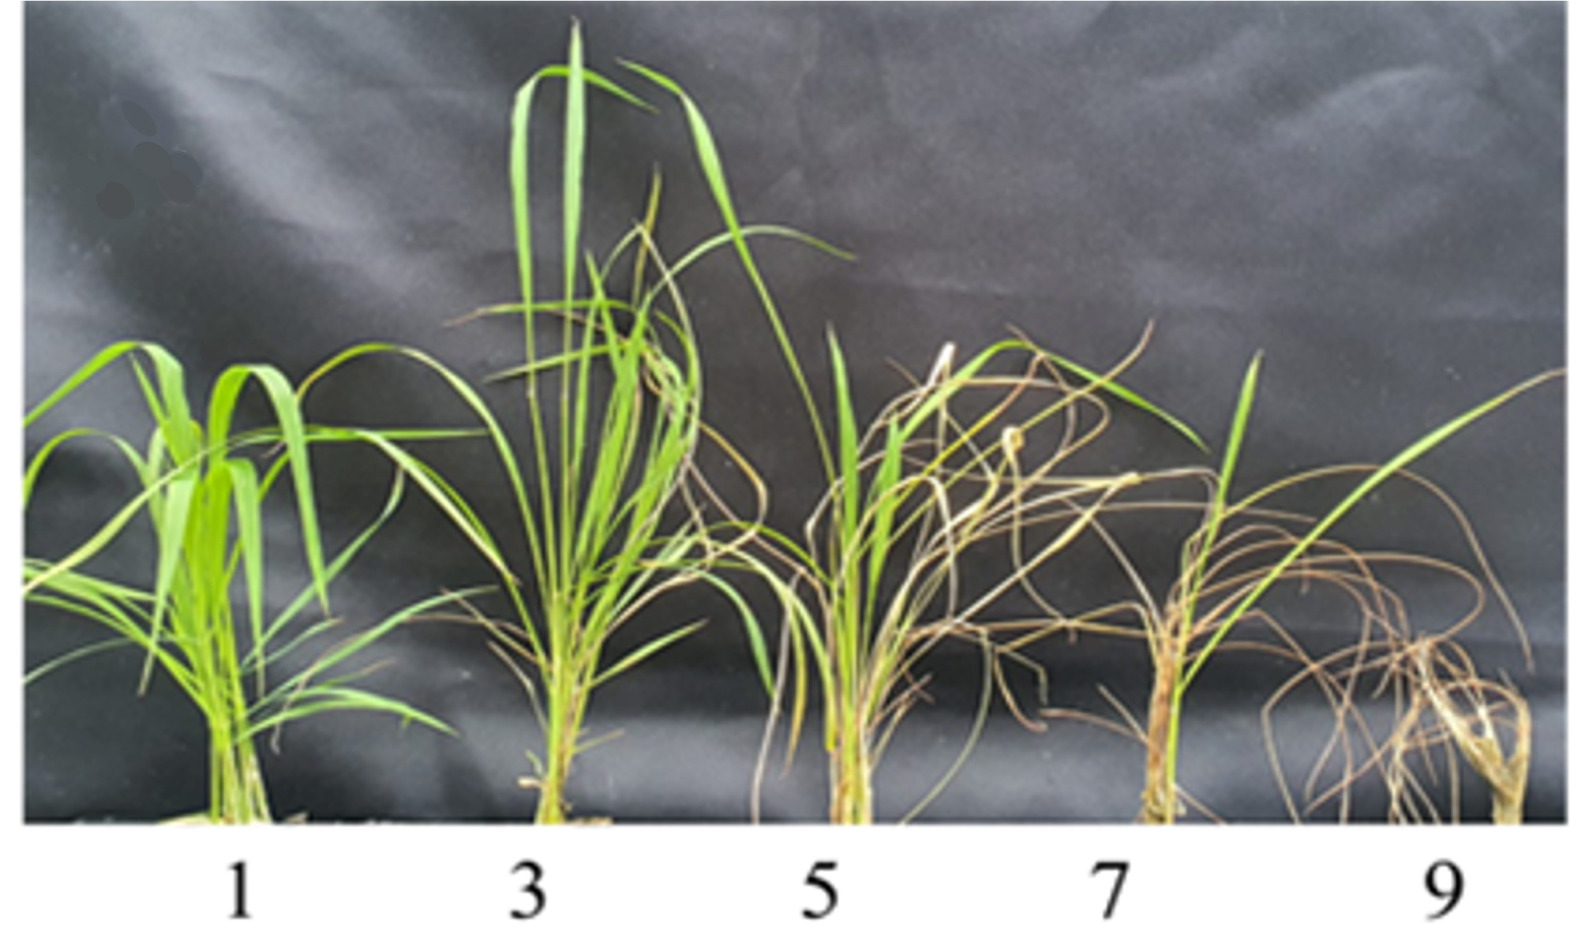
The cold-water treatment for rice seedling were conducted in 2020 at the Chuncheon Substation of the National Institute of Crop Science, RDA (Chunchon, Korea, 127’2’E, 37 16’N, 36 m a.s.l). Rice seedlings were placed in the facility of Chuncheon’s cold-water storage unit which is 50 m long and 8 m wide. This facility can supply 13 ± 1°C of cold water through the cold-water outlet (70 cm gap, 8 mm diameter). Germinated rice seeds were placed in 72-cells trays (each cell size was 3.8 cm × 3.8 cm × 4.5 cm). After two weeks of growing in the normal greenhouse condition, the trays were placed in the cold-water treatment facility and were irrigated 13 ± 1°C cold water for ten days. After the cold treatment, the seedlings recovered for seven days in the greenhouse. The phenotypes of the recovered seedlings were scored. The score standard is ranged from 1 to 9, based on the is evaluated change in leaf color (
Fig. 1).
The score of 1 represents symptoms of no change in leaf color, 5 represents a change to light yellow in half of the leaf, and 9 represents an almost entirely dead leaf.
Genome wide association study
In the first step, we removed SNPs displaying a minimal allele frequency (frequency of the minor allele) lower than 5% were removed. In the GWAS analysis, we used the Mixed Linear Model (MLM) implemented in the GAPIT R package (version 3.0) were used. For MLM with Q-matrix and K-matrix, we computed the kinship (K matrix) and the first three principal components (PCs) of a PCA of genomic data as the Q matrix. The PCA matrix was generated by Plink software (
Purcell et al. 2007). We did the GWAS and plot visualization using the GAPIT package (version 3.0) in R (
Yang et al. 2014). We calculated the association threshold by the formula: ‒log10 (1/number of independent SNPs). Finally, we set the threshold as ‒log10(P) = 4.6 for identification of association loci. We designated the SNP markers located at locus peaks as lead SNPs for the detected loci. LD decay analysis identified 250 kb around the lead SNPs as candidate genomic regions for gene identification.
We extracted candidate genes ware extracted in the range of ± 250 kb on the lead SNP position (region of QTL) based on RAP-DB (
http://rapdb.dna.affrc.go.jp/). We obtained the expression patterns of the candidate genes inside the QTLs from the Rice Expression Profile Database (Rice XPro:
https://ricexpro.dna.affrc.go.jp/). We used haplotype analysis for the selected candidate genes, using all SNP markers from the gene, but excluded missing and heterozygote data. Among the groups of haplotypes, we did phenotypic comparisons with a one-way ANOVA followed by LSD through SAS 9.4.
RESULTS
Phenotypic variations in cold tolerance
We used six rice subgroups consisting of 136 rice accessions were used for evaluating cold tolerance under the cold-water irrigating. The six subgroups were
Temperate japonica,
Tropical japonica,
Indica,
Aus,
Aromatic, and Admixture. The distribution of the cold-tolerantce score skewed to the right, showing the highest frequency in score 9 (
Fig. 2A).
The average score of the 136 lines was 5.8, where 39 accessions showed a cold-tolerance score of 9. We compared the variation between the subspecies groups (
Fig. 2B). The average score of
Indica (42 accessions),
Temperate japonica (62 accessions),
Tropical japonica (19 accessions),
Admixture (2 accessions),
Aromatic (3 accessions),
Aus (8 accessions) was 7.67, 5.8, 5.53, 7.00, 9.00, and 7.75 (
Fig. 2B), respectively. The
Japonica group showed stronger tolerance than did the
Indica and
Aus groups.
The Manhattan plots for the markers significantly associated with cold tolerance at the seedling stage are shown in
Fig. 3
. Associations showing higher than the threshold of ‒log10(P) = 4.6 were detected as a significant association. The significantly associated SNP makers located within ± 250 kb on the lead SNP position was designated to one QTL locus of the lead SNP markers. Seven association loci were detected (
Fig. 3,
Table 1)
. Two associated QTLs were detected on chromosome 1, designated as
qCWS1-1 and
qCWS1-2, explaining 8.63% and 8.96% of the total phenotypic variations, respectively. One associated QTL was detected on chromosome 3, designated as
qCWS3, explaining 8.55% of total phenotypic variations. One associated QTL was detected on chromosome 6, designated as
qCWS6, explaining 8.87% of total phenotypic variations. One associated QTL was detected on chromosome 7, designated as
qCWS7, explaining 8.34% of total phenotypic variations. One associated QTL was detected on chromosome 10, designated as
qCWS10, explaining 9.29% of total phenotypic variations. One associated QTL was detected on chromosome 12, designated as qCWS12, explaining 9.51% of total phenotypic variations. For segments of the seven QTLs, we compared previously reported QTLs (
Table 1). The location of
qCWS7 was overlapped with the previously reported QTL for low temperature germination (
Hou et al. 2004). Five QTLs (
qCWS1-1,
qCWS1-2,
qCWS3,
qCWS6, and
qCWS10) were overlapped with previously reported QTLs for drought tolerance (
Ali et al. 2000;
Hemamalini et al. 2000;
Zhang et al. 2001;
Wan et al. 2003;
Li et al. 2005).
To identify candidate genes responsible for cold tolerance under the cold-water irrigating, we extracted all annotated genes located within 500 kb of the QTL regions were extracted based on the RAP-DB (IRGSP 1.0). There were 966 genes were in the seven QTL regions where 286 genes were located in chromosome 1, 176 genes in chromosome 3, 132 genes in chromosome 6, 160 genes in chromosome 7, 139 genes in chromosome 10, and 73 genes in chromosome 12. We looked for the expression patterns of the 966 genes in the previously reported RNA-seq database (
Kawahara et al. 2016). Considering our cold treating method, we focused on the gene expression in the roots and shoots at the seedling stage. We have no doubt that other genes not showing specific gene expression patterns in roots might be involved in the cold-tolerant response. However, there are many candidate genes in the regions of the seven QTLs; so we focused only on the genes showing specific expression patterns in the roots and shoots. We detected an increase of 70 genes in the seedling roots and subjected them to haplotype analysis. Given those results and the previously known functions of the genes, we arbitrarily selected five genes showing significant differences in the haplotype analysis as candidate genes for cold tolerance under cold-water irrigation. The haplotype analyses of the five candidate genes are presented in
Fig. 4-8.
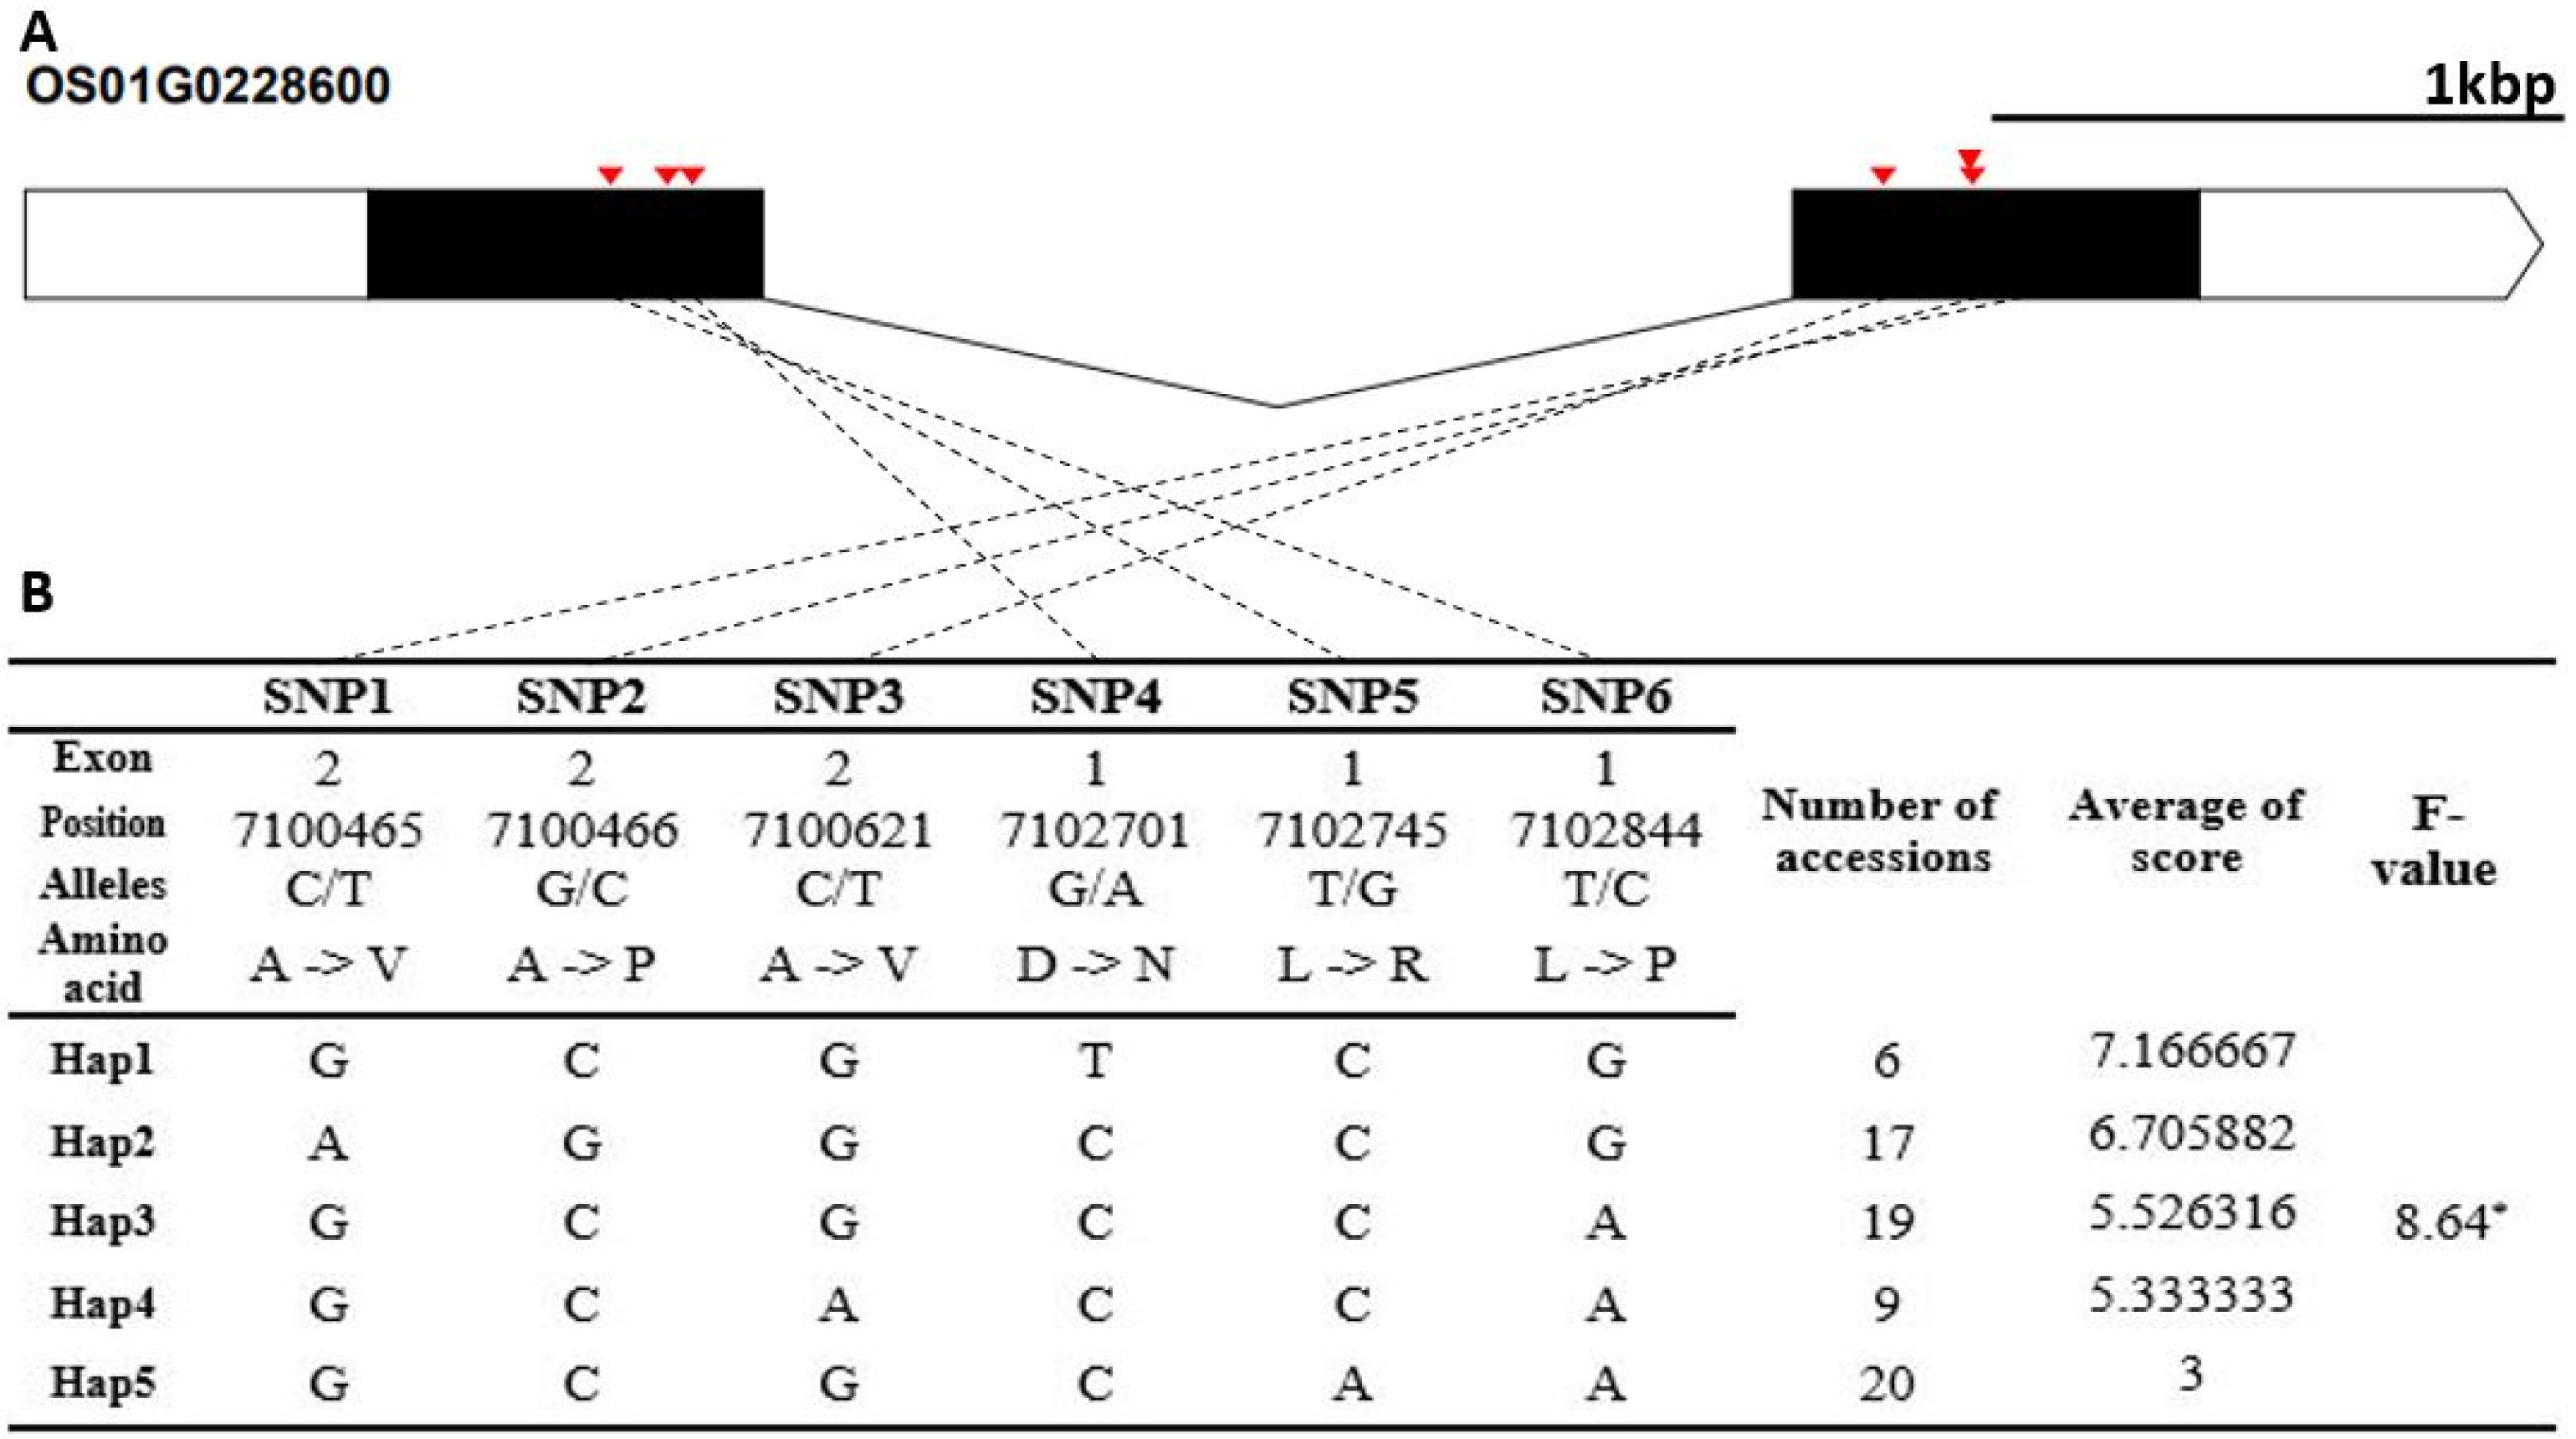
We used only the SNPs in exon regions for analyzing haplotypes and haplotype variations, where heterozygous SNPs and SNPs with missing data were filtered. The candidate gene of Os01g0228600 encodes a cytosolic hydroxypyruvate reductase. It contained six non-synonymous SNPs (C→T, Chr1_7100465, A→V substitution; G→C, Chr1_7100466, A→P substitution; C→T, Chr1_7100621, A→V sub-stitution; G→A, Chr1_7102701, D→N substitution; T→G, Chr1_7102745, L→R substitution; T→C, Chr1_7102844, L→P substitution) that formed five haplotypes (
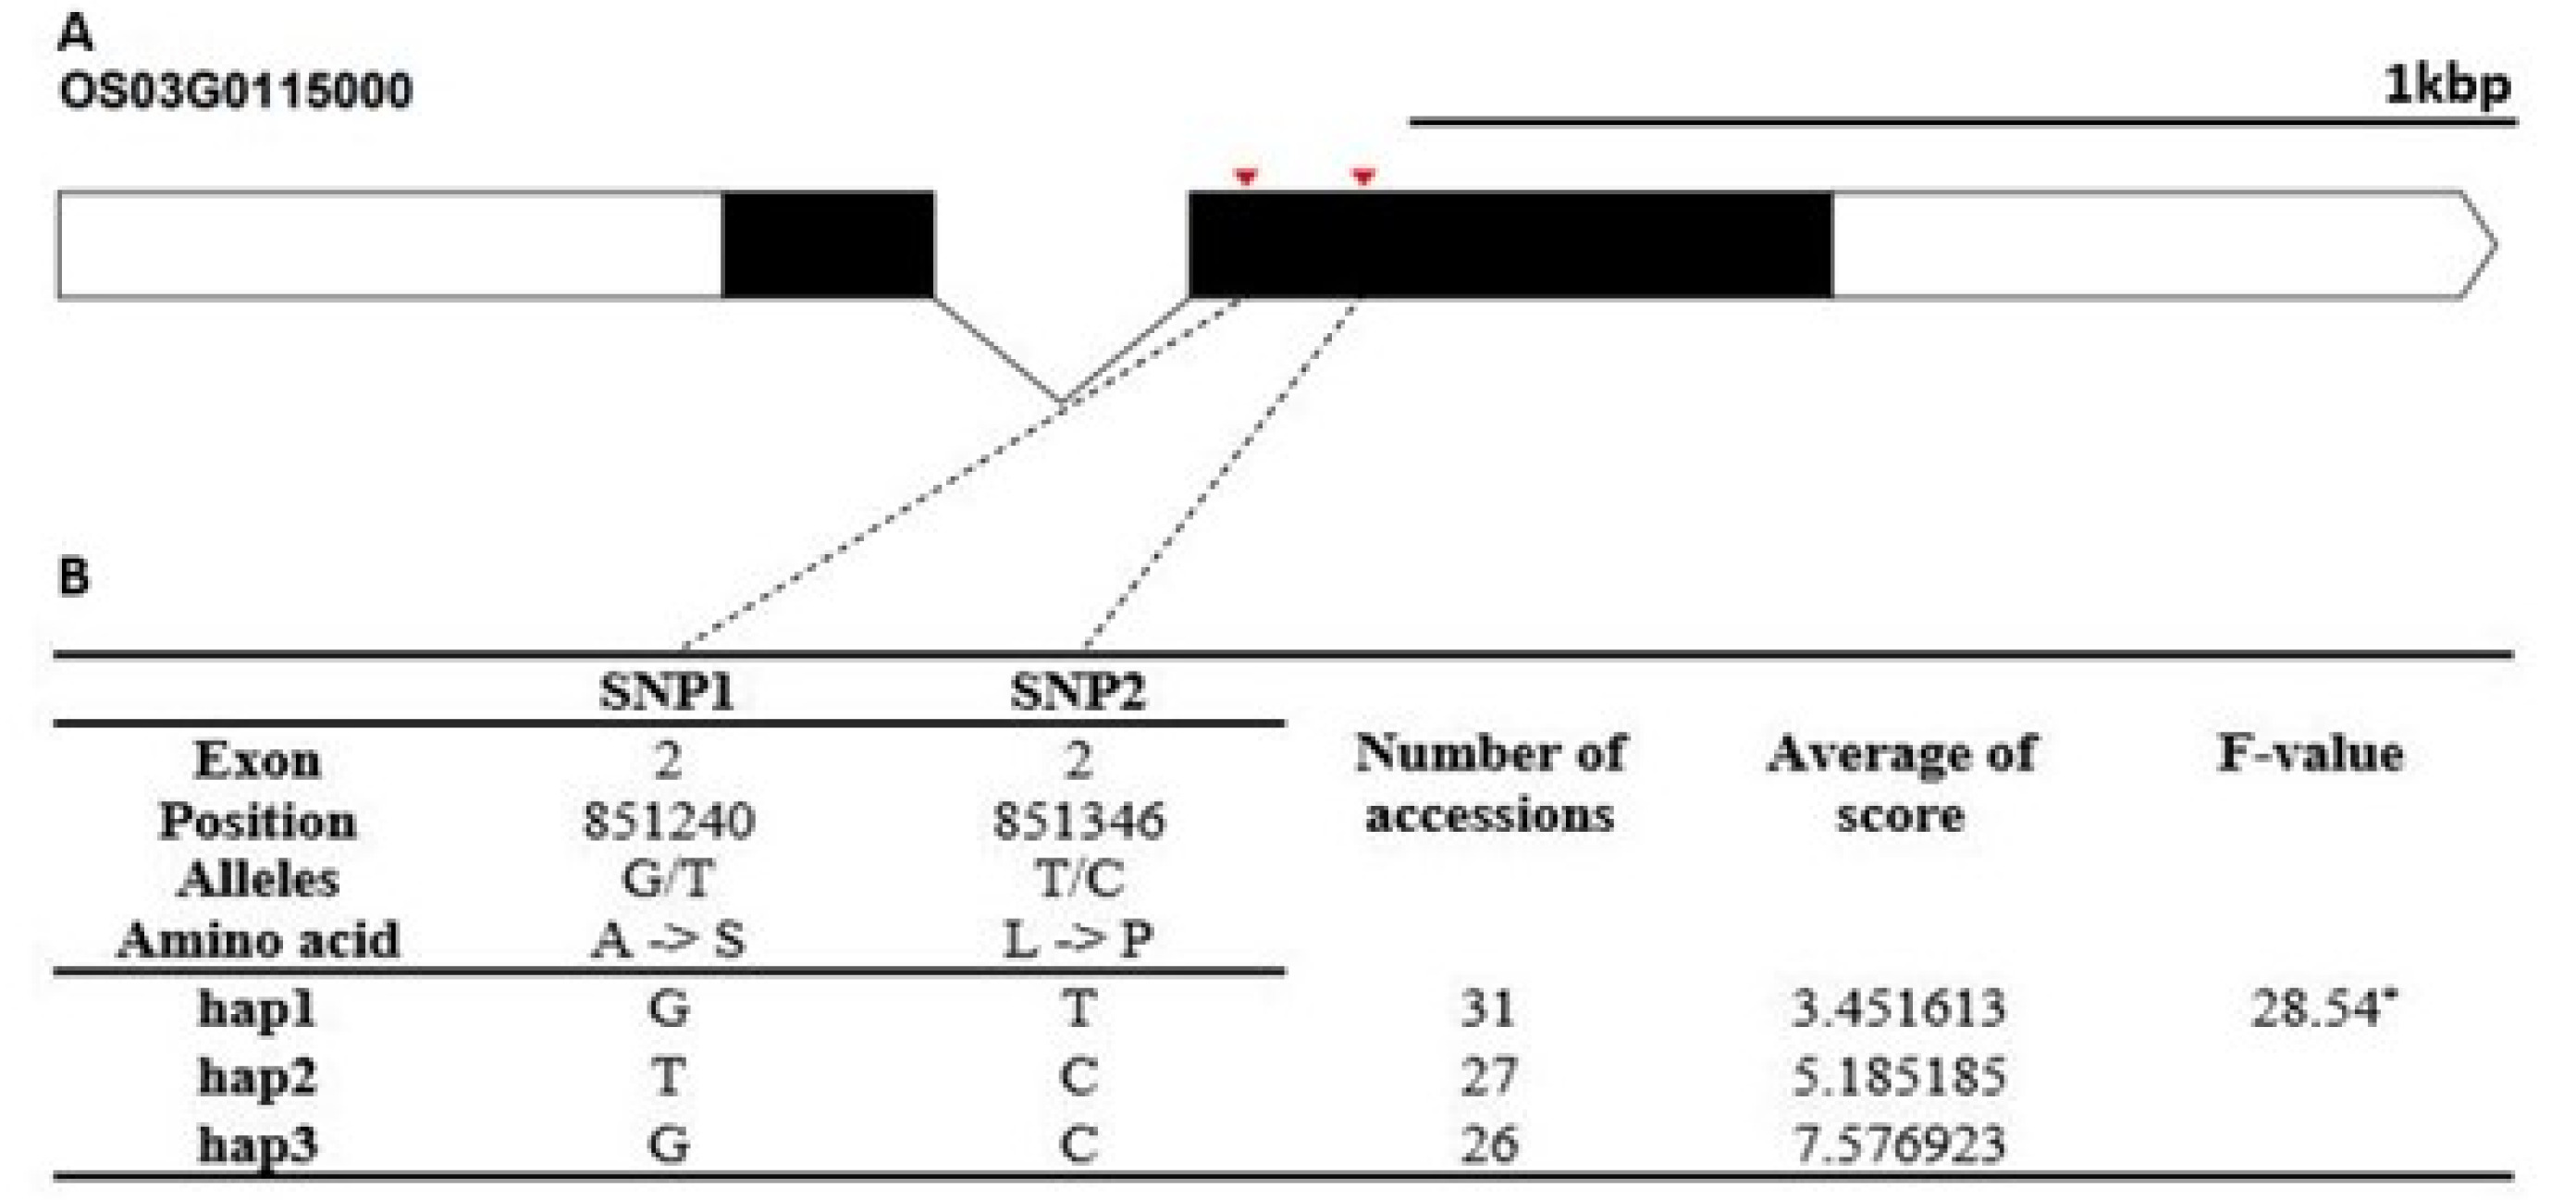
Fig. 4). The Hap5 of Os01g0357800 was the superior genotype in cold tolerance. The candidate gene of Os03g0115000 encodes a cupredoxin domain containing protein. It contained two non-synonymous SNPs SNPs (G→T, Chr3_851240, A→S substitution; T→C, Chr3_851346, L→P substitution) that formed three haplotypes (
Fig. 5). The cold-tolerance score of Hap1 differed from that of Hap2 and Hap3.
The candidate gene of Os06g0612800 encodes a stress associated protein (SAP) gene family. It contained a non-synonymous SNPs SNPs (C→T, Chr6_851240, M→T substitution) that formed two haplotypes (
Fig. 6). The cold tolerance score of Hap1 differed significantly from that of Hap2. The candidate gene of Os10g0482900 encodes a thioredoxin fold domain containing protein. It contained three non-synonymous SNPs (T→G, Chr10_18232294, S→R substitution; A→G, Chr10_18232294, K→E sub-stitution; C→T, Chr10_18232851, A→V substitution) that formed three haplotypes (
Fig. 7). The cold tolerance score of Hap1 differed from that of Hap2 and Hap3. The candidate gene of Os12g0552500 encode a universal stress protein domain containing protein. It contained two non-synonymous SNPs (T→G, Chr12_22430675, S→A substitution; G→T, Chr12_22431727, A→S substitution) that formed two haplotypes (
Fig. 8). The Hap2 differed significantly from that of Hap1.
DISCUSSION
In general, rice cold tolerance in seedling rice has been evaluated in the temperature-controlled growth chamber, where the rice shoot is mainly affected by cold air. In this study, we evaluated the phenotypic variations as a cold-tolerantce score for rice seedling under cold- water irrigating, where the irrigated cold water continuously affected mainly the roots and basal shoots. The treated seedlings recovered from the cold treatment by replacing them in the greenhouse for seven days. Therefore, the cold-tolerance score represented both the damage from the cold treatment and the recovering ability. The overall distribution of cold-tolerance scores was skewed to the right (cold sensitive), implyingd that the cold treatment in this study was effective.
Among the detected seven QTLs, five were overlapped with previously reported QTLs for unfavorite environ-mental conditions. Interestingly, the location of
qCWS7 was overlapped with the previously reported QTL for low temperature germination(
Hou et al. 2004). Even though the QTLs were detected from the RIL population where the cold tolerant parent was the japonica variety USSR5 and the target traits was germinating ability under the low temperature, the overlapped detection of
qCWS7 in this study suggested that the possible role of cold tolerance in this area. Despite of the haplotype analysis, we did not select a candidate gene in this region. Since we focused on the genes expressed in roots and shoots thus further investigation with other approaching for selecting candidate genes needs to be applied in these QTL regions. Besides the QTL for cold tolerance, five QTLs (
qCWS1-1,
qCWS1-2,
qCWS3,
qCWS6, and
qCWS10) overlapped with previously reported QTLs for drought tolerance, suggesting that these QTLs may play a role in the general response to abiotic stresses.
Based on the gene expression patterns, haplotype analysis, and previously known function of the genes, we suggested five candidate genes as for cold tolerance. Os01g0228600 encodes a cytosolic hydroxypyruvate reductase (HPR) which is responsible for the conversion of hydroxypyruvate into glycerate in the photorespiration cycle (
Shi et al. 2021). Photorespiration helps maintain normal physiological metabolism in higher plants. In barely, the important involve of photorespiration in drought response and the involve of HPR induction (WINGLER
et al. 1999). Os06g0612800 encodes a stress associated protein (SAP) gene family and Os12g0552500 encodes a universal stress protein (USP). From the annotating and the functional study, these two stress related genes were known to be involved in stress response. For the SAP, overexpression in transgenic rice and tobacco conferred tolerance to salt, drought, cold stress (
Kanneganti and Gupta 2008). For the USP, 44 USP genes have been detected in rice and analysis of the expression data in multiple stress conditions including -heat, salt, drought, dehydration, and submergence- revealed that Os12g0552500 was upregulated in those stress conditions (
Arabia et al. 2021). Os03g0115000 encodes a cupredoxin domain containing protein that has a type I copper centers and is involved in inter-molecular electron transfer reaction (
Dennison 2005). In maize, cupredoxin domain-containing protein was reported to be involved in modulation of redox homeostasis in kernel development (
Zhang et al. 2021). Os10g0482900 encodes a thioredoxin fold domain containing protein, which is an antioxidants in reactive oxygen species (ROS) scavenging in plant responses against stresses (
Park et al. 2019). The increase of Os10g0482900 under the nitrogen starving stress condition was reported (
Shin et al. 2018). These two genes of Os03g0115000 and Os10g0482900 are involved in redox homeostasis in plant cells. Various redox-active compounds, such as ascorbate, glutathione, NAD(P)H, and proteins from the thioredoxin superfamily, contribute to the general redox homeostasis in the plant cells (
Kapoor et al. 2015). Accumulating evidence has shown that the redox state of the cell affects its proliferation/differentiation program and redox poising, which involves the movement of electrons from multiple sites in respiratory and photosynthetic electron-transport chains to molecular oxygen to triggers the formation of superoxide to produce other ROS (
Huang et al. 2019). With the redox homeostasis gene in plant cells, the cells percepts abiotic stress and triggers physiological responses where antioxidants play a significant role as a signaling compounds, because they also possess a vibrant metabolic interface (
Huang et al. 2019).
From previously reported studies and the known functions of these five candidate genes, the direct and indirect evidence suggested their possible role in cold tolerance in rice; so it is highly worthwhile to conduct future evaluation of the molecular mechanisms of these genes in stress response in cold tolerance and other abiotic stress as well.
ACKNOWLEDGEMENTS
This research was funded by Korea Institute of Planning and Evaluation for Technology in Food, Agriculture and Forestry (IPET) through Agri-Food Export Business Model Development Program, funded by Ministry of Agriculture, Food and Rural Affairs (MAFRA) (320105-3).
This research was funded by Rural Development Administration, grant number PJ01579403.
Fig. 1Representation of cold tolerant score stress at seedling stage. 1: Resistance-9: Highly sensitive.

Fig. 2The distribution of cold tolerant score for the 136 rice accessions. (A) Histogram of the cold tolerant score for 136 accessions. The dotted line is the moving average. Different colors indicated the cold tolerance score: blue 1, orange 2, gray 3, yellow 4, sky blue 5, green 6, black 7, pale gray 8, and dark gray 9. (B) Cold tolerant score grouped by box plot according to their ecotype.
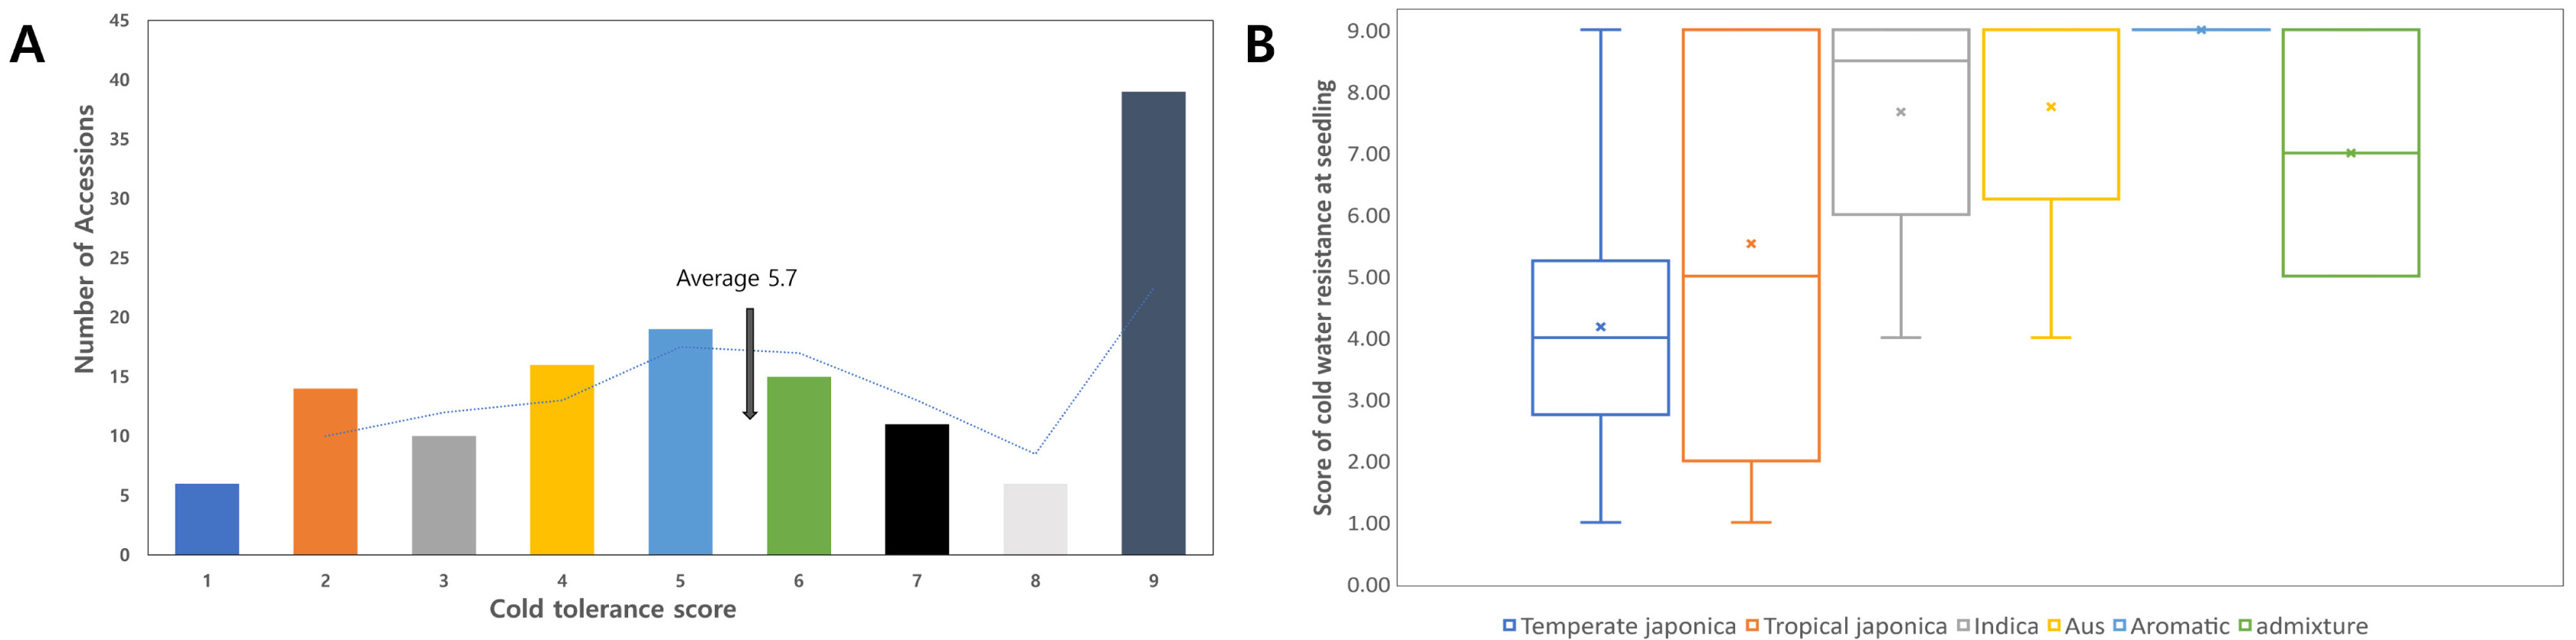
Fig. 3Manhattan plots and Q-Q plot for the cold tolerant scores of 136 rice accessions. (A) Manhattan plots (B) Q-Q plot. It indicated the ‒log10(P) value on y axis and the SNP position of each chromosome on x axis. The horizontal blue line indicated thresholds (‒log10(P) = 4,60).
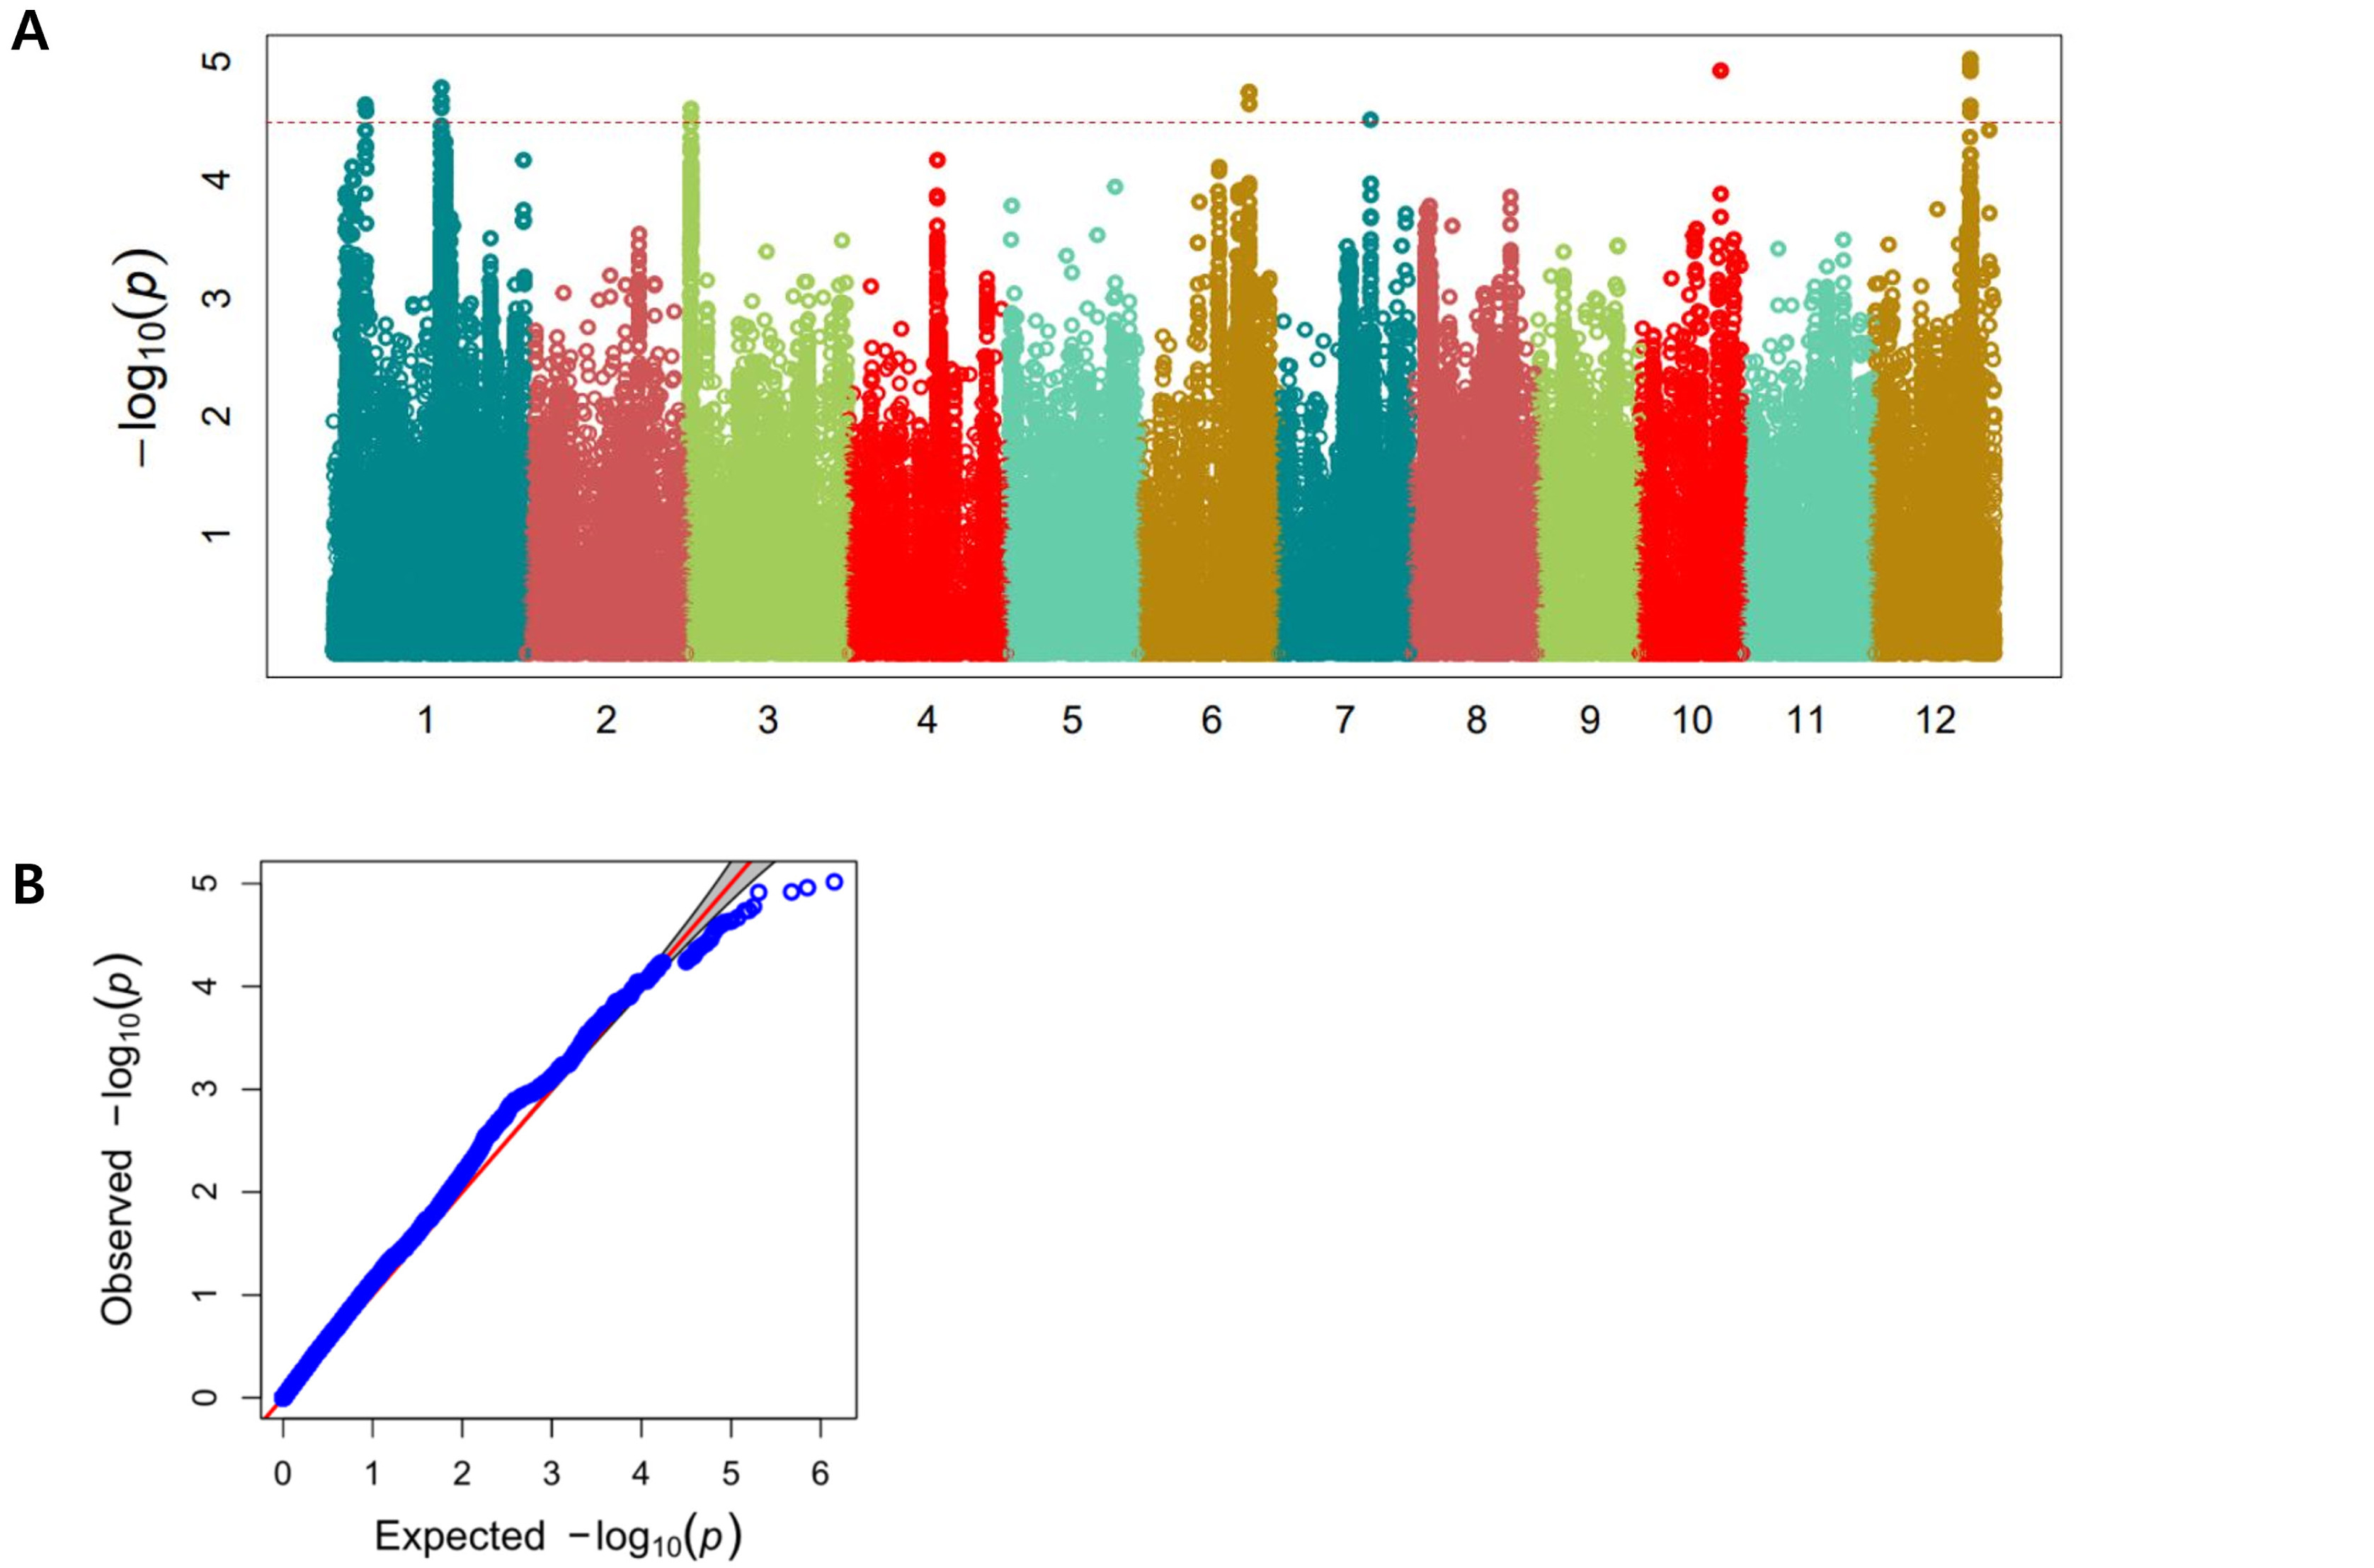
Fig. 4Haplotype analysis result of Os01g0228600. (A) Gene structure and SNPs positions on Os01g0228600. Black box and line indicated exons and introns, respectively. Red marks indicated SNPs. (B) Haplotypes and their average score of cold tolerance.

Fig. 5Haplotype analysis result of Os03g0115000. (A) Gene structure and SNPs positions on Os03g0115000. Black box and line indicated exons and introns, respectively. Red marks indicated SNPs. (B) Haplotypes and their average score of cold tolerance.

Fig. 6Haplotype analysis result of Os06g0612800. (A) Gene structure and SNPs positions on Os06g0612800. Black box and line indicated exons and introns, respectively. Red marks indicated SNPs. (B) Haplotypes and their average score of cold tolerance.
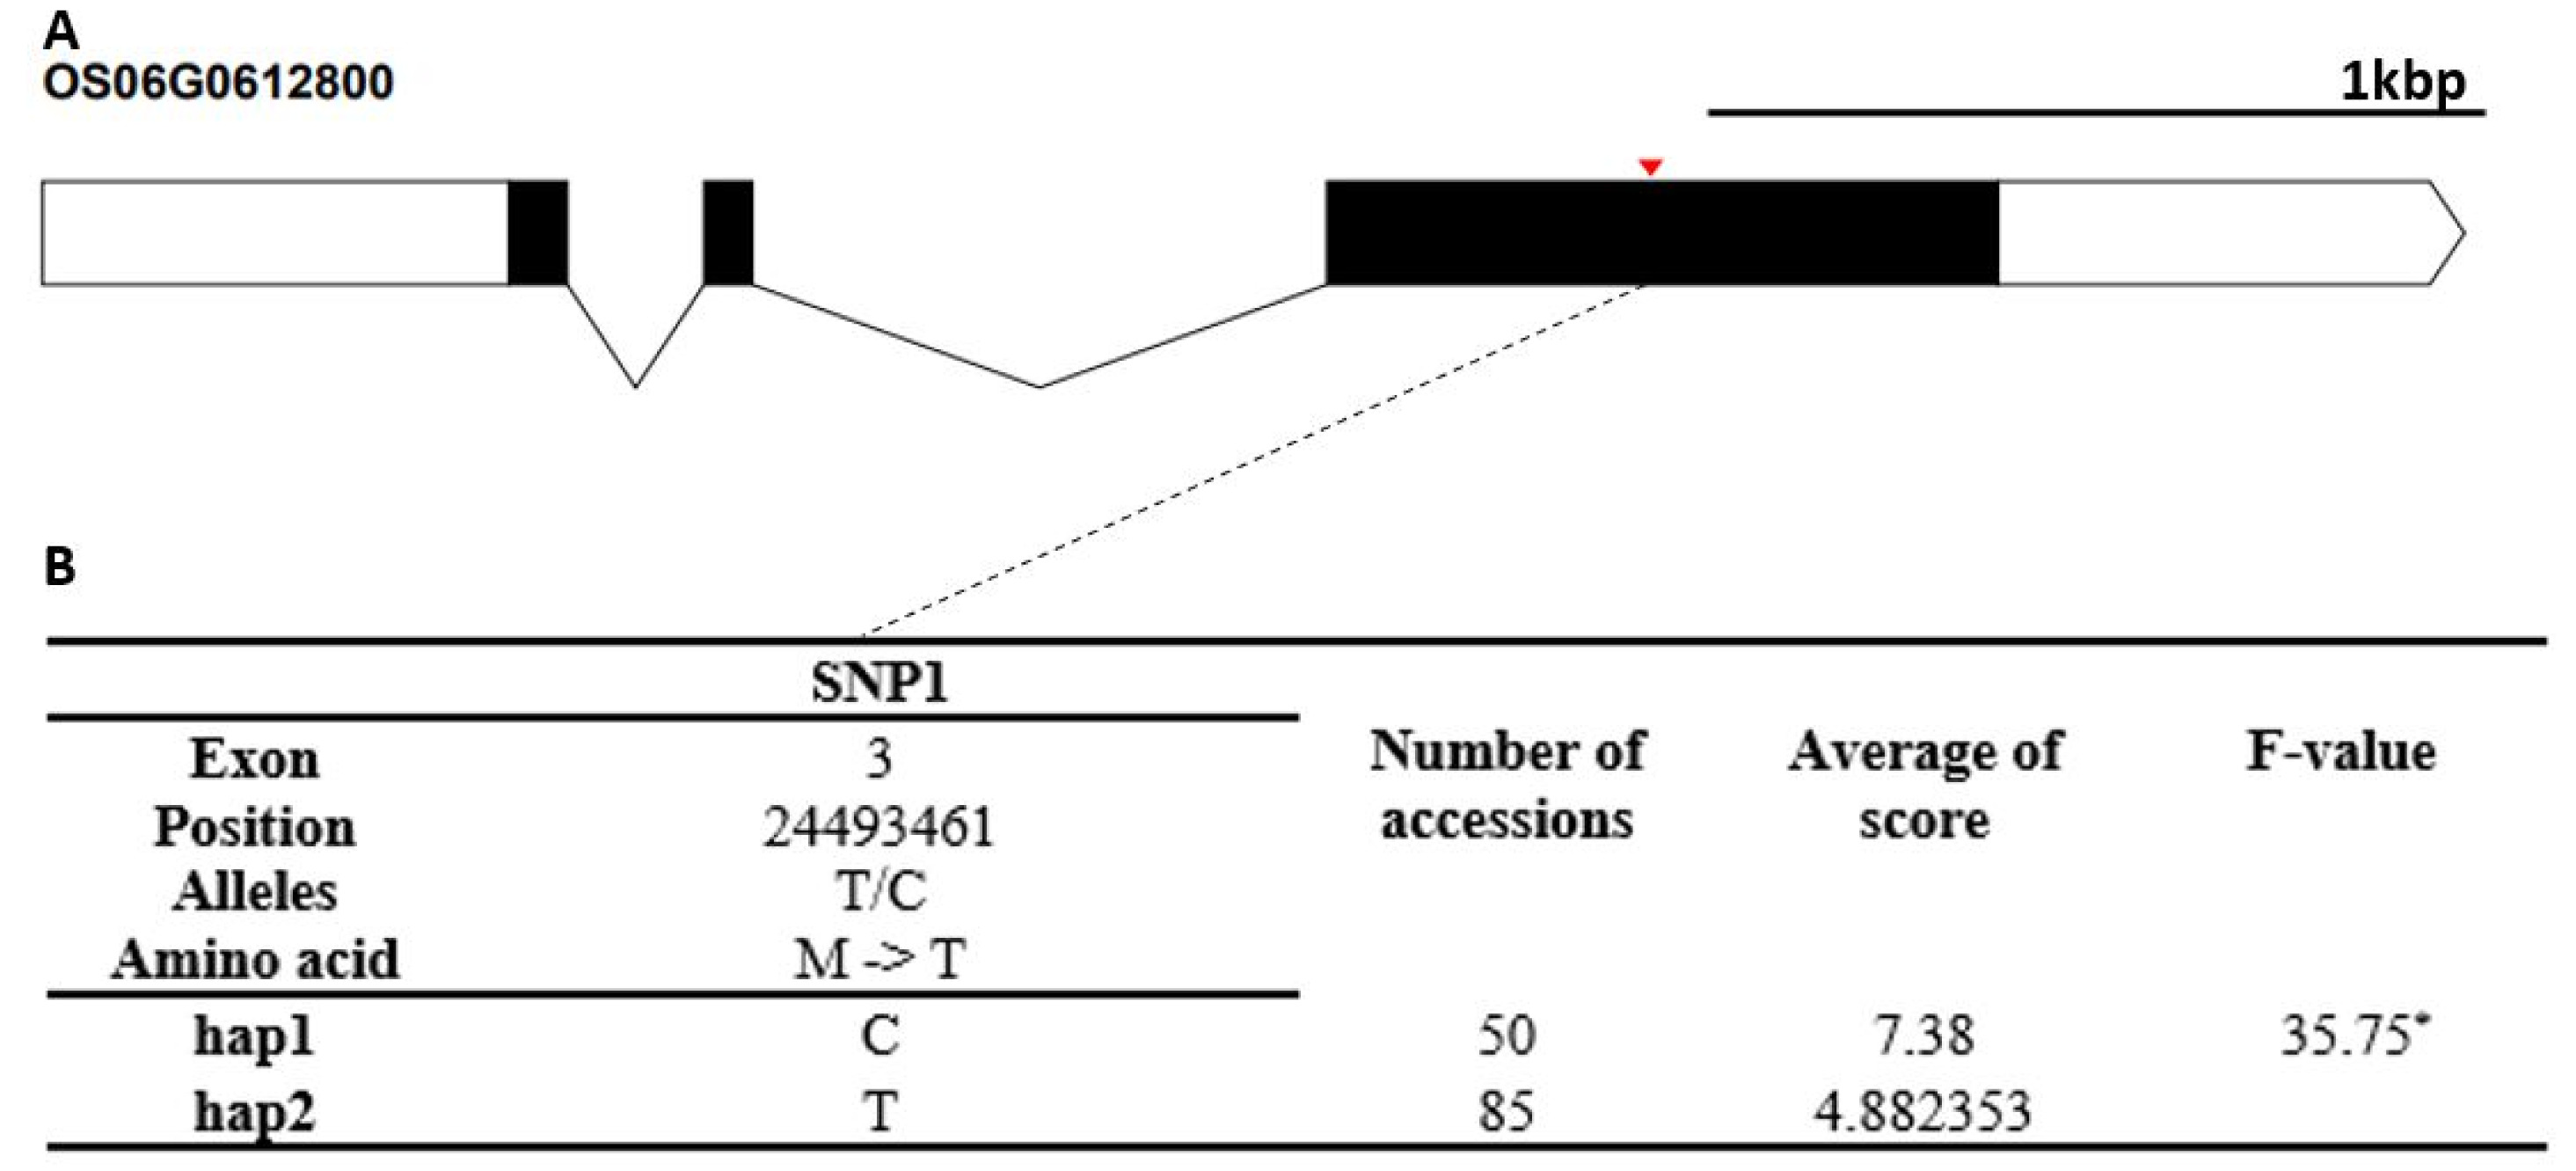
Fig. 7Haplotype analysis result of Os10g0482900. (A) Gene structure and SNPs positions on Os10g0482900. Black box and line indicated exons and introns, respectively. Red marks indicated SNPs. (B) Haplotypes and their average score of cold tolerance.
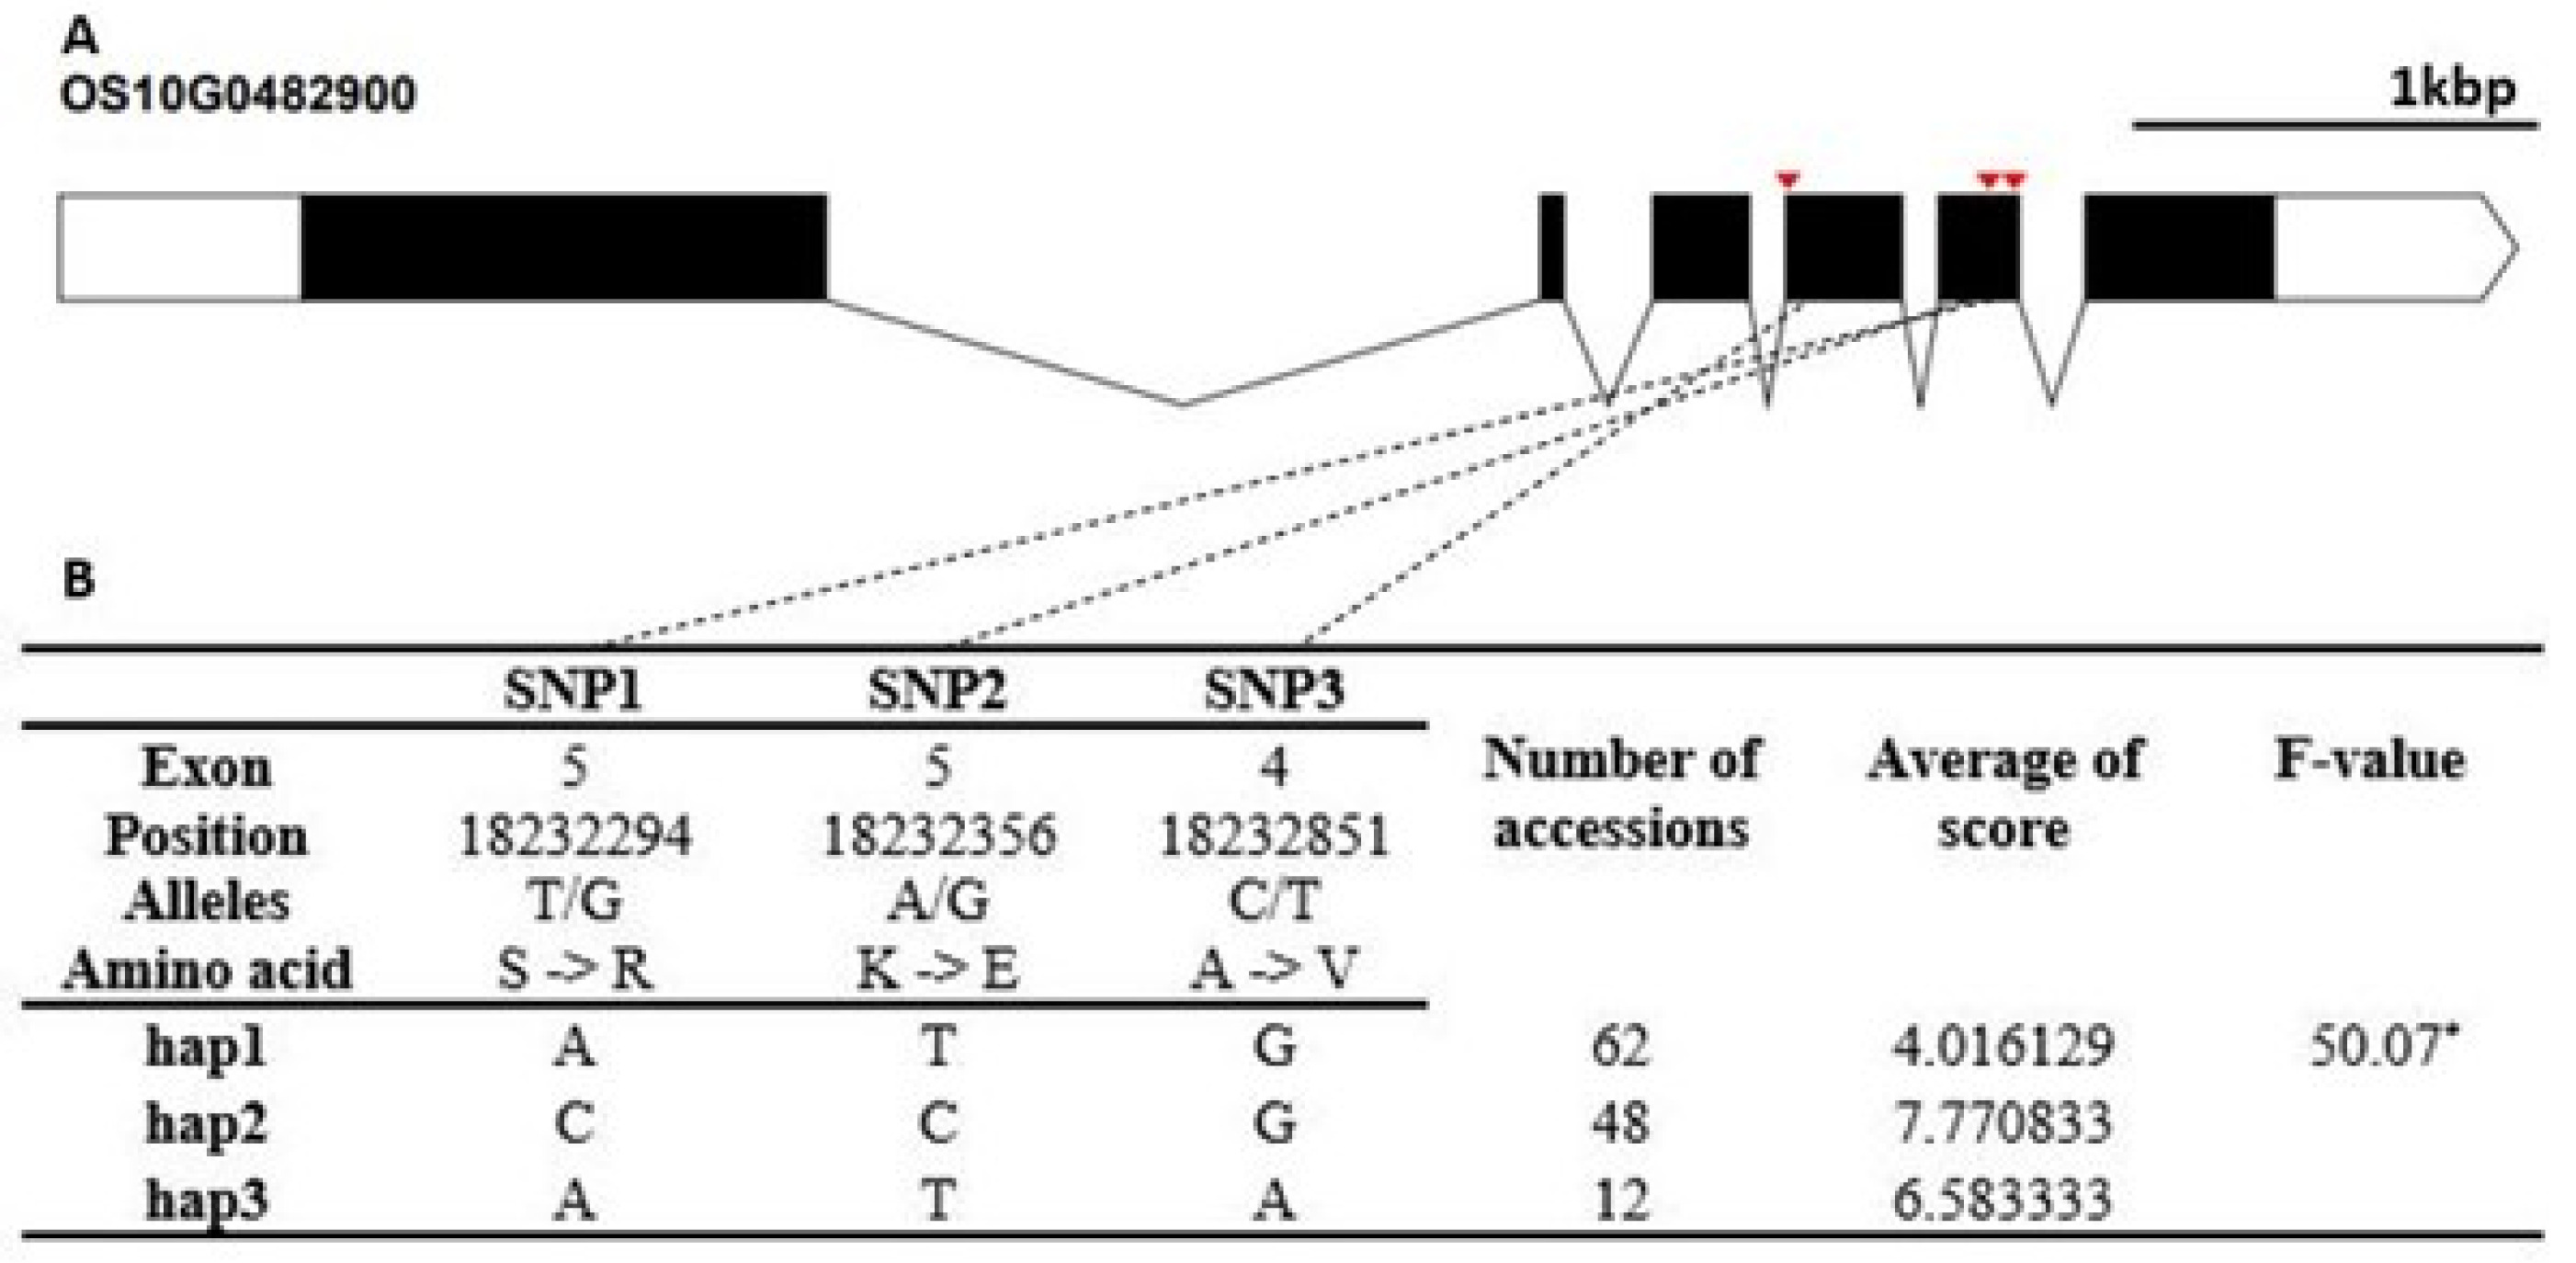
Fig. 8Haplotype analysis result of Os12g0482900. (A) Gene structure and SNPs positions on Os12g0482900. Black box and line indicated exons and introns, respectively. Red marks indicated SNPs. (B) Haplotypes and their average score of cold tolerance.
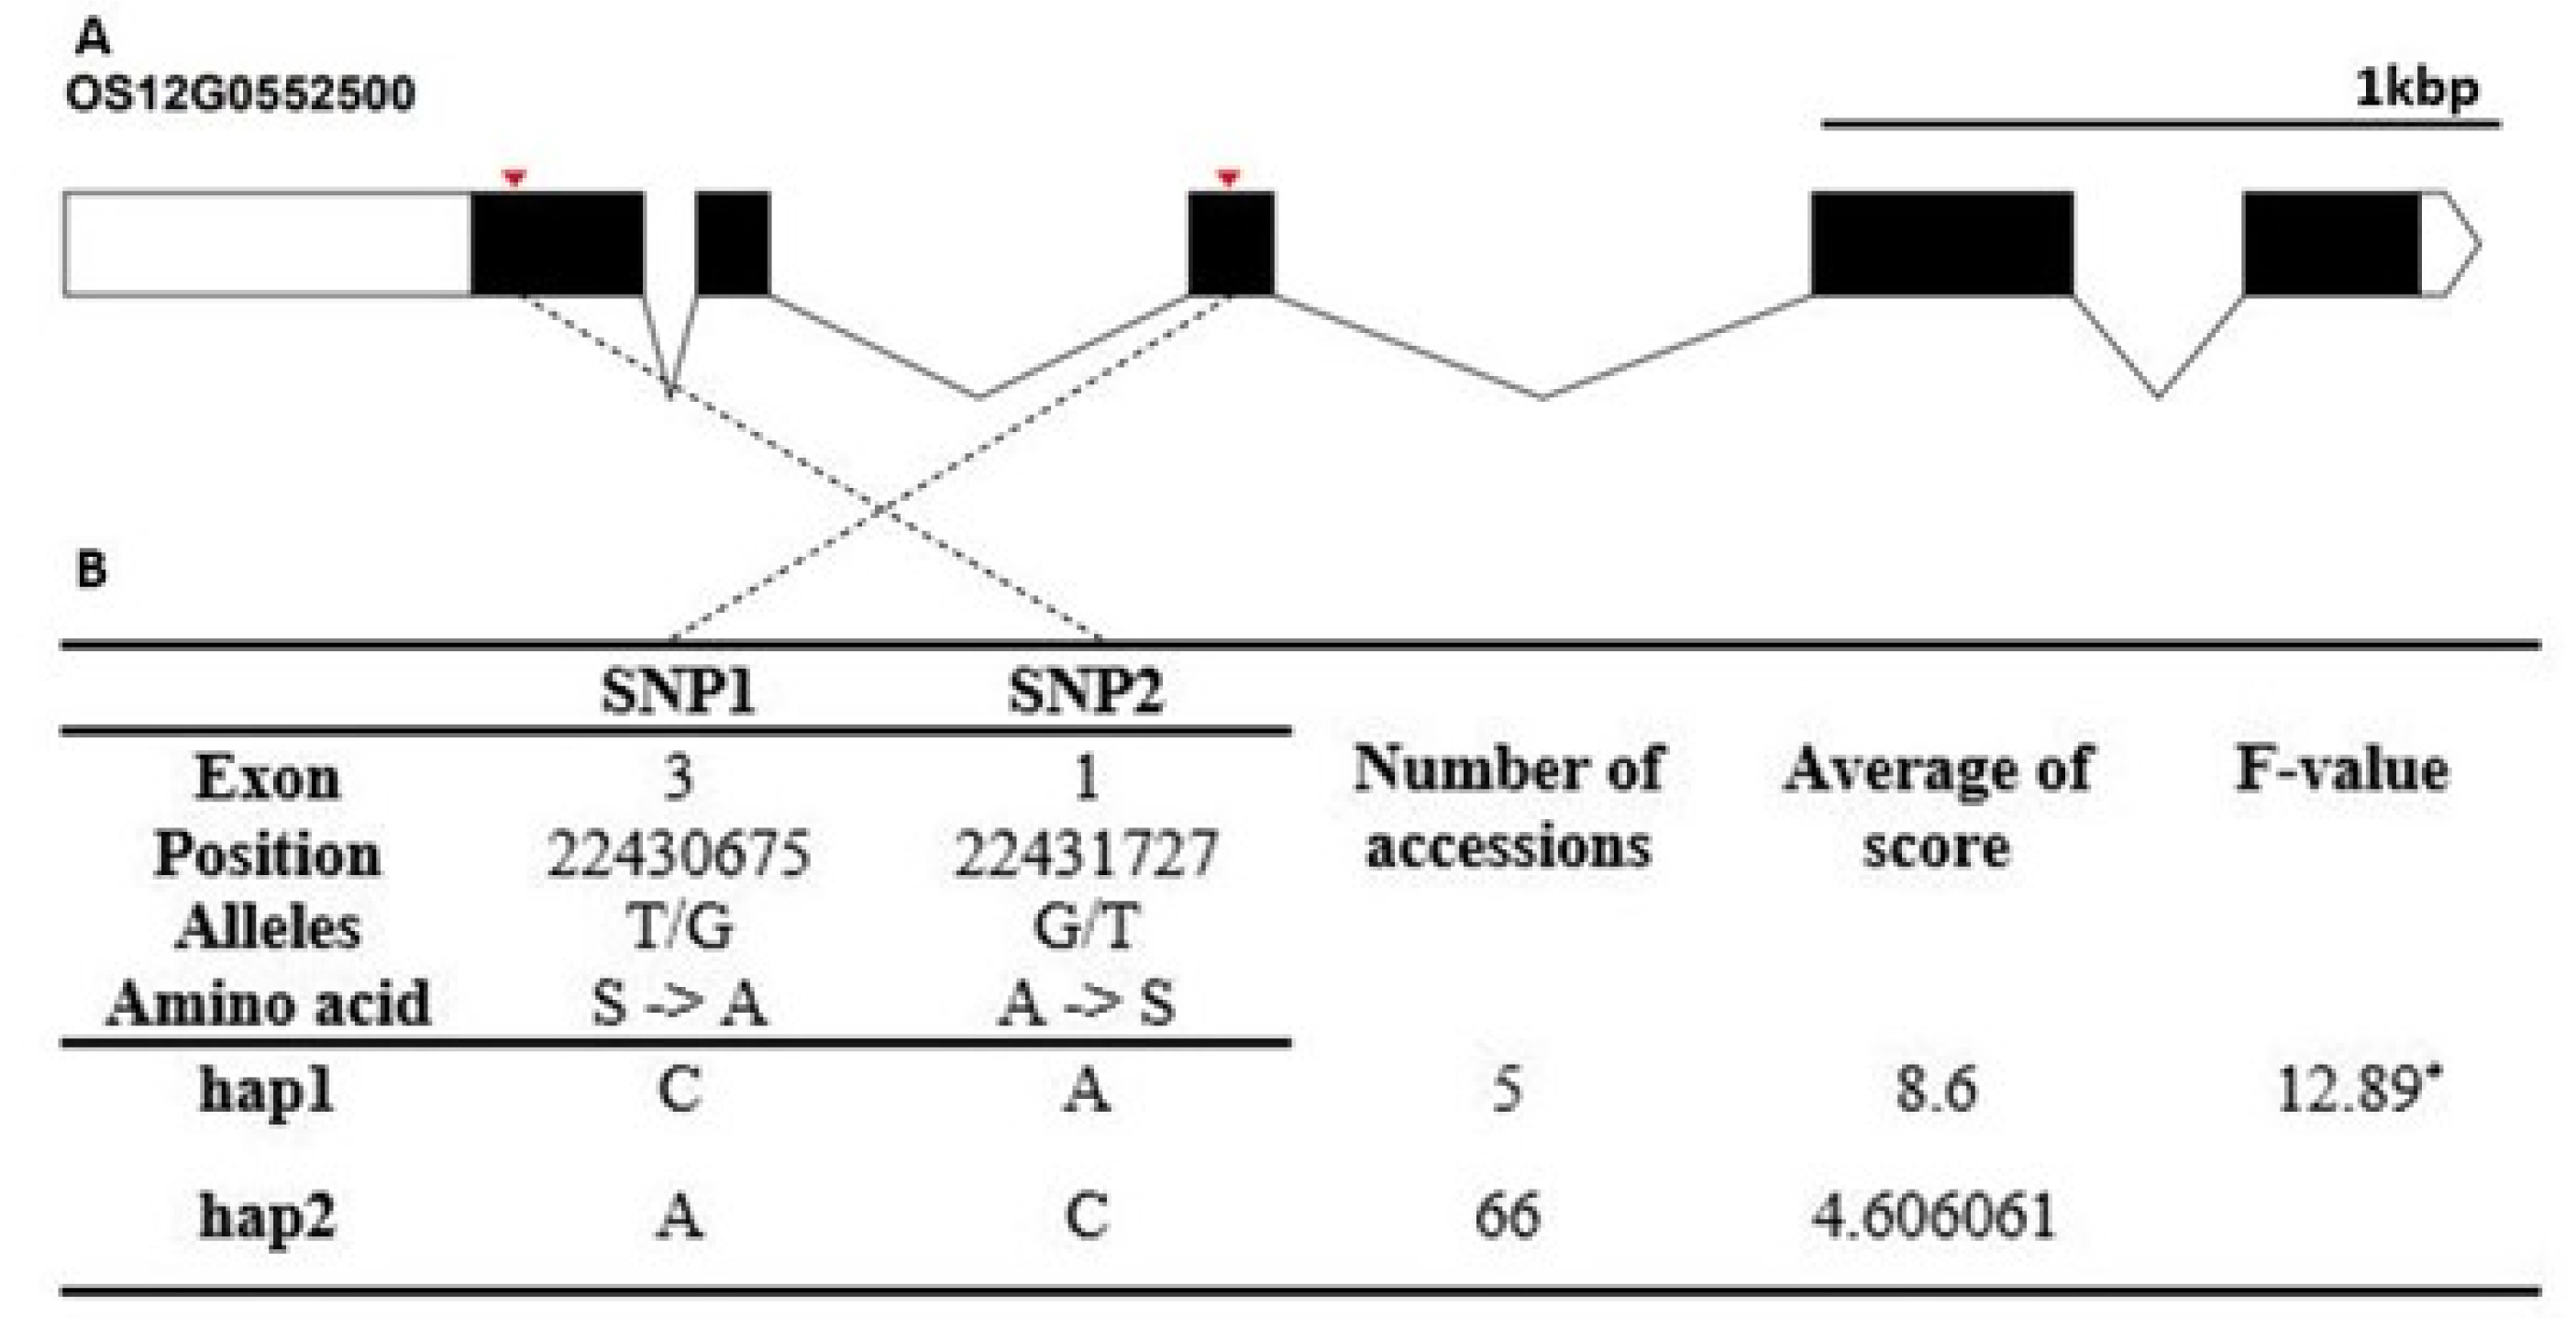
Table 1The locations of QTL of detected in GWAS and previously reported QTL.
Table 1
|
QTL |
Lead SNP |
Chr |
‒log10(P) |
PVE(%) |
Reported QTL |
Reference of previously reported QTLs |
|
Related trait |
|
qCWS1-1
|
7,239,225 |
1 |
4.63 |
8.63 |
Drought tolerance |
Wan et al. 2003 |
|
qCWS1-2
|
24,297,420 |
1 |
4.78 |
8.96 |
Drought tolerance |
Li et al. 2005 |
|
qCWS3
|
1,094,354 |
3 |
4.6 |
8.55 |
Drought tolerance |
Hemamalini et al. 2000 |
|
qCWS6
|
24,641,646 |
6 |
4.74 |
8.87 |
Drought tolerance |
Zhang et al. 2001 |
|
qCWS7
|
20,640,777 |
7 |
4.51 |
8.34 |
Cold tolerance |
Hou et al. 2004 |
|
qCWS10
|
18,189,402 |
10 |
4.92 |
9.29 |
Drought tolerance |
Ali et al. 2000 |
|
qCWS12
|
22,021,391 |
12 |
5.02 |
9.51 |
Blast resistance |
Bagali et al. 1998 |
References
- Ali ML, Pathan MS, Zhang J, Bai G, Sarkarung S, Nguyen HT. 2000. Mapping QTLs for root traits in a recombinant inbred population from two indica ecotypes in rice. Theor. Appl. Genet.. 101: 756-766.
- Arabia S, Sami AA, Akhter S, Sarker RH, Islam T. 2021. Comprehensive in silico Characterization of Universal Stress Proteins in Rice (Oryza sativa L.) With Insight Into Their Stress-Specific Transcriptional Modulation. Front. Plant Sci. 1589:
- Dennison C. 2005. Investigating the structure and function of cupredoxins. Coord. Chem. Rev.. 249: 3025-3054.
- Fairhurst T, Dobermann A. 2002. Rice in the Global Food Supply. World. 5: 454-349.
- Ham TH, Kwon Y, Lee Y, Choi J, Lee J. 2021. Genome-Wide Association Study Reveals the Genetic Basis of Cold Tolerance in Rice at the Seedling Stage. Agriculture. 11: 318
- Hemamalini GS, Shashidhar HE, Hittalmani S. 2000. Molecular marker assisted tagging of morphological and physiological traits under two contrasting moisture regimes at peak vegetative stage in rice (Oryza sativa L.). Euphytica. 112: 69-78.
- Hou MY, Wang CM, Jiang L, Wan JM, Yasui H, Yoshimura A. 2004. Inheritance and QTL mapping of low temperature germinability in rice (Oryza sativa L.). Yi Chuan Xue Bao. 31: 701-706.
- Huang HL, Ullah F, Zhou DX, Yi M, Zhao Y. 2019. Mechanisms of ROS Regulation of Plant Development and Stress Responses. Front. Plant Sci.. 10: 800
- Jena KK, Kim SM, Suh JP, Yang CI, Kim YG. 2012. Identification of Cold-Tolerant Breeding Lines by Quantitative Trait Loci Associated with Cold Tolerance in Rice. Crop Sci.. 52: 517-523.
- Kandpal RP, Rao NA. 1985. Alterations in the Biosynthesis of Proteins and Nucleic-Acids in Finger Millet (Eleucine-Coracana) Seedlings during Water-Stress and the Effect of Proline on Protein-Biosynthesis. Plant Sci.. 40: 73-79.
- Kanneganti V, Gupta AK. 2008. Overexpression of OsiSAP8, a member of stress associated protein (SAP) gene family of rice confers tolerance to salt, drought and cold stress in transgenic tobacco and rice. Plant Mol. Biol.. 66: 445-462.
- Kapoor D, Sharma R, Handa N, Kaur H, Rattan A, Yadav P, et al. 2015. Redox homeostasis in plants under abiotic stress: role of electron carriers, energy metabolism mediators and proteinaceous thiols. Front. Environ. Sci.. 3: 13
- Kawahara Y, Oono Y, Wakimoto H, Ogata J, Kanamori H, Sasaki H, et al. 2016. TENOR: Database for Comprehensive mRNA-Seq Experiments in Rice. Plant Cell Physiol.. 57: e7-e7.
- Kim KW, Chung HK, Cho GT, Ma KH, Chandrabalan D, Gwag JG, et al. 2007. PowerCore: a program applying the advanced M strategy with a heuristic search for establishing core sets. Bioinformatics. 23: 2155-2162.
- Kim SJ, Lee SC, Hong SK, An K, An G, Kim SR. 2009. Ectopic expression of a cold-responsive OsAsr1 cDNA gives enhanced cold tolerance in transgenic rice plants. Mol. Cells. 27: 449-458.
- Kim TS, He Q, Kim KW, Yoon MY, Ra WH, Li FP, et al. 2016. Genome-wide resequencing of KRICE_CORE reveals their potential for future breeding, as well as functional and evolutionary studies in the post-genomic era. BMC Genomics. 17: 1-13.
- Li ZC, Mu P, Li CP, Zhang HL, Li ZK, Gao YM, et al. 2005. QTL mapping of root traits in a doubled haploid population from a cross between upland and lowland japonica rice in three environments. Theor. Appl. Genet.. 110: 1244-1252.
- Nakashima K, Tran LSP, Van Nguyen D, Fujita M, Maruyama K, Todaka D, et al. 2007. Functional analysis of a NAC-type transcription factor OsNAC6 involved in abiotic and biotic stress-responsive gene expression in rice. Plant J.. 51: 617-630.
- Park SC, Kim IR, Kim JY, Lee Y, Yoo SH, Jung JH, et al. 2019. Functional Characterization of a Rice Thioredoxin Protein OsTrxm and Its Cysteine Mutant Variant with Antifungal Activity. Antioxidants. 8: 598
- Purcell S, Neale B, Todd-Brown K, Thomas L, Ferreira MA, Bender D, et al. 2007. PLINK: a tool set for whole-genome association and population-based linkage analyses. Am. J. Hum. Genet.. 81: 559-575.
- Shakiba E, Edwards JD, Jodari F, Duke SE, Baldo AM, Korniliev P, et al. 2017. Genetic architecture of cold tolerance in rice (Oryza sativa) determined through high resolution genome-wide analysis. PLoS One. 12: e0172133
- Shi ML, Zhao L, Wang Y. 2021. Identification and Characterization of Genes Encoding the Hydroxy-pyruvate Reductases in Chlamydomonas Reveal Their Distinct Roles in Photorespiration. Front. Plant Sci. 12:
- Shin SY, Jeong JS, Lim JY, Kim T, Park JH, Kim JK, et al. 2018. Transcriptomic analyses of rice (Oryza sativa) genes and non-coding RNAs under nitrogen starvation using multiple omics technologies. BMC Genomics. 19: 1-20.
- Wan JL, Zhai HQ, Wan JM, Ikehashi H. 2003. Detection and analysis of QTLs for ferrous iron toxicity tolerance in rice, Oryza sativa L. Euphytica. 131: 201-206.
- Wingler A, Quick WP, Bungard RA, Bailey KJ, Lea PJ, Leegood RC. 1999. The role of photorespiration during drought stress: an analysis utilizing barley mutants with reduced activities of photorespiratory enzymes. Plant Cell Environ.. 22: 361-373.
- Xie GS, Kato H, Sasaki K, Imai R. 2009. A cold-induced thioredoxin h of rice, OsTrx23, negatively regulates kinase activities of OsMPK3 and OsMPK6 in vitro. FEBS Lett.. 583: 2734-2738.
- Xiong Z, et al. 1984. The study on early testing technology for rice cold tolerance. J. Zhangjing Agric. Sci.. 6: 276-280.
- Yang WN, Guo ZL, Huang CL, Duan LF, Chen GX, Jiang N, et al. 2014. Combining high-throughput phenotyping and genome-wide association studies to reveal natural genetic variation in rice. Nat. Commun.. 5: 1-9.
- Zhang J, Zheng HG, Aarti A, Pantuwan G, Nguyen TT, Tripathy JN, et al. 2001. Locating genomic regions associated with components of drought resistance in rice: comparative mapping within and across species. Theor. Appl. Genet.. 103: 19-29.
- Zhang K, Wang F, Liu BY, Xu CZ, He QX, Cheng W, et al. 2021. ZmSKS13, a cupredoxin domain-containing protein, is required for maize kernel development via modulation of redox homeostasis. New Phytol.. 229: 2163-2178.