Abstract
Acer rubrum (red maple) is one of the most important ornamental trees in North America. It is used in urban forestry and landscaping, as well as timber and syrup production. Drought is a major challenge that hinders the development and growth of maples and other tree species. The objective of the present study was to evaluate three red maple cultivars namely, October glory, Autumn red, and Red sunset for their physiological and molecular response to drought stress. Saplings of three cultivars of red maple were subjected to drought stress (up to 28 days unirrigated) in the summer of 2018 and 2019, and leaf samples were used to quantify physiological, biochemical, and expression changes under stress. Decrement of chlorophyll content significantly correlated with the soil moisture content observed in all three genotypes subjected to drought stress. Significant variation in proline concentration, Malondialdehyde levels, and increase in superoxide dismutase (SOD) activity at various stages of the experiments showed the ability of the maple plants to respond to drought stress. RT-qPCR analyses revealed higher and variable expression of drought-responsive genes GGAT1 encoding glutamate-glyoxylate aminotransferase, and CSD2 encoding SOD, in the red maple plants under drought stress. The results from this study indicate that the red maple plants alleviate drought stress by the possible mechanism involving decreased lipid peroxidation, and enhanced production of osmolyte and antioxidants.
-
Key words: Acer rubrum, Red maple, Drought, Superoxide dismutase, Proline, qRT-PCR
INTRODUCTION
Red maple (
Acer rubrum L.) has been used and valued as an ornamental tree in many parts of the northern hemisphere. The red maple is classified under the genus
Acer belonging to the family Sapindaceae. There are 128 species of maples classified under the
Acer genus including
A. rubrum (red maple) and
A. saccharum (sugar maple). The red maples are very prolific in seed production making them very adaptable and widespread (Walters and Yawney 1991; Thomson
et al. 2013;
Kalubi et al. 2015). It is one of the most abundant trees in the deciduous forests in the eastern United States and stretches up to the southern parts of the country (
Graignic et al. 2018). There is enormous potential for commercial production of maples, including the red maple for maple syrup, sugar, lumber, and other maple products (
Farrell and Chabot 2012). The industry is valued at 150 million dollars in the United State in 2016 as reported by USDA and 500 million dollars in Canada which is the world’s leading producer of maple syrup and other maple products.
Drought stress is considered one of the most critical threats to plants (
Farooq et al. 2009;
Lima et al. 2015;
Nabi et al. 2019). The effects of drought on plants are diverse and detrimental to their cultivation. These effects can be seen from the morphological level to the molecular level of plant development when they are exposed to drought stress. It can affect plants at any stage throughout their life cycle, from germination, the seedling stage to the mature plants (
Farooq et al. 2012). The effect of drought on plant growth has been reported to begin with a reduction in germination and the resultant poor seedling performance (
Kaya et al. 2006). Drought stress causes a reduction in photosynthesis and causes a decrease in leaf expansion, premature leaf senescence, stomatal closure, changes in photosynthetic pigments, loss of balance between the production of reactive oxygen species and antioxidant defense, and decrease in RuBisCO (Ribulose-1,5-bisphosphate car-boxylase/oxygenase) activity (
Ludlow and Muchow 1990;
Farooq et al. 2009).
Some of the direct impacts of drought on maple syrup production includes defoliation of the trees, especially younger trees, a decrease in stored root starches leading to decreased sugar content in the sap and lastly poor sap and syrup ratio (
Pukacka and Pukacki 1997). Houston
et al. (1990) further recommended against installing many taps on trees under stress and defoliated trees since the tap wounds further impose stress on the plants. All these factors have negative economic impact on syrup produc-tion.
One of the earliest negative responses of plants to drought and other abiotic stresses is the generation of reactive oxygen species (ROS). ROS is a normal byproduct of cellular metabolism and is maintained in equilibrium at low levels with antioxidant enzymes such as superoxide dismutase (SOD), catalase (CAT), and peroxidase (POD) (
Sharma et al. 2012;
Jajic et al. 2015). However, when plants are subjected to drought stress, there is an overproduction of ROS, such as superoxide anion (O
2‒), hydroxyl radicals, (
∙OH), and singlet oxygen (O
2) (
Carvalho 2008). The disequilibrium between the ROS and the antioxidant enzymes results in oxidative stress in the plant and consequently damage to cellular macromole-cules and membranes and an increase in lipid peroxidation and ultimately leads to cell death (
Sharma et al. 2012;
Gupta et al. 2016).
Plants have different natural mechanisms with which they respond to drought stress to minimize its negative effects. These mechanisms range from morphological changes to molecular defenses. During drought stress, plants accumulate osmoregulatory substances such as proline, late embryogenesis abundant proteins (LEA), dehydrins, and betaine aldehyde dehydrogenase, to control the osmotic potential and protect the cell membrane from damage (
Wang et al. 2016). Also, plants respond to abiotic stress through the reactive oxygen species scavenging pathways, in which, antioxidants such as SOD, CAT, and POD increase their activities to maintain a dynamic equili-brium between these enzymes and the ROS. Furthermore, the signaling pathways involving ethylene, abscisic acid, auxin, modulation of the cell wall structure, and other drought-responsive gene expression regulations are vital ways in which plants alleviate the detrimental effects of drought stress (
Wang et al. 2016).
The objective of the present study was to understand the drought stress-induced responses in red maple cultivars. In this study, we subjected three red maple cultivars to drought stress in greenhouse conditions and measured levels of chlorophyll index, Malondialdehyde (MDA), SOD, and proline. Besides, we selected known drought- responsive genes across plant species to check their gene expression in selected red maple cultivars under drought stress. The findings from this study provide insight into the mechanisms used by the red maple cultivars to alleviate drought stress effects.
MATERIALS AND METHODS
Plant materials
Two-year-old dormant bare root saplings of
A. rubrum (red maple) cultivars were procured from a wholesale nursery in Tennessee, USA. These cultivars included October glory (OG), Autumn red (AR), and Red sunset (RS). The OG is fast-growing, and the last cultivar to color in the fall. It is better adapted to areas with mild winter and hot summer temperatures and has been used in several research studies (
Zwack et al. 1999;
Bauerle et al. 2003,
2006;
Li et al. 2015). The AR has a red hue during the fall, a characteristic that is distinguishable from other red maple cultivars. Furthermore, it is also adaptable to most environ-ments. The RS is the most highly rated and reliable cultivar of the red maple (
Zwack et al. 1999;
Bauerle et al. 2003,
2006). It has become a standard cultivar against which other maple cultivars are compared, and is also resistant to hot summers (JFS reference guide, 2018, accessed from
www.jfschmidt.com).
The saplings were 1 to 2 feet tall and were planted in 8 inches diameter pots with promix potting soil. The saplings were maintained outside the greenhouse at Delaware State University, under natural growth conditions until new leaves emerged. The saplings were moved into the greenhouse on July 30, 2018, for acclimatization and drought stress afterward. The temperatures in the green-house ranged from 18℃ to 35℃ with 60 to 80% relative humidity.
Experimental design
The drought stress experiments were performed in the summer of 2018, and 2019. For the year 2018, four plants of each cultivar were randomly selected and subjected to drought stress (on August 7
th, 2018) for 0 (control), 7, 14, 21, and 28 days of non-irrigation. The data for plant chlorophyll index, the volumetric water content of the pots, and leaf tissue samples for physiological and molecular analysis were taken for each drought regime. In the year 2019, the drought regimes were 0 (control), 4, 8, 12, and 16 days of drought stress. As plants were maintained in the same pots until the year 2019, the increased biomass caused faster water depletions. Thus, the sampling dates were adjusted to make sure that the plants were undergoing a similar level of drought stress as in the year 2018 (
Fig. 1). Three leaf samples were randomly collected from the 4 plants for each cultivar and were frozen immediately using liquid nitrogen and stored at ‒80℃ until ready for analyses.
The volumetric water content of the substrate was also measured using the TDR 100 field scout moisture meter (Spectrum Technologies, Aurora, IL, USA) to determine the water content in each of the drought regimes before the samples were collected. To determine the correct measure of the water content, data was taken from 3 different points within the pots and then averaged and expressed as volum-etric water content (VWC) in percentage.
Measurement of chlorophyll index
The chlorophyll index was measured using SPAD 502 plus chlorophyll meter (Konica Minolta, INC, Japan). The SPAD device measures the chlorophyll index in SPAD units, which is directly proportional to the chlorophyll concentration in the leaves. The meter determines the relative amount of chlorophyll present in the leaves by measuring the absorbance in blue (400-500 nm) and red (600-700 nm) wavelength regions. These absorbance values are then used to calculate a numerical SPAD value, which is proportional to the chlorophyll content in the leaf. Three leaves on each plant for each replicate were randomly selected and used for chlorophyll measurements for all the next drought regimes. The average of the SAPD values obtained for the three marked leaves on each plant was represented as the measured chlorophyll value for that plant (
Impa et al. 2020).
Malondialdehyde is an end-product of the radical- initiated oxidative decomposition of polyunsaturated fatty acids and a frequently used marker of oxidative stress (Vemama et al. 2017). The MDA concentration of the leaf samples was measured using Lipid Peroxidation (MDA) assay kit (Abcam, Cambridge, UK) according to the manufacturer’s instructions. Briefly, fresh and frozen leaf tissues were finely ground using liquid nitrogen in mortar and pestle and collected in a tube. To this tube, thiobar-bituric acid (TBA) solution is added and incubated at 95℃ for 60 minutes and later cooled in an ice bath for 10 minutes. The sample is then transferred to a microtiter plate and OD is measured calorimetrically at 532 nm using a BioTek Epoch 2 microplate spectrophotometer (BioTek Instruments, USA). In this assay protocol, the MDA in the leaf sample reacts with TBA to generate MDA-TBA adduct, which is then calorimetrically quantified.
Superoxide dismutase assay
The scavenging activities of SOD are one of the first responses to the over-accumulation of ROS. In this study, we conducted a SOD assay using fresh and frozen leaf samples to evaluate the activity of SOD in the leaves of each sample. To carry out this assay, the Cayman chemical SOD assay kit item no. 706002 (Cayman Chemical Company, USA) was used and the protocol was followed as described by the manufacturer. Higher levels of SOD indicate the role of SOD in enhancing drought stress tolerance in plants.
Determination of proline concentration
To evaluate the osmoprotectant proline, and its role in drought tolerance in red maple, its concentration levels in all the samples were measured using a ninhydrin-based calorimetric assay originally described by
Bates et al. (1973), with slight modifications given in
Kijowska-Oberc et al. (2020). The optical densities for the standards were plotted against their respective concentrations to prepare a standard curve and the linear equation was used to calculate the proline in each sample. Based on the amount of toluene and weight of leaf tissue used for the assay, the proline concentration for each sample was calculated using the following formula and expressed in mg/g FW (fresh weight)
Where:
P = proline concentration in µg/ml calculated from the linear equation
T = amount of toluene used in the extraction in ml
g = weight of leaf tissue used in the extraction.
0.667 = the correction factor for the amount of extract used from the total extract for the microplate reading.
Primer selection and design
By June 2018, 285 nucleotide sequences were available in the GenBank database for maple and none for
A. rubrum. Most of these sequences corresponded to ribosomes. Therefore, for gene expression analysis, we searched the literature for drought-responsive genes and selected 25 genes, mostly from Arabidopsis and other woody species (
Supplementary Table 1). Sequence information of a particular gene was retrieved from the genome sequence of the same organism from which the candidate gene was selected, and qPCR primers were designed using the IDT primer quest tool. The primers were tested for their amplification using maple genomic DNA and cDNA before using them in qPCR. The details of the selected genes and the designed primers are given in
Table 1, and
Supplementary Table 1. Actin (Forward primer: CGGCT CACACAATCCTCTATT; Reverse primer: GAGGAAG AGATGGTGAGTGATTG) was used as the endogenous reference gene.
Total RNA extraction was done with Spectrum™ Plant total RNA kit (Sigma, USA). Briefly, 100 mg of frozen maple leaf tissues were ground in liquid nitrogen and used for the RNA extraction as per the manufacturer’s protocol. In the step of binding RNA to the column, protocol A was used since maple leaves contain more polysaccharides. After RNA extraction was completed, the concentration and purity of the RNA were measured using NanoDrop 2000 (Thermo Scientific, USA) and 1% agarose gel elect-rophoresis.
ImProm-IITM Reverse Transcription system (Promega, USA) was used for the cDNA synthesis, carried out accord-ing to the protocol as described by the manufacturer. The denaturation of the Oligo dT primer and the RNA mix was done at 70℃ for 5 minutes using an incubator and then chilled on ice for 5 minutes. The reverse transcription reaction was prepared as described in the protocol including both negative and positive controls. Briefly, 1 µg of RNA and Oligo dT primer was added to 15 mL of the reverse transcription mix to make a 20 mL reaction. The reaction was annealed at 25℃ for 5 minutes, extended at 42℃ for 60 minutes, and finally inactivated the reverse transcriptase at 70℃ for 15 minutes. The concentration of the cDNA was measured using NanoDrop 2000 (Thermo Scientific, USA) and tested through regular PCR with actin primers.
Quantitative real-time PCR analysis
The quantitative real-time PCR (RT ‒qPCR) was performed using GoTaq® 2-Step RT‒qPCR system kit (Promega, USA). The reaction was carried out using the Applied Biosystem 7500 Real time-PCR system (Applied Biosystems, USA). A 25 mL reaction was set up based on the protocol and a standard cycling condition was used for the thermocycling. A comparative DDCt method was used and Ct values were obtained for each sample. Actin as the endogenous control and the drought regime day 0 for each cultivar was used as the calibrator. Using the Ct values for each sample, DDCt for each gene and sample was calculated and then used to calculate the RQ value which is the fold change compared to the calibrator.
Statistical analysis
IBM SPSS Statistics 26 (IBM SPSS Statistics for Windows, Version 26.0. Released 2019, Armonk, NY) was used for one-way analysis of variance (ANOVA) at a 95% confidence interval of the data, and Pearson correlation analysis. The post hoc comparisons were performed in SPSS 26 using Duncan’s and Tukey tests. Graphs were plotted using IBM SPSS Statistics 26 and Excel. ANOVA analysis was performed separately for each drought regime and compared with the respective drought regime across years.
RESULTS
Substrate moisture content
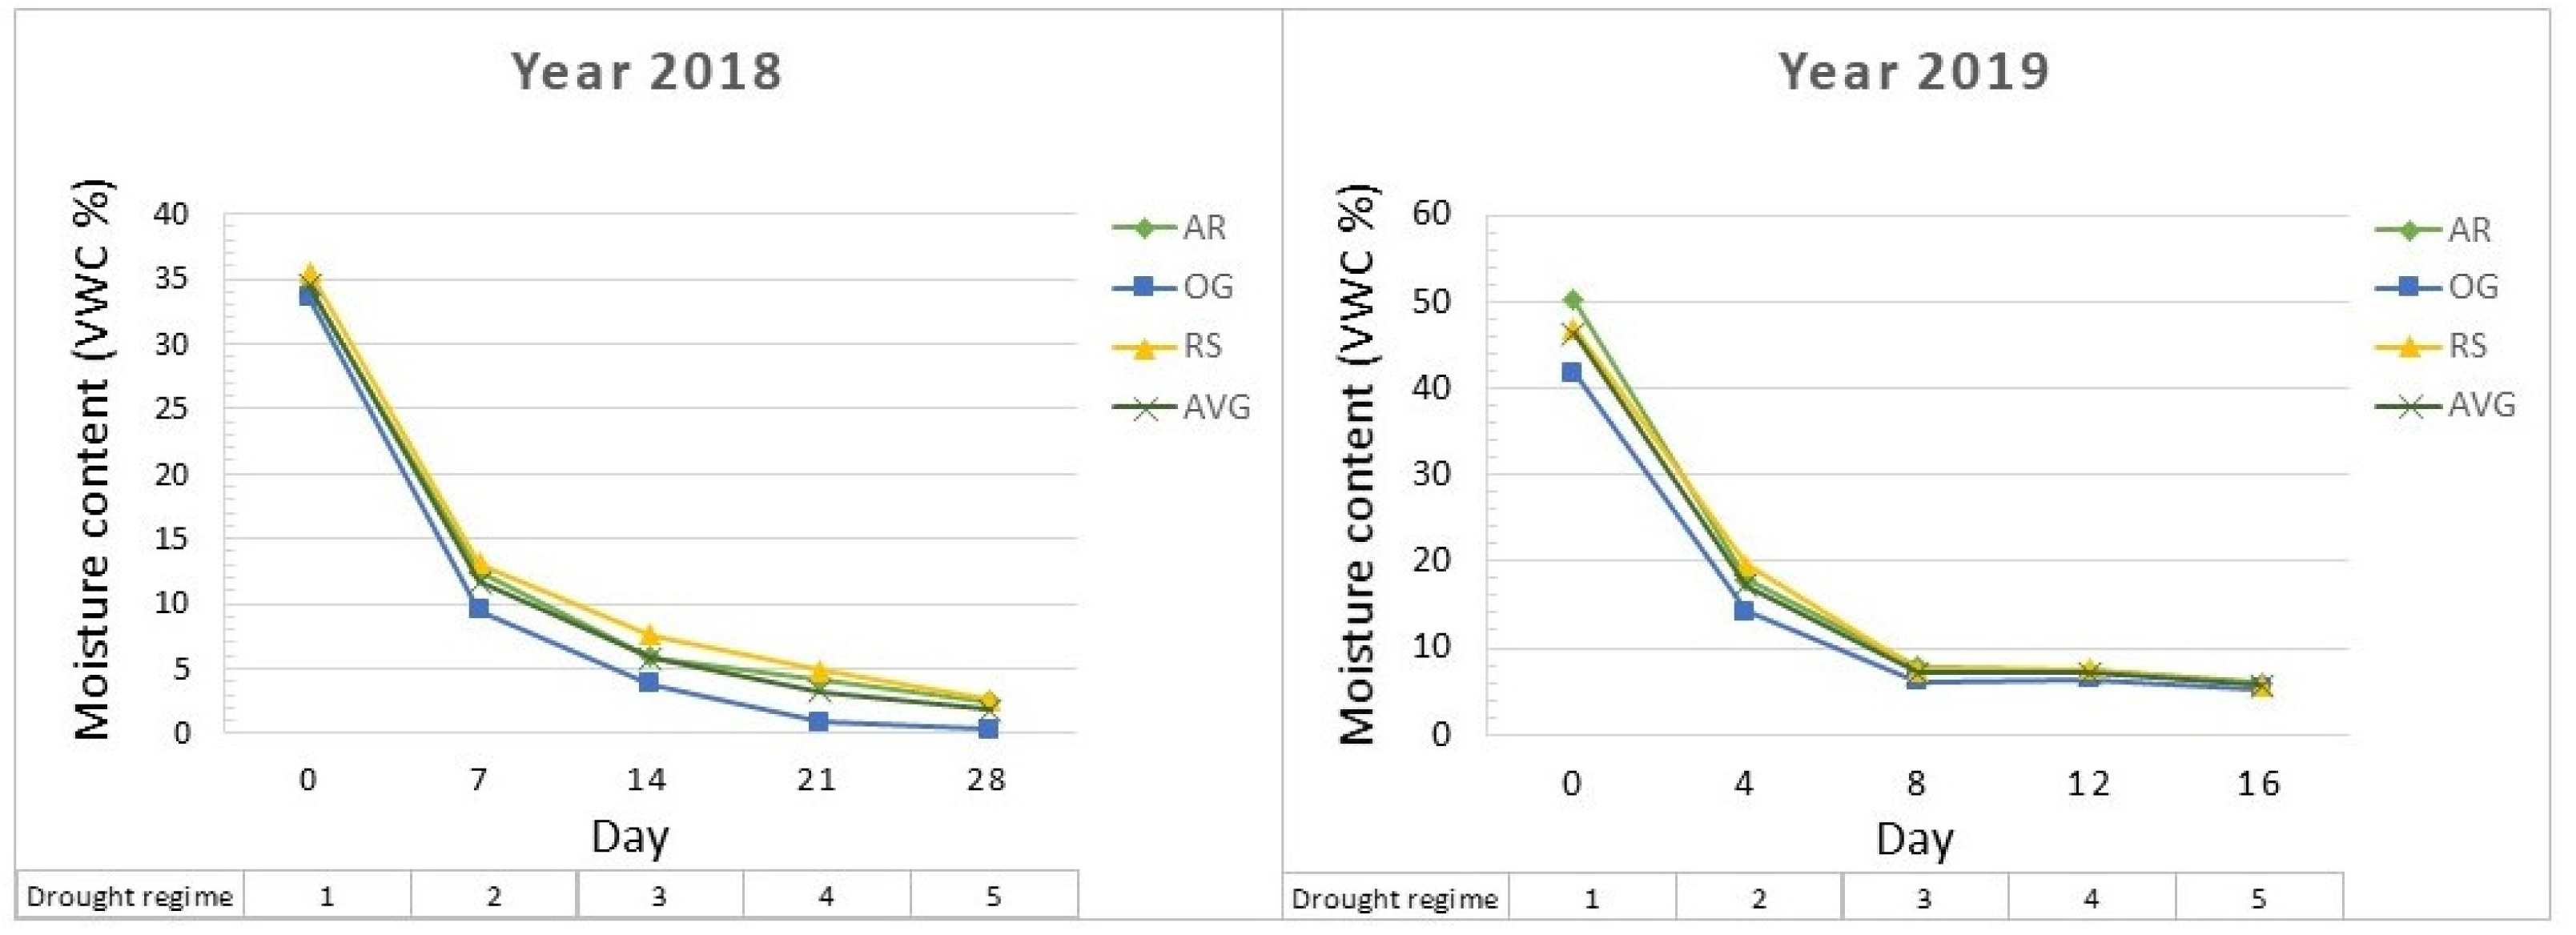
Volumetric water content for each cultivar was measured and expressed as %VWC. In both the years - 2018 and 2019, %VWC of all replicates ranged between 33 to 50% at 0 hour drought stress (
Fig. 1). Once drought stress was imposed on the plants, the %VWC dropped down to 10-12% at the first drought regime in both the years (i.e. day 7 in the year 2018, and day 4 in the year 2019). At the last drought regime in both the years, the %VWC in the pots of all three cultivars further dropped down to a 3 to 5% range (
Fig. 1). The %VWC between the time regimes showed no significant difference across years (
Table 2), suggesting that plants encountered similar levels of drought stress at each point of the drought regimes (
Fig. 1).
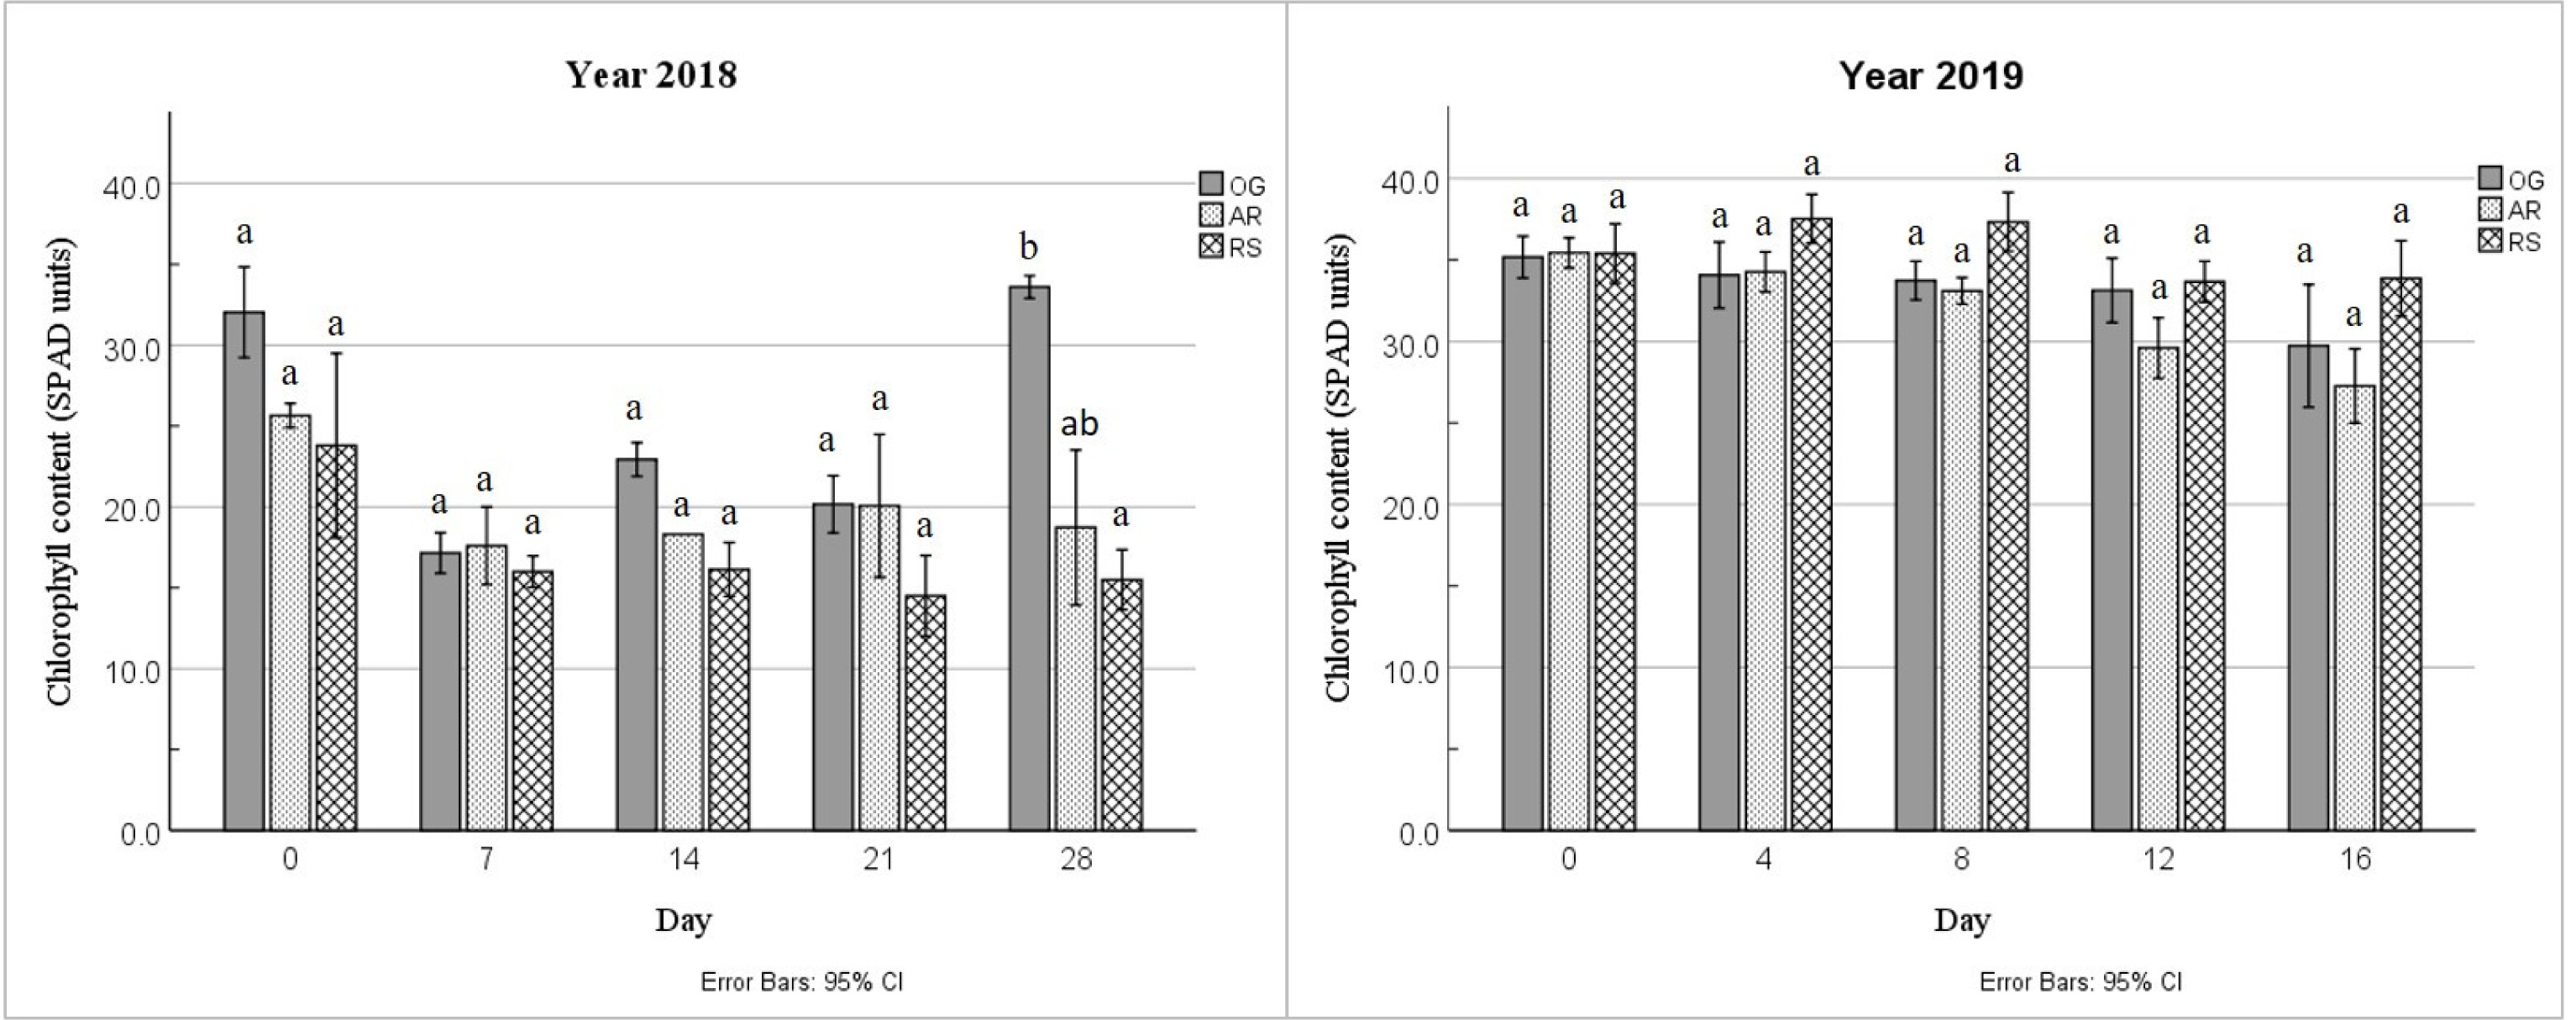
We observed significant variation in chlorophyll content (one-way ANOVA,
P < 0.05) in maple leaf samples exposed to drought stress between the years (
Table 3), except in day 28. In the year 2018, chlorophyll content was found to decrease on day 7 of the drought, and remained largely at similar levels up to day 28 in all the three genotypes, except for OG in which significant increases were observed at day 28 of the drought stress (
Fig. 2). Except for day 28 in the year 2018 (one-way ANOVA,
P < 0.05), no significant differences for chlorophyll content were observed among the varieties at each drought regime. Comparison of mean differences identified using the Duncan test indicated a statistically significant difference for the chlorophyll content in OG, AR, and RS for day 28 in the year 2018 (
Fig. 2). In the year 2019, chlorophyll content was decreased gradually across the drought stress time regimes (
Fig. 2), although the difference was not signifi-cant, suggesting that the genotypes responded similarly despite a decrease in the moisture content (
Fig. 1,
2).
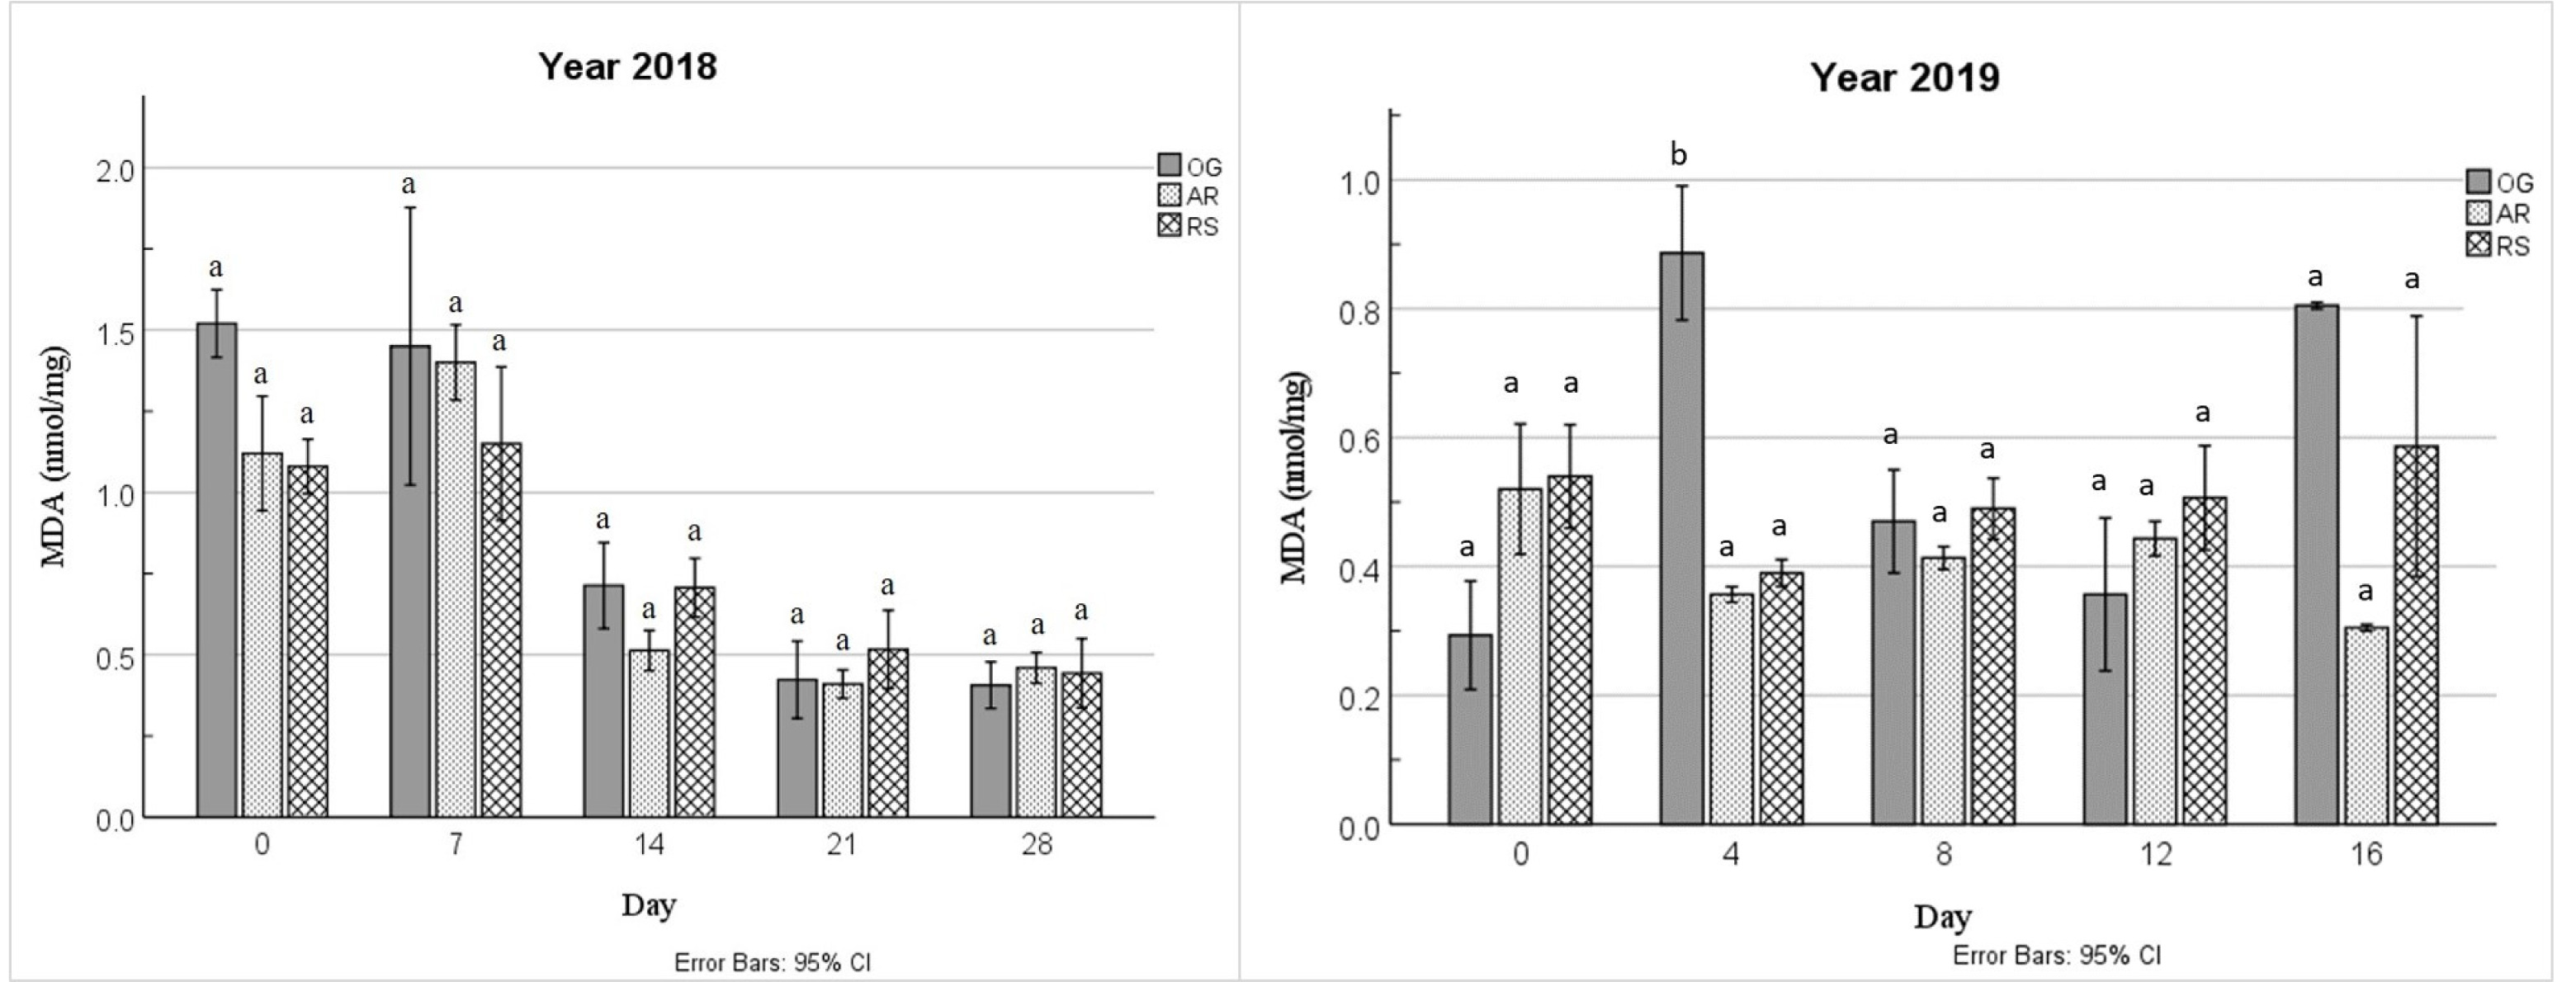
In the year 2018, MDA levels in all the three cultivars were between 1.0 and 1.5 nmol/mg on drought regimes 1, and 2 (day 0, and 7) and then dropped consistently to around 0.5 nmol/mg by the drought regime 5 (day 28) (
Fig. 3). Comparison of the mean indicated no significant differences for MDA concentrations among the varieties at each of the drought regimes. Pearson’s correlation analysis between the moisture content and MDA content in the year 2018 showed a significant positive correlation (
r = 0.613 at
P < 0.01 level) (
Table 4), indicating that the MDA levels significantly decreased as the drought stress increased on the maple plants in the year 2018. In the year 2019, MDA concentrations in AR and RS remained around 0.5 nmol/mg throughout the five drought regimes; however, significantly higher MDA levels were observed in OG on day 4 (
Fig. 3). The MDA concentrations in the year 2019 were significantly lower up to day 4 of the drought stress period, after which no significant difference was seen (
Fig. 3). Despite these variations, a decreasing trend in mem-brane lipid peroxidation is evident in all three red maple cultivars.
In the year 2018, proline levels in OG, and RS increased significantly from day 7 and peaked at day 21 after which decreased. In AR, proline levels increased from day 7 to day 14 and then decreased to 19 mg/g at day 21 (
Fig. 4C). Compared to OG and AS, the proline concentration in AR was significantly lower on days 0 and 21 in the year 2018 (
Fig. 4C). However, in the year 2019, a significant increment in proline concentration from day 4 to day 16 was observed in all three cultivars (
Fig. 4D). Pearson’s correlation analysis between the moisture content and proline concentration in the year 2019 showed a significant negative correlation (
r = 0.464 at
P < 0.01 level) (
Table 4), suggesting that increase in the proline concentration with an increase in drought stress help to alleviate drought stress effects in maple plants.
In the year 2018, SOD levels in all three genotypes ranged from 0.16 U/mL to 0.49 U/mL (
Fig. 4A) and ANOVA showed no significant difference in the SOD levels between the genotypes. In the year 2019, the SOD levels were in the range of 0.67 U/mL to 2.65 U/mL (
Fig. 4B), which were significantly higher compared to the SOD levels in the year 2018 in most of the treatments (
Table 3).
Further, the SOD levels in the control and drought-imposed plants remained largely similar throughout the 28 days for all the three cultivars, except for OG at day 4, which were significantly higher (
P <0.05) from AR, and RS. The SOD levels across years for respective drought regimes suggested significant differences (
Table 3), the plants responded differently across years for SOD levels.
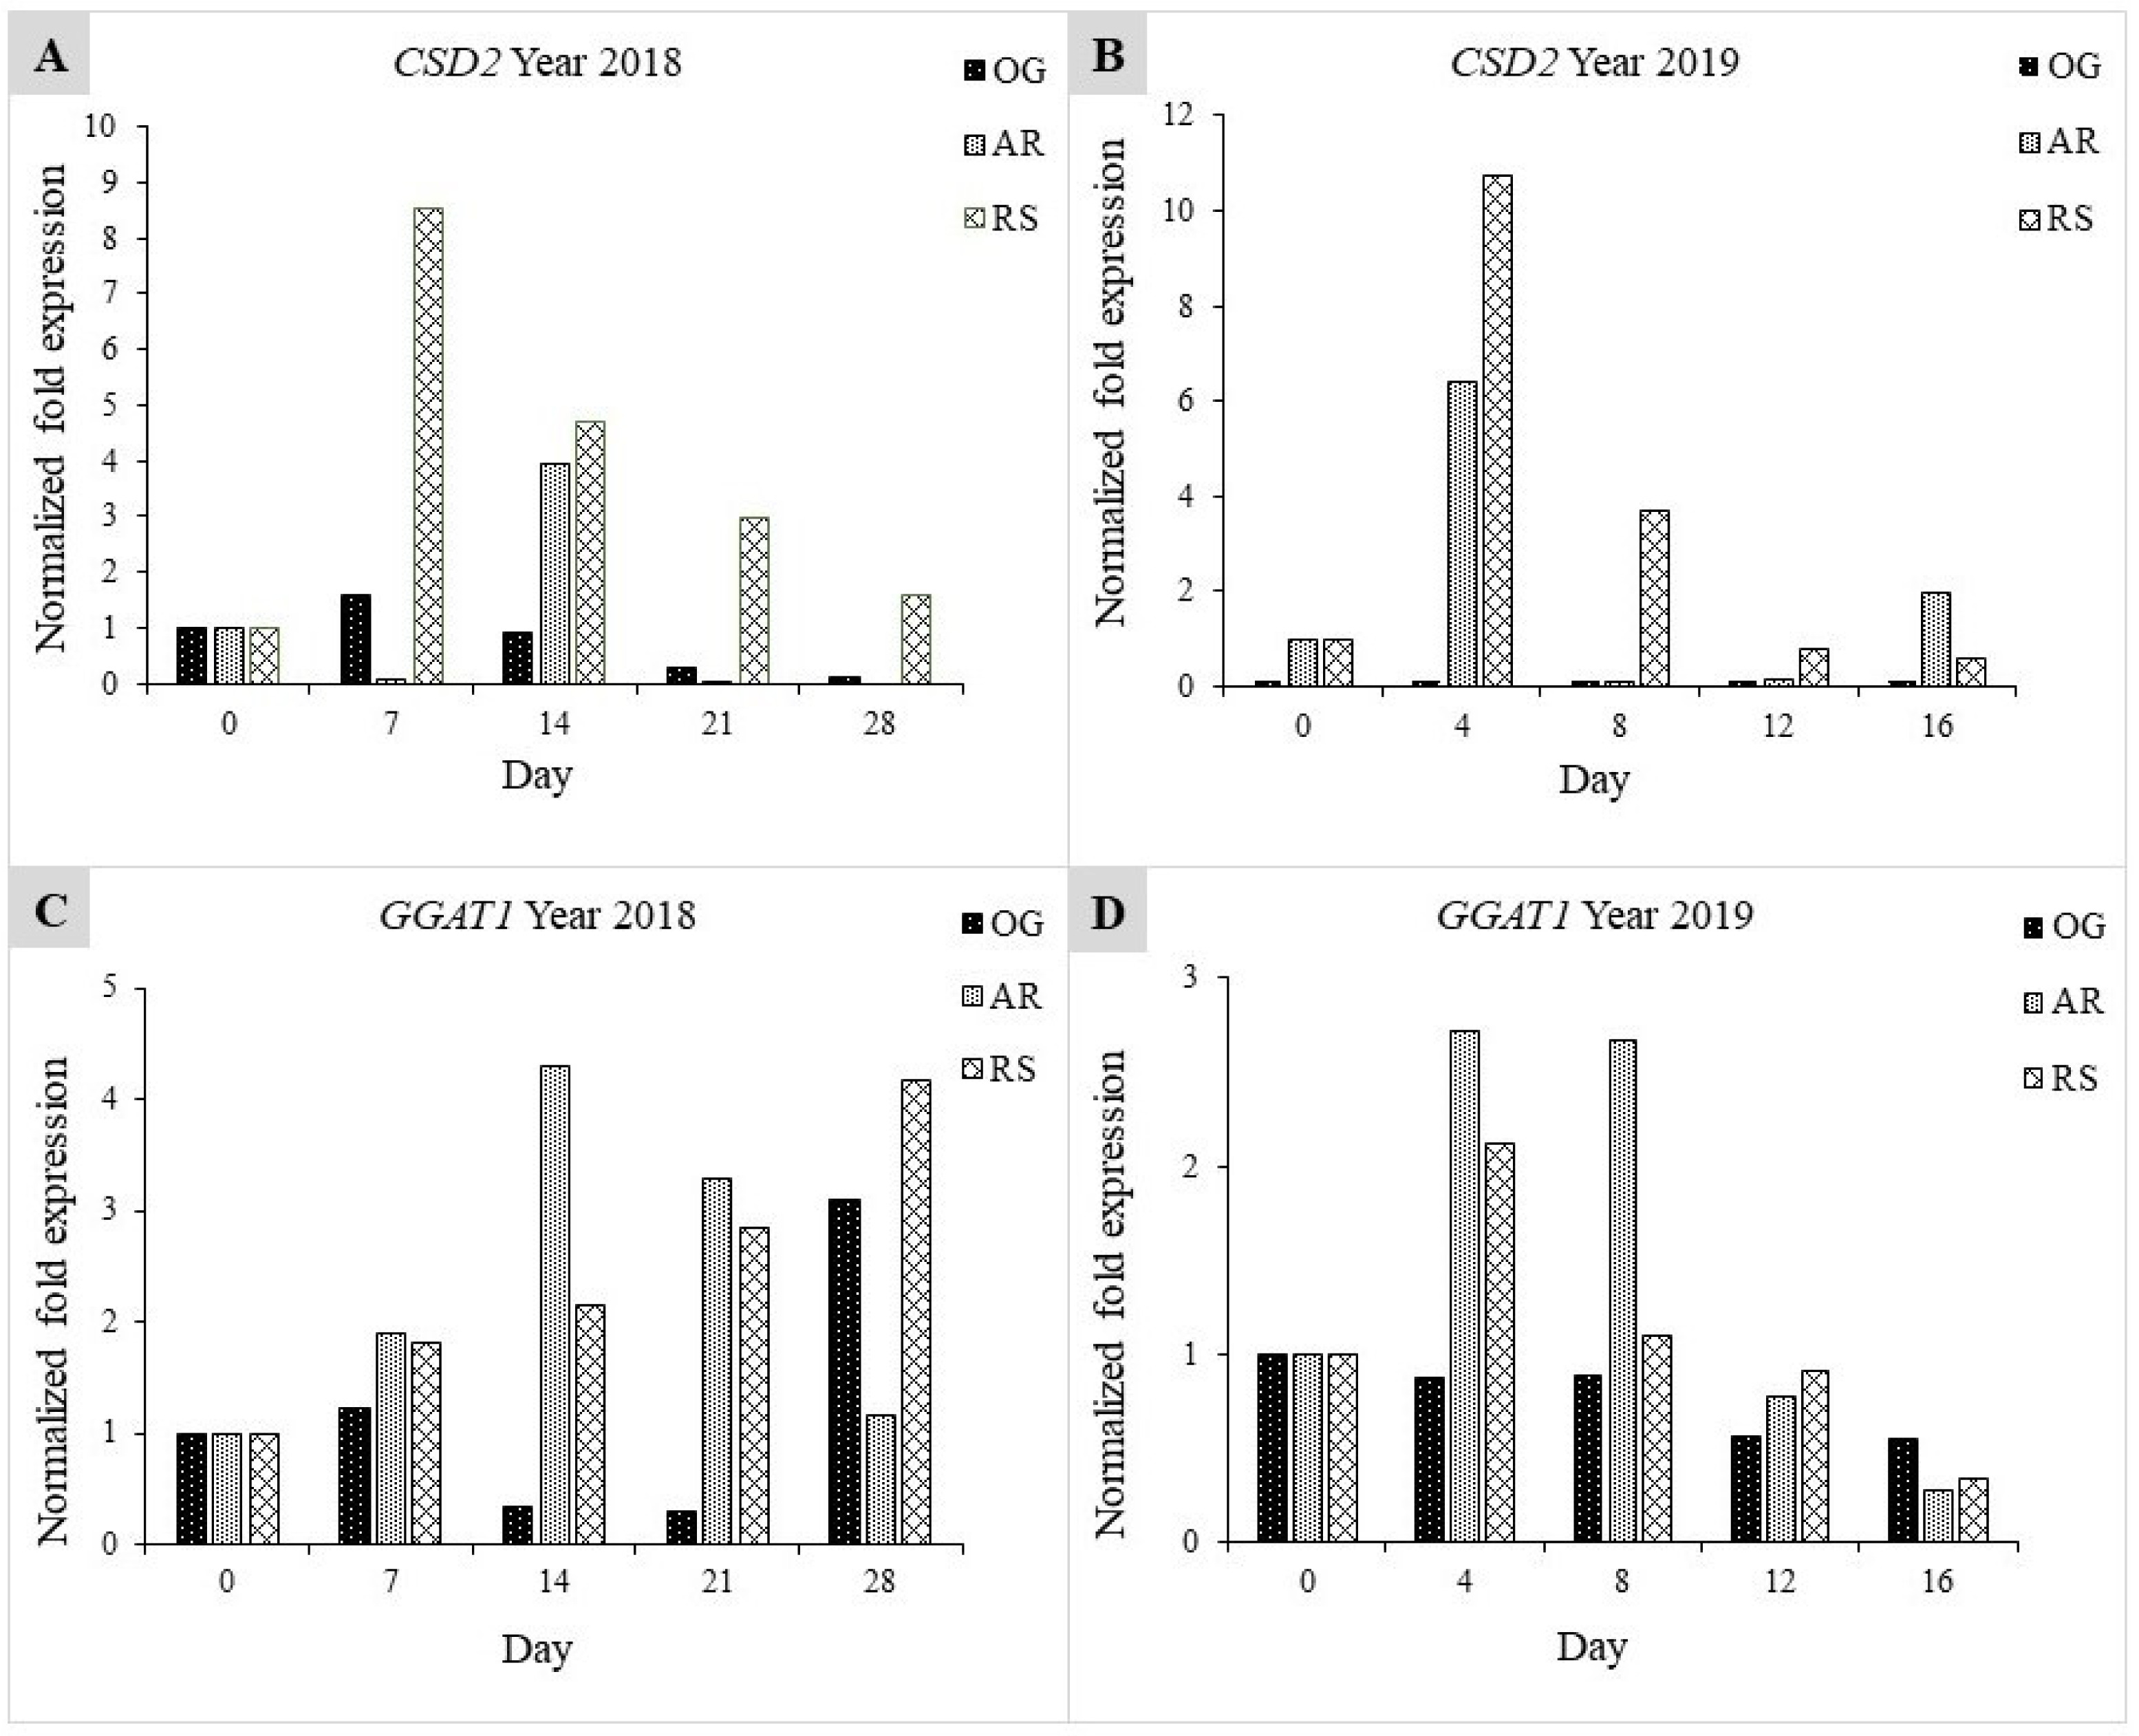
Amongst the genes tested, two genes (
CSD2 and
GGAT1) showed a clear and single-band amplification pattern in maple Cdna and hence were selected for gene expression analysis. The
CSD2 showed RQ values of < 2 in OG, and AR samples of all the drought regimes in the year 2018, except in AR of day 14 (drought regime 3). However, its expression in RS was very high on day 7 (drought regime 2) and gradually decreased in the subsequent drought regimes (
Fig. 5A). In the year 2019 also, RS followed a similar gene expression pattern in the control and drought-induced maple samples (
Fig. 5B). Except for its higher expression in drought regime 2 (day 4),
CSD2 showed low expression in OG, and AR genotypes, much like that in the year 2018. Thus, while the
CSD2 expression in OG and AR was mostly low, its expression in RS had a similar pattern of decrease in the expression with an increase in drought stress levels. The
GGAT1 expression in RS showed a steady increment with an increase in drought stress levels in the year 2018, (
Fig. 5C). A similar expression pattern was observed in
GGAT1 expression in AR, but the levels increased only up to the drought regime 3 and decreased thereafter. In OG, the
GGAT1 expression levels were very low, except in the last regime where RQ values of 3 were observed (
Fig. 5C). The
GGAT1 expression in AR and OG in the year 2019 showed patterns similar to its expression in the year 2018. The
GGAT1 expression pattern in RS, however, showed decrement from drought regime-2 to drought regime 5 (
Fig. 5D). Overall, an increasing trend in GGAT1 expression was evident, despite variation in expression levels in the individual genotypes.
DISCUSSION
Drought is one of the abiotic stresses that has an immense impact on plant growth, development, and productivity. In this study, we carried out a physiological and molecular analysis of the three red maple cultivars subjected to drought stress. These cultivars of maples are known to adapt to mild winter and hot summer conditions. The moisture content in the stressed pots at the end of the treatment was as low as 3% VWC. Generally, at the permanent wilting point which is usually at -15 bars (
Clay and Trooien 2017), plants can no longer absorb water from the soil due to low water potential (
Hanson and Blevins 1979;
Wiecheteck et al. 2020). Most of the plants undergo substantial water stress at these levels, which are close to the permanent wilting point for most of the soil types (
Kirkham 2014;
Rai et al. 2017). Plants exposed to drought conditions at these levels of drought stress need to exhibit various and improved levels of tolerance mechanisms to survive in such conditions (
Basu et al. 2016;
Wiecheteck et al. 2020).
Plants, when subjected to drought stress conditions, show degradation of chlorophyll pigments affecting photosynthesis, and changes in the content of both chlorophyll a and b under drought stress have been observed (
Farooq et al. 2009). Variation in photosynthesis along with chlorophyll fluorescence and light absorption parameters has been associated and used to characterize maple plant responses to drought stress (
Bauerle et al. 2003). Earlier research reports investigating the effect of drought on chlorophyll content in red maples (
Bauerle et al. 2003;
Li et al. 2015) and other crops (
Percival and Sheriffs 2002;
Rahbarian et al. 2011) reported a significant impact of drought on the reduction in the chlorophyll activity. In our study, a decreasing trend in chlorophyll index was found but the variation was not significant.
One of the major effects of drought on plants is the production of ROS, which causes lipid peroxidation and degradation of cell membranes (
Nisarga et al. 2017). Proline is one of the defense mechanisms which is often deployed during stress conditions to scavenge ROS and to adjust the osmotic pressure of the cell to keep them active and help tolerate drought stress in plants (
Yaish 2015). A significant increase in proline accumulation with increased levels of drought stress has been reported in red maple (
Li et al. 2015), and date palm (
Yaish 2015). In the present study, proline accumulation increased with an increase in drought stress, and negatively correlated with the soil moisture content in the year 2019. Proline is an enhancer of drought tolerance in plants and modulates the stress response through scavenging ROS and adjusting osmotic pressure. These results show the significance of proline synthesis and accumulation in alleviating stress in maple plants subjected to drought stress.
Superoxide dismutase is another important enzyme involved in ROS scavenging for alleviating stress response in plants. The main function of SOD is to catalyze the dismutation of ROS into molecules less harmful to plant cells and organs (Giannopitis and Ries 1997;
Gupta et al. 2016). During drought stress conditions, superoxide radicals are formed from various physiological processes in plants and one of the notable processes is photosynthesis. To eradicate this harmful effect of superoxide radicals, plants accumulate higher concentrations of SOD, which scavenges ROS and enhances drought tolerance in the plants (You and Chan 2002). With low SOD levels, and increased levels of ROS, a disequilibrium between SOD and ROS can occur and this can result in severe lipid peroxidation and eventually lead to plant death. SOD assays conducted across various plant species show that cultivars or genotypes with better drought tolerance tend to have high SOD activities when subjected to drought stress (Sarkar and Oba 2018). In this study, increased (although non-significant) SOD accumulations in response to drought stress were observed at different stages of the experiment as observed by
Li et al. (2015). Besides SOD, MDA levels were found to decrease in all three genotypes. The decreased lipid peroxidation with an increase in drought tolerance suggests that the maple cultivars used in this study may have the ability to scavenge ROS through the activities of SOD and other antioxidant enzymes.
Drought tolerance in plants is a complex natural mechanism involving molecular signaling, physiological triggers, and morphological changes (
Seki et al. 2003;
Yamaguchi-Shinozaki and Shinozaki 2006). Drought response relies on the expression and regulation of several genes and gene networks (Shinozaki and Yamaguchi- Shinozaki 2007), and several such genes have been documented across the plant species. The
GGAT1 gene encodes for Glutamate--glyoxylate aminotransferase, which catalyzes the reaction of glycolate produced from photorespiration to serine and glycine (
Igarashi et al. 2006). Photorespiration, which occurs under stress conditions such as high light, drought, and salt stress (
Wingler et al. 2000), is also an important mechanism for mitigating photoinhibition. Thus, the
GGAT1 gene is involved in stress-mediated responses. The increased expression of
GGAT1 in our maple samples in response to drought stress points towards the possible role of
GGAT1 in enhancing the drought tolerance of maple plants. The
CSD2 encodes for SOD responsible for scavenging ROS and was moderately expressed in both years. It is known that SOD is very essential for ROS scavenging to enhance drought tolerance in plants. Differential expression observed for these genes in our study indicates that these genes might be involved in alleviating drought stress effects in the maple plants.
CONCLUSION
This is the first report of the physiological assessment of maple plants in drought stress coupled with the gene expression analysis. In the present study, all three genotypes of red maples (OG, AR, and RS) displayed significant variation for the parameters evaluated in drought stress. It was also evident that the considered drought regimes had a significant impact on plant development and response, and despite the differences in the time regimes in both years, we were able to achieve similar drought levels in the experiments. Physiological assessment of parameters such as chlorophyll and proline concentration and SOD levels suggested that the maple plants used in the study possessed improved tolerance to drought stress. The results from this study show that three genotypes of red maple have a significant level of drought tolerance. The possible mechanism that maple plants utilize to alleviate the effects of drought stress could be decreased lipid peroxidation (MDA) and enhanced production of osmolyte (proline) and antioxidants (SOD). These physiological and biochemical responses were supported and evidenced by the higher expression of antioxidant (CSD2) and osmolyte (GGAT1) producing genes.
Supplemental Materials
ACKNOWLEDGEMENTS
This work was supported by the USDA National Institute of Food and Agriculture (McIntire Stennis project NI19MSCFRXXXG045). The authors thank Dr. Amaranatha R. Vennapusa, Delaware State University, for his inputs in improving the content of the manuscript.
Fig. 1Volumetric water content of pots of maple cultivars subjected to drought stress (drought time regimes) in greenhouse conditions.

Fig. 2Variation in the chlorophyll index (SPAD units) of the maple leaf samples in response to drought stress in greenhouse conditions evaluated across two years.

Fig. 3Mean concentrations (± SE) of malondialdehyde (MDA) concentrations (nmol/mg) observed in leaves of the three maple cultivars exposed to drought stress.

Fig. 4Mean concentrations (± SE) of SOD (A, B) and proline (C, D) levels accumulated in three maple cultivars in response to drought stress.
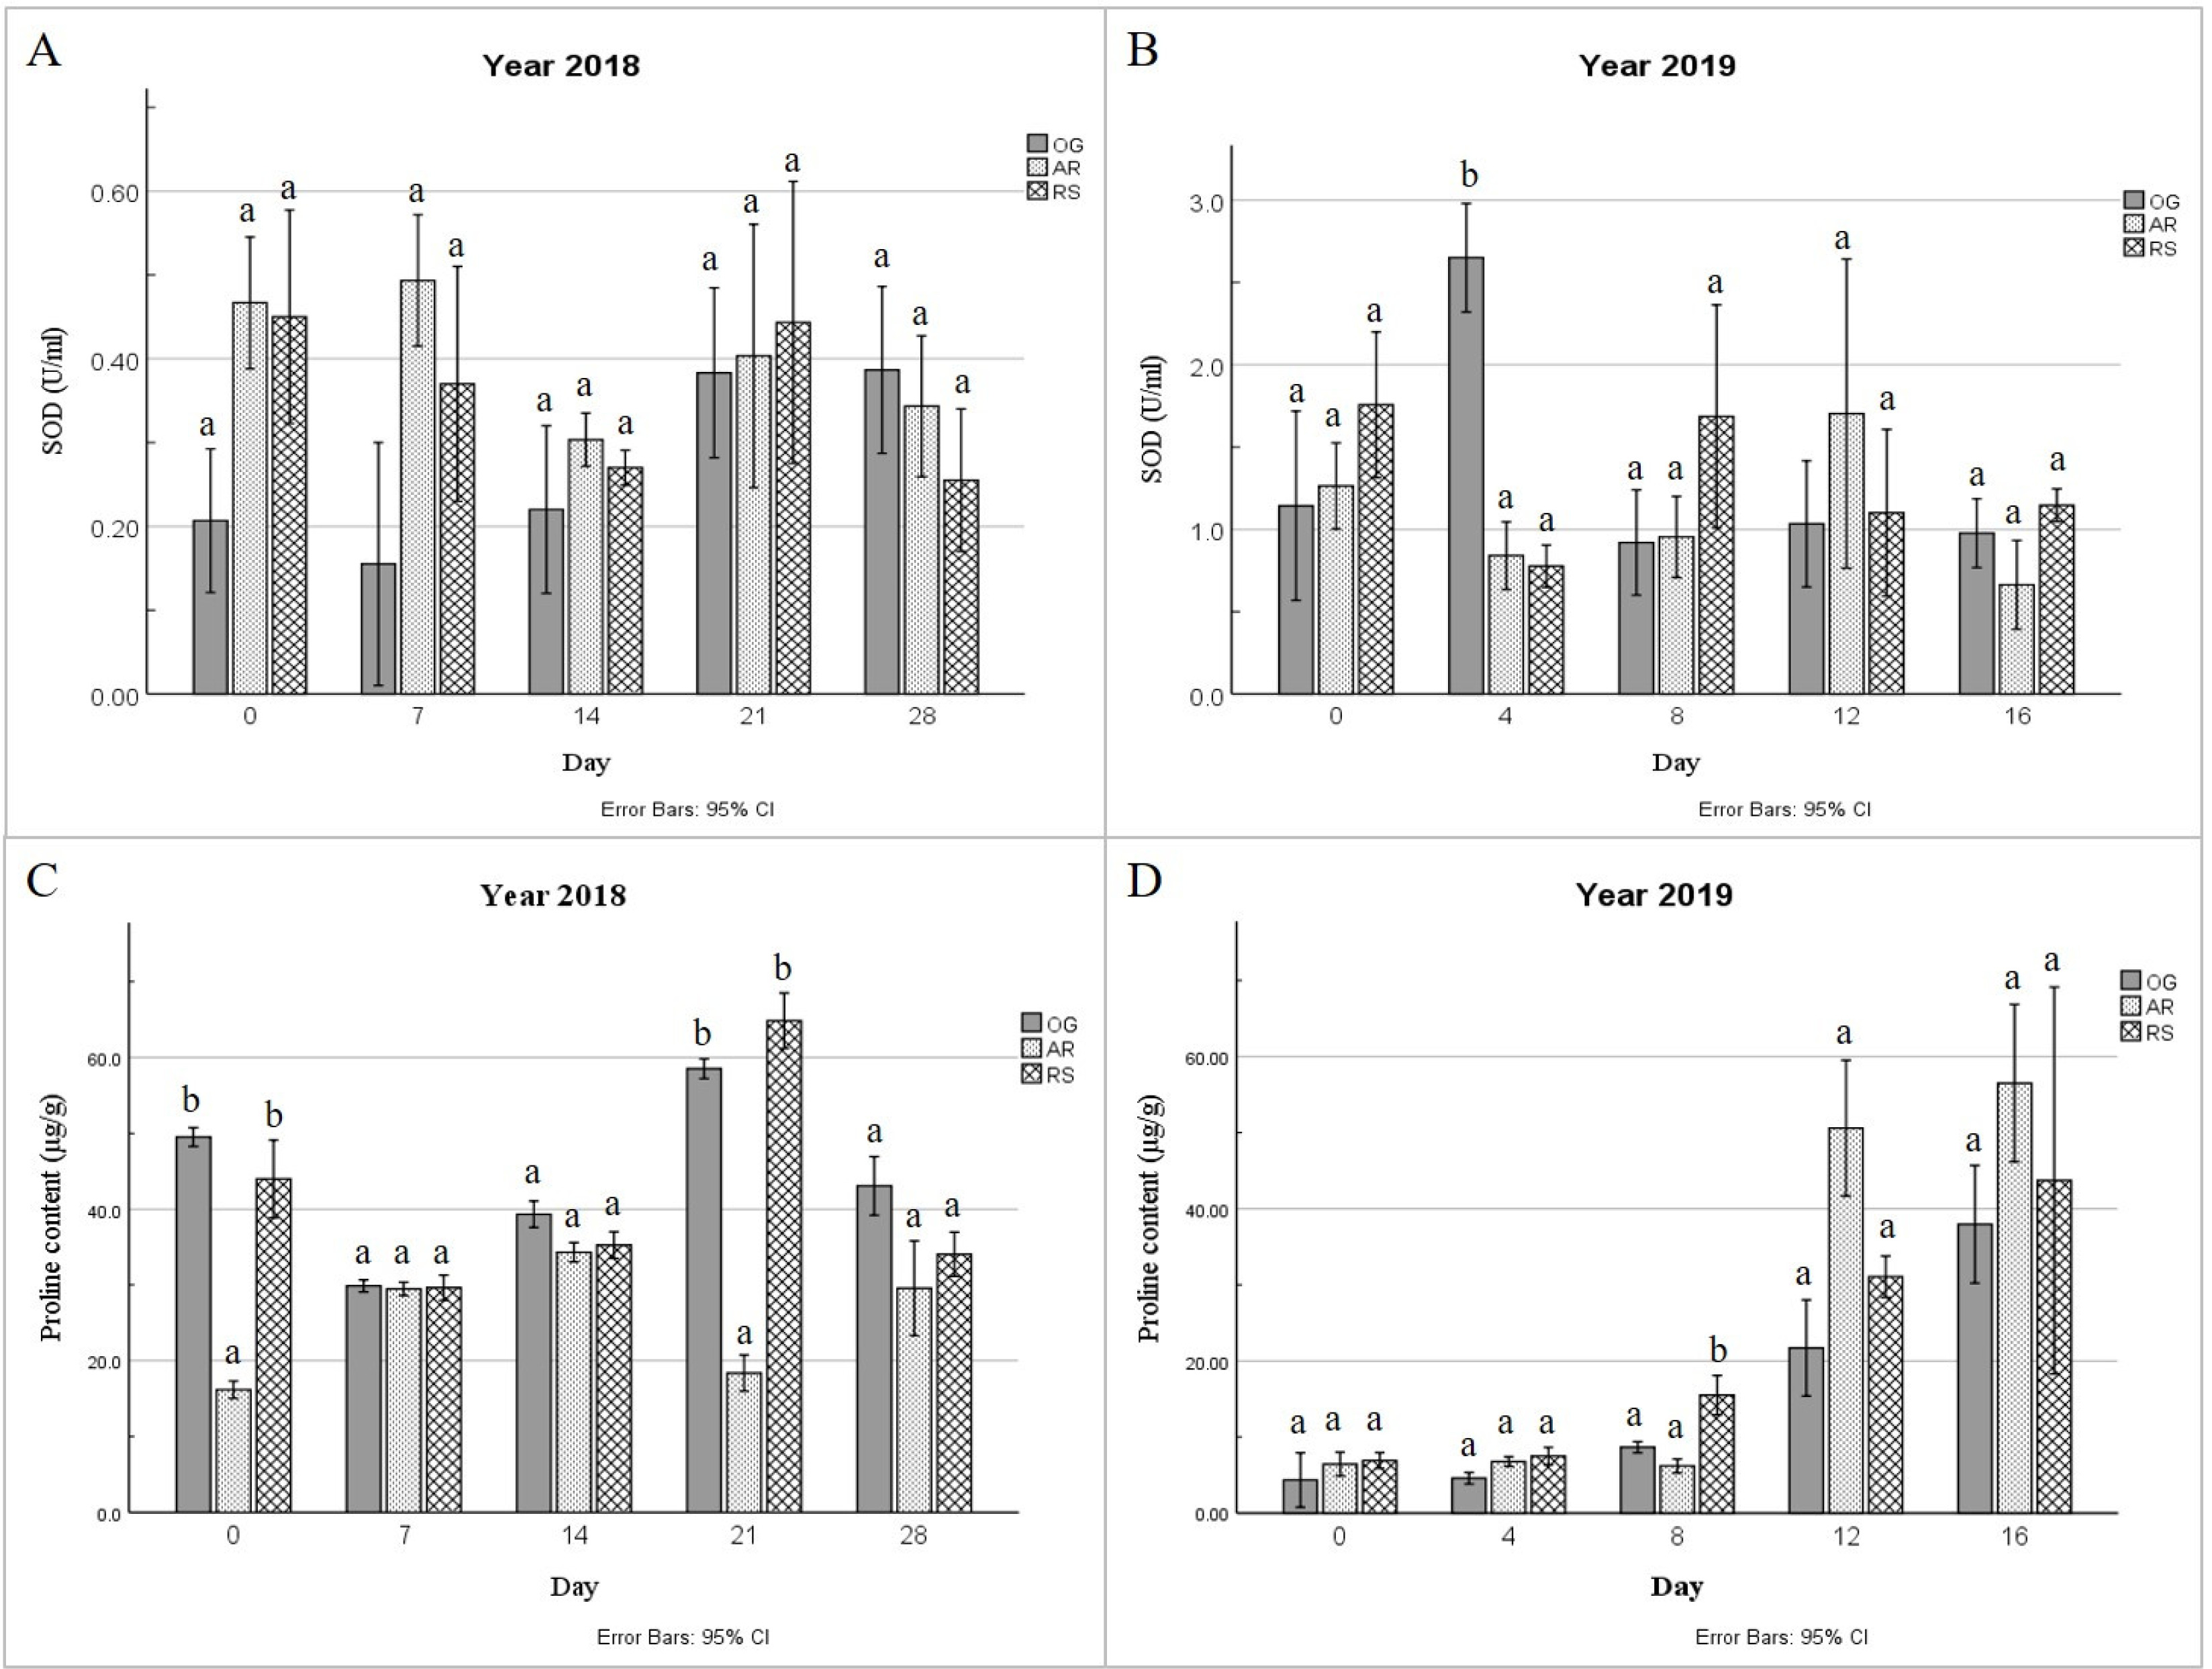
Fig. 5Relative quantification of GGAT1 and CSD2 expression in three maple cultivars subjected to drought stress. The fold change (RQ values) were normalized with actin as a reference gene. RQ values of 2 and above show significant overexpression and below 0.5 is significant downregulation.

Table 1Details of the two primers used in the qRT-PCR analysis.
Table 1
|
Gene |
Protein |
NCBI reference ID |
Function |
Primer sequence |
|
GGAT1
|
Glutamate-glyoxylate aminotransferase 1 |
NM_102180.4 |
Required for ABA and stress-mediated response |
Forward: AGGCGGTTTAGGTGCTTAC
Reverse: GAGTTCTGGGTCACTTGGATAC |
|
CSD2
|
Superoxide dismutase [Cu-Zn] |
KY471357.1 |
Destroy reactive radicals produce within the cell (ROS) |
Forward: CTCATTCCTCCTTCCTCCAATC
Reverse: GCTTTAACGGCGAAGGAAAC |
Table 2ANOVA for volumetric water contentbetween variety and across the years.
Table 2
|
Source of variation |
SS* |
df |
MS** |
F |
Sig. |
|
Variety |
Between Variety (year 2018) |
26.236 |
3 |
8.745 |
0.048 |
0.985 |
|
Within Variety (year 2018) |
2896.607 |
16 |
181.038 |
|
|
|
Total |
2922.843 |
19 |
|
|
|
|
Variety |
Between Variety (year 2019) |
28.081 |
3 |
9.36 |
0.032 |
0.992 |
|
Within Variety (year 2019) |
4742.443 |
16 |
296.403 |
|
|
|
Total |
4770.524 |
19 |
|
|
|
|
Year |
Between Year |
330.257 |
7 |
47.18 |
0.198 |
0.984 |
|
Within Year |
7639.05 |
32 |
238.72 |
|
|
|
Total |
7969.307 |
39 |
|
|
|
Table 3 ANOVA by year for Proline, MDA, SOD, and chlorophyll in all the treatments.
Table 3
|
Time regime |
Proline |
MDA |
SOD |
Chlorophyll |
|
Between groups |
Within groups |
Total |
Between groups |
Within groups |
Total |
Between groups |
Within groups |
Total |
Between groups |
Within groups |
Total |
|
Day 0 |
Sum of |
1411 |
642.6 |
2053.6 |
0.94 |
0.16 |
1.09 |
1.53 |
0.26 |
1.79 |
100.2 |
37.33 |
137.5 |
|
squares |
|
|
|
|
|
|
|
|
|
|
|
|
|
Mean |
1411 |
160.7 |
|
0.94 |
0.04 |
|
1.53 |
0.06 |
|
100.2 |
9.33 |
|
|
square |
|
|
|
|
|
|
|
|
|
|
|
|
|
F |
8.8 |
|
|
23.85 |
|
|
23.71 |
|
|
10.7 |
|
|
|
Sig. |
0.041 |
|
|
0.008 |
|
|
0.008 |
|
|
0.031 |
|
|
|
Day 7 |
Sum of |
820.6 |
4.7 |
825.3 |
0.93 |
0.23 |
1.16 |
1.76 |
2.31 |
4.08 |
506.4 |
8.91 |
515.3 |
|
squares |
|
|
|
|
|
|
|
|
|
|
|
|
|
Mean |
820.6 |
1.2 |
|
0.93 |
0.06 |
|
1.76 |
0.58 |
|
506.4 |
2.23 |
|
|
square |
|
|
|
|
|
|
|
|
|
|
|
|
|
F |
705.8 |
|
|
16.22 |
|
|
3.04 |
|
|
227.4 |
|
|
|
Sig. |
0 |
|
|
0.016 |
|
|
0.156 |
|
|
0 |
|
|
|
Day 14 |
Sum of |
1028.9 |
60.8 |
1089.7 |
0.05 |
0.03 |
0.08 |
1.28 |
0.38 |
1.66 |
365 |
34.55 |
399.6 |
|
squares |
|
|
|
|
|
|
|
|
|
|
|
|
|
Mean |
1028.9 |
15.2 |
|
0.05 |
0.01 |
|
1.28 |
0.1 |
|
365 |
8.64 |
|
|
square |
|
|
|
|
|
|
|
|
|
|
|
|
|
F |
67.7 |
|
|
6.94 |
|
|
13.33 |
|
|
42.3 |
|
|
|
Sig. |
0.001 |
|
|
0.058 |
|
|
0.022 |
|
|
0.003 |
|
|
|
Day 21 |
Sum of |
245.1 |
1705.3 |
1950.4 |
0 |
0.02 |
0.02 |
1.14 |
0.27 |
1.41 |
289.3 |
30.83 |
320.1 |
|
squares |
|
|
|
|
|
|
|
|
|
|
|
|
|
Mean |
245.1 |
426.3 |
|
0 |
0 |
|
1.14 |
0.07 |
|
289.3 |
7.71 |
|
|
square |
|
|
|
|
|
|
|
|
|
|
|
|
|
F |
0.6 |
|
|
0.06 |
|
|
16.63 |
|
|
37.5 |
|
|
|
Sig. |
0.491 |
|
|
0.823 |
|
|
0.015 |
|
|
0.004 |
|
|
|
Day 28 |
Sum of |
165.7 |
275.2 |
440.9 |
0.03 |
0.13 |
0.15 |
0.54 |
0.13 |
0.67 |
88.5 |
208.64 |
297.1 |
|
squares |
|
|
|
|
|
|
|
|
|
|
|
|
|
Mean |
165.7 |
68.8 |
|
0.03 |
0.03 |
|
0.54 |
0.03 |
|
88.5 |
52.16 |
|
|
square |
|
|
|
|
|
|
|
|
|
|
|
|
|
F |
2.4 |
|
|
0.84 |
|
|
16.31 |
|
|
1.7 |
|
|
|
Sig. |
0.196 |
|
|
0.411 |
|
|
0.016 |
|
|
0.263 |
|
Table 4Pearson correlation analysis of moisture content with MDA, SOD, proline, and chlorophyll levels in the maple leaf samples exposed to drought stress.
Table 4
|
Variable |
Moisture (year 2018) |
Moisture(year 2019) |
|
MDA |
0.613**
|
‒0.094 |
|
SOD |
0.063 |
0.127 |
|
Proline |
‒0.183 |
‒0.464**
|
|
Chlorophyll |
0.399*
|
0.318*
|
References
- Basu S, Ramegowda V, Kumar A, Pereira A. 2016. Plant adaptation to drought stress. F1000Research 5..
- Bates LS, Waldren RP, Teare I. 1973. Rapid determination of free proline for water-stress studies. Plant Soil. 39: 205-207.
- Bauerle WL, Dudley JB, Grimes LW. 2003. Genotypic variability in photosynthesis, water use, and light absorp-tion among red and Freeman maple cultivars in response to drought stress. J. Am. Soc. Hort. Sci.. 128(3): 337-342.
- Bauerle WL, Inman WW, Dudley JB. 2006. Leaf abscisic acid accumulation in response to substrate water content: Linking leaf gas exchange regulation with leaf abscisic acid concentration. J. Am. Soc. Hort. Sci.. 131(2): 295-301.
- Carvalho MD. 2008. Drought stress and reactive oxygen species. Plant Signal Behav.. 3(3): 156-165.
- Clay DE, Trooien T. 2017. Understanding soil water and yield variability in precision farming. 137-147..
- Farooq M, Hussain M, Wahid A, Siddique KHM. 2012. Plant Responses to Drought Stress. 1-6..
- Farooq M, Wahid A, Kobayashi N, Fujita D, Basra SMA. 2009. Plant drought stress: effects, mechanisms and management. Sustainable Agriculture. 29: 153-188.
- Farrell ML, Chabot BF. 2012. Assessing the growth potential and economic impact of the US maple syrup industry. Journal of Agriculture, Food Systems, and Community Development. 2(2): 11-27.
- Giannopolitis CN, Ries SK. 1977. Superoxide Dismutases I: Occurrence in higher plants. Plant Physiol.. 59(2): 309-314.
- Graignic N, Tremblay F, Bergeron Y. 2018. Influence of northern limit range on genetic diversity and structure in a widespread North American tree, sugar maple (Acer saccharum Marshall). Ecol. Evol.. 8(5): 2766-2780.
- Gupta DK, Palma JM, Corpas FJ. 2016. Redox state as a central regulator of plant-cell stress responses. Springer International Publishing.
- Hanson CT, Blevins R. 1979. Soil water in coarse fragments. Soil Sci. Soc. Am. J.. 43(4): 819-820.
- Houston DR, Allen DC, Lachance D. 1989. Sugarbush management: a guide to maintaining tree health. US Department of Agriculture. Forest Service, Northeastern Forest Experiment Station.:
- Igarashi D, Tsuchida H, Miyao M, Ohsumi C. 2006. Glutamate:Glyoxylate aminotransferase modulates amino acid content during photorespiration. Plant Physiol.. 142(3): 901-910.
- Impa SM, Vennapusa AR, Bheemanahalli R, Sabela D, Boyle D, Walia H, et al. 2020. High night temperature induced changes in grain starch metabolism alters starch, protein, and lipid accumulation in winter wheat. Plant Cell Environ.. 43(2): 431-447.
- Jajic I, Sarna T, Strzalka K. 2015. Senescence, stress, and reactive oxygen species. Plants. 4: 393-411.
- Kalubi K, Mehes-Smith M, Narendrula R, Michael P, Omri A. 2015. Molecular analysis of red maple (Acer rubrum) populations from a reclaimed mining region in Northern Ontario (Canada): soil metal accumulation and trans-location in plants. Ecotoxicology. 24(3): 636-647.
- Kaya MD, Okçu G, Atak M, Çikili Y, Kolsarici Ö. 2006. Seed treatments to overcome salt and drought stress during germination in sunflower (Helianthus annuus L.). Eur. J. Agron.. 24(4): 291-295.
- Kijowska-Oberc J, Staszak AM, Wawrzyniak MK, Ratajczak E. 2020. Changes in proline levels during seed development of orthodox and recalcitrant seeds of genus Acer in a climate change scenario. Forests. 11(12): 1362
- Kirkham MB. 2014. Principles of soil and plant water relations. Academic Press..
- Li L, Liu Y, Liu Y, He B, Wang M, Yu C, et al. 2015. Physiological response and resistance of three cultivars of Acer rubrum L. to continuous drought stress. Acta Ecol. Sin.. 35(6): 196-202.
- Lima JM, Nath M, Dokku P, Raman K, Kulkarni K, Vishwakarma C, et al. 2015. Physiological, anatomical and transcriptional alterations in a rice mutant leading to enhanced water stress tolerance. AoB Plants 7..
- Ludlow MM, Muchow RC. 1990. A critical evaluation of traits for improving crop yields in water-limited environ-ments. Adv. Agron.. 43: 107-153.
- Nabi RBS, Tayade R, Hussain A, Kulkarni KP, Imran QM, Mun B-G, et al. 2019. Nitric oxide regulates plant responses to drought, salinity, and heavy metal stress. Environ. Exp. Bot.. 161: 120-133.
- Nisarga KN, Vemanna RS, Chandrashekar BK, Rao H, Vennapusa AR, Narasimaha A, et al. 2017. Aldo- ketoreductase 1 (AKR1) improves seed longevity in tobacco and rice by detoxifying reactive cytotoxic com-pounds generated during ageing. Rice. 10(1): 1-12.
- Percival GC, Sheriffs CN. 2002. Identification of drought- tolerant woody perennials using chlorophyll fluorescence. J. Arboric.. 28: 215-223.
- Pukacka S, Pukacki P. 1997. Changes in soluble sugars in relation to desiccation tolerance and effects of dehy-dration on freezing characteristics of Acer platanoides and Acer pseudoplatanus seeds. Acta Physiol. Plant. 19(2): 147-154.
- Rahbarian R, Khavari-Nejad R, Ganjeali A, Bagheri A, Najafi F. 2011. Drought stress effects on photosynthesis, chlorophyll fluorescence and water relations in tolerant and susceptible chickpea (Cicer arietinum L.) genotypes. Acta Biol. Crac. Ser. Bot.. 53: 47-56.
- Rai RK, Singh VP, Upadhyay A. 2017. Soil analysis. In Planning and evaluation of irrigation projects. edited by: Rai, RK, Singh, VP, and Upadhyay, A., Academic Press, Texas, USA:505-523.:
- Sarker U, Oba S. 2018. Catalase, superoxide dismutase and ascorbate-glutathione cycle enzymes confer drought tolerance of Amaranthus tricolor. Sci. Rep.. 8(1): 1-12.
- Seki M, Kamei A, Yamaguchi-Shinozaki K, Shinozaki K. 2003. Molecular responses to drought, salinity and frost: common and different paths for plant protection. Curr. Opin. Biotechnol.. 14(2): 194-199.
- Sharma P, Jha AB, Dubey RS, Pessarakli M. 2012. Reactive oxygen species, oxidative damage, and antioxidative defense mechanism in plants under stressful conditions. J. Bot.. 2012: 217037-217037.
- Shinozaki K, Yamaguchi-Shinozaki K. 2007. Gene networks involved in drought stress response and tolerance. J. Exp. Bot.. 58(2): 221-227.
- Thompson JR, Carpenter DN, Cogbill CV, Foster DR. 2013. Four centuries of change in northeastern United States forests. PloS one. 8(9): e72540
- Vemanna RS, Babitha K, Solanki JK, Reddy VA, Sarangi S, Udayakumar M. 2017. Aldo-keto reductase-1 (AKR1) protect cellular enzymes from salt stress by detoxifying reactive cytotoxic compounds. Plant Physiol. Biochem.. 113: 177-186.
- Walters RS, Yawney HW. 1990. Acer rubrum L. Silvics of North America. Vol 2, Pages 60-69..
- Wang X, Cai X, Xu C, Wang Q, Dai S. 2016. Drought- responsive mechanisms in plant leaves revealed by proteomics. Int. J. Mol. Sci.. 17(1): 1706
- Wiecheteck LH, Giarola NF, de Lima RP, Tormena CA, Torres LC, de Paula AL. 2020. Comparing the classical permanent wilting point concept of soil (-15,000 hPa) to biological wilting of wheat and barley plants under contrasting soil textures. Agric. Water Manage.. 230: 105965
- Wingler A, Lea PJ, Quick WP, Leegood RC. 2000. Photorespiration: Metabolic pathways and their role in stress protection. Philos. Trans. R. Soc. Lond. B. Biol. Sci.. 355(1402): 1517-1529.
- Yaish MW. 2015. Proline accumulation is a general response to abiotic stress in the date palm tree (Phoenix dactylifera L.). Gen. Mol. Res.. 14(3): 9943-9950.
- Yamaguchi-Shinozaki K, Shinozaki K. 2006. Transcrip-tional regulatory networks in cellular responses and toler-ance to dehydration and cold stresses. Annu. Rev. Plant Biol.. 57: 781-803.
- You J, Chan Z. 2015. ROS regulation during abiotic stress responses in crop plants. Front. Plant Sci.. 6: 1092
- Zwack JA, Graves WR, Townsend AM. 1999. Variation among red and Freeman maples in response to drought and flooding. HortScience. 34(4): 664-668.