Abstract
This research attempted to validate novel molecular markers linked to high antioxidant traits using an F2 population and a local Thai rice population. We performed total flavonoid content, total phenolic content (TPC), and ferric reducing antioxidant power (FRAP) assays to assess the antioxidant capacities of rice populations. In the F2 (“Pathum Thani 1”דHawm Mali Daeng”) population, these traits exhibited a quantitative distribution with high heritability (82.7%–98.3%) and high genetic advance (66%–94%). In validation using 10 molecular markers, OsRc and In1-Rc displayed polymorphism in parent cultivars and in bulked segregant analysis. However, only OsRc had strong associations with TPC (R2 = 52.2%, p < 0.001) and FRAP (R2 = 43.0%, p < 0.001), whereas In1-Rc featured no significant associations (R2 ≤ 0.1%). When verified in Thai rice cultivars, OsRc could discriminate red pericarp rice cultivars with high antioxidant properties from white pericarp cultivars with low antioxidant activity, confirming its efficiency in selecting antioxidant traits in rice. These findings indicate that OsRc is a functional marker for selecting rice lines with high antioxidant activity, thereby facilitating early-stage genotyping in rice breeding programs.
-
Key words: Antioxidant properties, Marker-assisted selection, Molecular marker, Plant molecular breeding, Rice (Oryza sativa L.)
Introduction
Rice (
Oryza sativa L.) is a staple crop that has been cultivated and consumed in Thailand for many centuries. It is also a crucial crop of economic interest for both domestic consumption and export production. From 2022 to 2023, Thailand was the world’s second-largest rice exporter, accounting for 16% of the global market share (
Sowcharoensuk 2024), and the country ranked sixth among rice-producing countries in 2023 (
FAOSTAT 2025). Currently, there is growing interest in colored rice cultivars (red, purple, and brown pericarp) because of their rich content of antioxidants and nutrients that promote health benefits. Several studies reported that colored rice contains phytochemicals, including phenolic compounds, flavonoids, carotenoids, tocopherols, and γ-oryzanols. In particular, several fractions of rice, such as the husk, bran, and pericarp, are rich in phenolic compounds (
Butsat et al. 2010;
Goffman et al. 2004;
Shao et al. 2014b;
Walter et al. 2013). Additionally, purple and black pericarp rice possess substantial anthocyanin levels, whereas red pericarp rice features high proanthocyanidin content (
Gunaratne et al. 2013;
Limtrakul et al. 2019;
Oki et al. 2002). These compounds exert antioxidant effects (
Callcott et al. 2019;
Hansakul et al. 2011), confer anti-inflammatory (
Arjinajarn et al. 2017;
Callcott et al. 2018) and anti-aging properties (
Limtrakul et al. 2019), and protect against the invasion of cancer cells such as liver (
Chen et al. 2006) and breast cancer cells (
Pintha et al. 2015;
Pintha et al. 2014).
To investigate antioxidant compounds in colored rice, several studies commonly performed a range of assays, including the total phenolic content (TPC) and total flavonoid content (TFC) assays and various antioxidant capacity assays such as 2,2-diphenyl-1-picrylhydrazyl (DPPH) radical-scavenging activity, ferric reducing antioxidant power (FRAP), and 2-azino-bis-3-ethylbenzothiazoline-6-sulfonic acid (ABTS) radical cation decolorization assays (
Jin et al. 2009;
Pramai et al. 2016;
Shao et al. 2011;
Shen et al. 2009;
Sompong et al. 2011;
Thaworn et al. 2021). Red rice cultivars consistently exhibit high TPC and TFC, which displayed significantly positive correlations with antioxidant activities, indicating that the presence of phenolic and flavonoid compounds in plant extracts contributes significantly to antioxidant capacities (
Purnama et al. 2025;
Shen et al. 2009;
Thaworn et al. 2021). Moreover, high FRAP has been identified in red rice (
Sompong et al. 2011). Importantly, strong positive correlations (
r = 0.96–1.00) have been consistently reported among FRAP, TPC, and TFC compared with other assays (
Dudonné et al. 2009;
Pramai et al. 2016;
Sompong et al. 2011). The FRAP assay, which uses electron transfer reactions, exhibited comparable redox potential as other scavenging assays such as Trolox equivalent antioxidant capacity (TEAC;
Prior et al. 2005). FRAP assays are conducted under acidic (pH 3.6) conditions to maintain iron solubility and enhance redox potential (
Prior et al. 2005), and their results exhibit strong agreement with overall antioxidant capacity. Given the strong correlations among TPC, TFC, and various antioxidant capacity assays, a comprehensive determination can be effectively achieved with a selected, highly representative set of measurements (
Huang et al. 2005).
The biosynthesis of antioxidant compounds in rice, such as anthocyanins and proanthocyanidins, is primarily regulated by the flavonoid biosynthetic pathway. Most colored rice cultivars are rich in flavonoids, such as anthocyanins in black rice and proanthocyanidins in red rice (
Chen et al. 2019;
Goffman et al. 2004;
Gunaratne et al. 2013;
Limtrakul et al. 2019;
Oki et al. 2002). Genetic and molecular studies have elucidated the mechanistic basis of antioxidant production in rice. For instance,
Chen et al. (2019) identified 32 genes involved in the flavonoid biosynthesis pathway in rice, including key enzymes such as chalcone isomerase, flavanone 3-hydroxylase, anthocyanin synthase (ANS), and flavanol synthase (FLS). Variations in
ANS (
Os06g0162500) and
FLS (
Os10g0536400) genes, which affect gene expression and flavonoid biosynthesis, directly influence the high flavonoid content in colored rice and low flavonoid content in white rice (
Chen et al. 2019). For example, relative expression of
ANS is higher in red rice.
An important gene is
Rc (
LOC_Os07g11020) on chromosome 7, encoding a basic helix-loop-helix (bHLH) transcription factor. This gene is a key regulator of proanthocyanidin biosynthesis in red pericarp rice that subsequently determines its red pericarp color (
Furukawa et al. 2007;
Sweeney et al. 2006). Conversely, black and white rice cultivars feature a 14-bp deletion in exon 6 of this gene, resulting in a loss of function and a lack of proanthocyanidin synthesis (
Lim et al. 2013;
Sweeney et al. 2006). Moreover,
Rc been reported to be involved in antioxidant traits in red rice (
Purnama et al. 2025). In the context of black pericarp rice, different genetic mechanisms are at play.
Ra, encoding the anthocyanin regulatory bHLH transcription factor, is associated with antioxidant traits in rice (
Purnama et al. 2025;
Shao et al. 2011). Furthermore,
OsTT8 (
LOC_Os04g47059.1) encodes another bHLH transcription factor essential for anthocyanin biosynthesis and the formation of purple–black pericarp in rice (
Kim et al. 2021;
Zheng et al. 2021).
OsTT8 is closely linked to
Ra and located within the same linkage disequilibrium block (
Purnama et al. 2025).
Based on this understanding of the genetic control of antioxidant pathways and pericarp color, a panel of molecular markers targeting specific genomic regions known to be associated with antioxidant traits was initially selected for this study. Genetic loci such as
LOC_Os06g17870.1,
LOC_Os06g17410.1,
LOC_Os07g11020,
LOC_Os04g47059, and
LOC_Os08g33460 were identified as associated with antioxidant traits in the local Thai rice panel through previous genome-wide association studies (GWAS;
Anantasri 2024;
Purnama et al. 2025;
Thaworn 2020). Eight molecular markers were specifically developed for these genomic regions (
Table 1). Additionally, two markers targeting genes involved in the flavonoid biosynthesis pathway were retrieved for further validation in the Thai rice populations (
Chen et al. 2019).
Conventional breeding for high antioxidant properties is time-consuming, as these traits must be measured in mature rice grains, requiring approximately 5–7 months per cultivation cycle and multiple generations of selection, in addition to their high production costs and labor-intensive nature (
Kate-ngam 2014;
Shabir et al. 2017). Molecular or DNA marker technology, commonly applied to select the complex traits of rice, offers an effective and powerful tool known as marker-assisted selection (MAS). MAS facilitates breeding programs by linking markers directly to genes or quantitative trait loci (QTLs) that influence the expression of target traits. Importantly, MAS permits the early selection of complex traits at the seedling stage based on genotype, which significantly reduces time and costs compared with those of conventional breeding (
Collard et al. 2008;
Kate-ngam 2014;
Sreewongchai et al. 2014;
Swapnil et al. 2019). Although previous studies identified QTLs and genes associated with antioxidants in colored rice (
Jin et al. 2009;
Purnama et al. 2025;
Shao et al. 2014a;
Thaworn 2020;
Xu et al. 2016;
Xu et al. 2017), the robust validation of these functional markers in diverse breeding populations for practical application remains largely unexplored. Consequently, this study examined the efficiency of selected molecular markers associated with high antioxidant traits in rice, initially through bulked segregant analysis (BSA) in an F
2 population. The most promising candidate marker will be verified for its potential application in a diverse panel of local Thai rice cultivars in future research.
Materials and Methods
Plant and cultivation
All plant materials were kindly provided by the Pathum Thani Rice Research Center (Pathum Thani, Thailand). Briefly, in the dry season (February to May 2022), the parent cultivars “Pathum Thani 1” (P1) and “Hawm Mali Daeng” (P2) were cultivated using 15 plants of each cultivar. Additionally, 454 F
2 plants were grown and harvested at the Pathum Thani Rice Research Center. Young rice leaves were cut and collected individually. Then, the leaf samples were dried using a hot air oven at 60℃ for 24 h and stored in silica gel for further DNA extraction (
Nagy 2010). The parent and F
2 population grains were harvested at the maturity stage, and all grains were dried in a hot air oven at 50℃ for 5 days. Then, the grain samples were stored in a refrigerator at 4℃ for further analysis.
The parent and F2 grain samples were dehulled to brown rice using a mini miller (NW150, Green Bee, Thailand). The pericarp color of each F2 individual in comparison with the parental pericarp colors was visually observed and recorded. Then, the brown rice samples were ground into flour using a mixer mill (MM400, Retsch, Germany).
Sample extraction for antioxidant compounds
Extraction was performed using the small-scaled protocol described by
Xu et al. (2016) with minor modifications. In brief, 100 mg of rice sample were extracted with 500 µL of aqueous 80% methanol (v/v) with shaking in a shaker (KS 260 basic, IKA, Thailand) at 200 rpm at room temperature for 24 h. Then, the mixtures were centrifuged at 6000 rpm at 4℃ for 15 min, and the supernatant was collected into a new 1.5-mL tube. The residues were re-extracted using the same procedure. The supernatants from both extractions were pooled and stored at −20℃ until the antioxidant assays were conducted. Each sample was extracted in a completely randomized design in two replications.
TFC was determined by the aluminum chloride colorimetric method with slight modifications (
Karim et al. 2014). Standard solutions of rutin were prepared at concentrations of 0, 25, 50, 100, 200, and 400 μg/mL to generate the standard curve. Briefly, 180 μL of rice extract or standard solution were added to 20 μL of 2% aluminum chloride in methanol. After 30 min of incubation in the dark at room temperature, the absorbance at 405 nm was measured using a microplate reader (EZ Read 400, Biochrom, UK). TFC was expressed as micrograms of rutin equivalent per gram of rice (µg RE/g of rice).
TPC was measured in rice extract using the Folin–Ciocalteu assay as described by
Miliauskas et al. (2004),
and Zhang et al. (2006) with slight modifications. Specifically, 20 µL of sample extracts/standard and 100 µL of Folin–Ciocalteu reagent were added into a 96-well plate, which was incubated in the dark at room temperature for 1 min. After that, 80 µL of 7.5% sodium bicarbonate were added and incubated in the dark for 30 min. After incubation, absorbance was measured at 765 nm using a microplate reader (SpectraMax M3, Molecular Devices, San Jose, CA, USA). Additionally, TPC was compared to the standard curve of gallic acid and expressed as micrograms of gallic acid equivalent per gram of rice (µg GAE/g of rice).
To assess FRAP, FRAP reagents were freshly prepared using the protocol described by
Somsong et al. (2020). Briefly, freshly prepared FRAP reagents consisting of 300 mM acetate buffer (pH 3.6), 10 mM TPTZ in 40 mM HCl, and 20 mM FeCl
3 were mixed at a ratio of 10:1:1 (v/v/v). The measurement followed the methods described by
Chaipoot et al. (2023). In total, 20 μL of the sample (rice extract/standard solution) were mixed with 180 μL of the FRAP reagent, and after 5 min of incubation at 37℃, the absorbance of the mixture was measured at 595 nm using a microplate reader. Rutin at concentrations of 25, 50, 100, 200, and 400 μg/mL was used to generate a standard curve. FRAP was expressed as micrograms of TEAC per gram of rice (µg TEAC/g of rice.
The leaf samples of parents and F
2 individuals were extracted to obtain genomic DNA (gDNA) using the modified CTAB method (
Barbier et al. 2019). The quality and concentration of the DNA samples were measured using a Nanodrop spectrophotometer (Nanodrop™ 2000, Thermo Fisher Scientific, Waltham, MA, USA). The DNA samples were diluted to a final concentration of 20 ng/μL and stored at −20℃ until the experiment was performed.
DNA samples were amplified using 10 pairs of molecular markers (
Supplemental Table 1) by PCR using a thermal cycler (T100™, Bio-Rad, Hercules, CA, USA). PCR was performed in a 10 μL reaction mixture containing 5.25 μL of ultrapure type I water (DNase-free water), 1 μL of 10× PCR buffer, 0.5 μL each of 10 mM forward and reverse primers, 0.5 μL of 50 mM MgCl
2, 0.2 μL of 10 mM dNTPs, 0.05 μL of
Taq polymerase, and 2 μL of 20 ng/μL DNA template. The amplification program was as follows: initial denaturation at 95℃ for 3 minutes; 35 cycles of denaturation at 95℃ for 30 seconds, annealing for 30 seconds (the annealing temperature is displayed in
Supplementary Table 1), and extension at 72℃ for 40 seconds; and final extension at 72℃ for 5 minutes.
The PCR products were separated on an electrophoresis system using 2% agarose gel (SBIO, Thailand). the band size of the PCR product was compared to a 100-bp DNA ladder. The gel was run at a constant voltage of 100 V for 30 minutes, and the product band was visualized using an LED transilluminator (BluPAD, Bio-Helix, Taiwan).
Furthermore, H8 and In1-Rc were digested with restriction enzymes to identify polymorphisms in the parents and F2 individuals. The PCR products of H8 and In1-Rc were digested by HpyCH4V and NgoMIV (New England Biolabs, Ipswich, MA, USA), respectively, according to the manufacturer’s instructions. Briefly, the reaction mixture comprised 10 μL of the PCR product, 2 μL of rCutSmart™ Buffer, 0.5 μL of the restriction enzyme, and 7.5 μL of ultrapure type I water. Then, the mixtures were incubated at 37℃ for 2 hours, followed by 65℃ for 20 minutes for HpyCH4V at 37℃ for 1 hour for NgoMIV. The incubations were performed using a thermal cycler.
Validation of molecular markers using BSA
Primarily to compare polymorphic markers between P1 and P2, gDNA from the parents was used as a DNA template for PCR with 10 molecular markers. The polymorphic markers in the parent cultivars were subsequently validated to identify the candidate markers using the BSA approach.
BSA was used to identify markers linked to specific genomic regions regulating antioxidant traits according to the method of
Michelmore et al. (1991). To perform BSA, 50 plants, each with low and high TPC were classified into the high TPC (Bulk1) and low-TPC (Bulk2) groups, respectively. gDNA was isolated from the leaves of F
2 individuals in Bulk1 and Bulk2, as well as their parents. To construct Bulk1 and Bulk2, DNA from both groups was pooled at an equal concentration (20 ng/μL), and 5 μL of each DNA sample were pooled. Finally, the bulk samples were subjected to PCR targeting polymorphic molecular markers, and the PCR products were separated by 2% agarose gel electrophoresis. BSA-based polymorphic markers, indicating genetic differences between the TPC groups, were identified.
The polymorphic markers from BSA were evaluated in 454 F2 plants using PCR. The PCR product size of the F2 individuals was assigned with genotypic symbols by comparing them to their parents. BB and AA were assigned for the homozygous allele identical to those of P1 and P2, respectively, and the heterozygous allele was assigned as AB.
Verification of MAS in Thai rice cultivars
In total, 21 Thai rice cultivars were selected from their pericarp colors and antioxidant properties in terms of TFC, TPC, FRAP, ABTS, and DPPH as previously reported in
Anantasri (2024), including seven cultivars each from black, red, and white pericarp rice. To verify the efficiency of a novel marker, the gDNA of 21 Thai rice cultivars was isolated using CTAB methods for PCR genotyping with the marker.
To evaluate marker–trait associations, Pearson’s correlation analysis was performed, and simple linear regression was used to estimate R
2. One-way analysis of variance (ANOVA) and Duncan’s multiple range test (DMRT) were conducted to measure the significant differences in antioxidant traits amongst the different genotypes at
p < 0.05. All statistical analyses were conducted using SPSS software version 28 (
IBM Corp. 2022). The boxplots and graphs were illustrated using the “ggplot2” package in R (
Wickham 2016).
The genetic components of 454 F
2 individuals were estimated from the variance equations for TFC, TPC, and FRAP. The variance component was estimated for antioxidant traits in the F
2 population. The genetic variance (), phenotypic variance (), and environmental variance () were estimated using equations 1–3. Broad sense heritability (
H2), the genotypic coefficient of variation (GCV), and the phenotypic coefficient of variation (PCV) were computed using equations 4–6 as reported by
Singh et al. (1985). Genetic advance (GA) and percent genetic advance (%GA) were calculated using equations 7 and 8 (
Johnson et al. 1955).
In the equations, MSG and MSE denote the mean square and mean squared error of the F2 population from ANOVA, respectively, r is the number of replications, x¯ is the mean of traits, and K is the standard selection intensity at 5% (2.063)
GCV and PCV were classified as low (<10%), moderate (10%–20%), or high (>20%;
Sivasubramanian et al. 1973). Percentage of heritability (broad sense) was categorized as described by
Robinson et al. (1949) as low (<20%), moderate (20%–60%), or high (>60%). %GA was categorized as low (<10%), moderate (10%–20%), or high (>20%;
Johnson et al. 1955).
Results
Rice pericarp color and antioxidant traits in the F2 population
Pericarp color was observed by comparing the pericarp color of each F
2 individual to that of their parents. The results (
Fig. 1D) illustrated that 334 of 454 F
2 plants had red pericarp, and the remaining 120 plants had white pericarp.
P1, the white pericarp parent, had low TFC with a mean of 84.19 ± 47.54 mg RE/g of rice (
Table 2). However, TFC was high in P2, the red pericarp parent, with a mean of 155.90 ± 69.07 mg RE/g of rice. TFC in the F
2 population exhibited a wide range of 23.08–301.28 mg RE/g of rice and a mean of 129.56 ± 48.59 mg RE/g of rice. These values were within the range of those observed in parent cultivars. TFC could not distinguish individuals based on pericarp color, as the value overlapped between white and red pericarp rice individuals (
Fig. 1A) because of the high variation in this trait.
As presented in
Table 2, TPC was approximately 3.7-fold higher in P2 (1925.71 ± 167.45 mg GAE/g of rice) than in P1 (516.88 ± 36.89 mg GAE/g of rice). In the F
2 population, TPC ranged from 258.33 to 2710.70 mg GAE/g of rice, and the mean was 1148.92 ± 528.54 mg GAE/g of rice, which was higher than that in P1 but lower than that in P2. The distribution graph (
Fig. 1B) illustrates that individuals with white pericarp tended to exhibit low-TPC, whereas those with red pericarp featured high TPC, indicating that TPC could be related to pericarp color.
As presented in
Table 2, mean of FRAP in P2 (1811.78 ± 263.63 mg TEAC/g of rice) was 2.8-fold greater than that in P1 (625.05 ± 55.82 mg TEAC/g of rice). Additionally, in the F
2 population, FRAP widely ranged from 197.05 to 3176.16 mg TEAC/g of rice, and the mean was 1351.77 ± 642.59 mg TEAC/g of rice, which was intermediate between the values for the parent cultivars. Moreover, FRAP exhibited a continuous distribution (
Fig. 1C) in the segregating population, with low values typically observed in individuals with white pericarp and higher values in individuals with red pericarp. Therefore, FRAP might be reflective of pericarp color.
All antioxidant traits exhibited a continuous distribution, suggesting that these traits were quantitative or polygenic. Additionally, in the F
2 population, the skewness and kurtosis of each trait (
Table 2) were extremely close to 0, suggesting approximately normal distributions. Kurtosis was negative for TPC and FRAP (
Table 2), indicating a platykurtic distribution with a relatively flatter peak because of the bimodal distribution (
Fig. 1B).
The correlations among those antioxidant traits were analyzed using Pearson’s correlation analysis. Pearson’s correlation coefficient (
Table 3) indicated a strong positive correlation between TPC and FRAP (
r = 0.93,
p < 0.01). On the contrary, TFC had weaker correlations with TPC and FRAP (
r = 0.45–0.48,
p < 0.01).
The success of trait selection depends on heritability, genetic variability, and effective selection strategies. These parameters are important for understanding the effectiveness of selection and for decision-making among plant breeders. The selection of TFC, TPC, and FRAP should be prioritized for breeding superior red rice lines with high antioxidant traits. In the F
2 population, PCV was slightly higher than GCV for all traits (
Table 4). Moreover, GCV and PCV were highest for FRAP (46.94% and 48.13%, respectively), followed by TPC (45.79% and 46.19%, respectively) and TFC (35.69% and 39.24%, respectively). The difference between PCV and GCV was smaller than 10% for all traits. In addition, all antioxidant traits displayed high heritability (82%–98%). GA describes the genetic gain under selection. %GA was high for TFC, TPC, and FRAP, ranging approximately 66%–94%, suggesting the presence of additive gene action. High heritability, together with high %GA, was observed for all antioxidant traits.
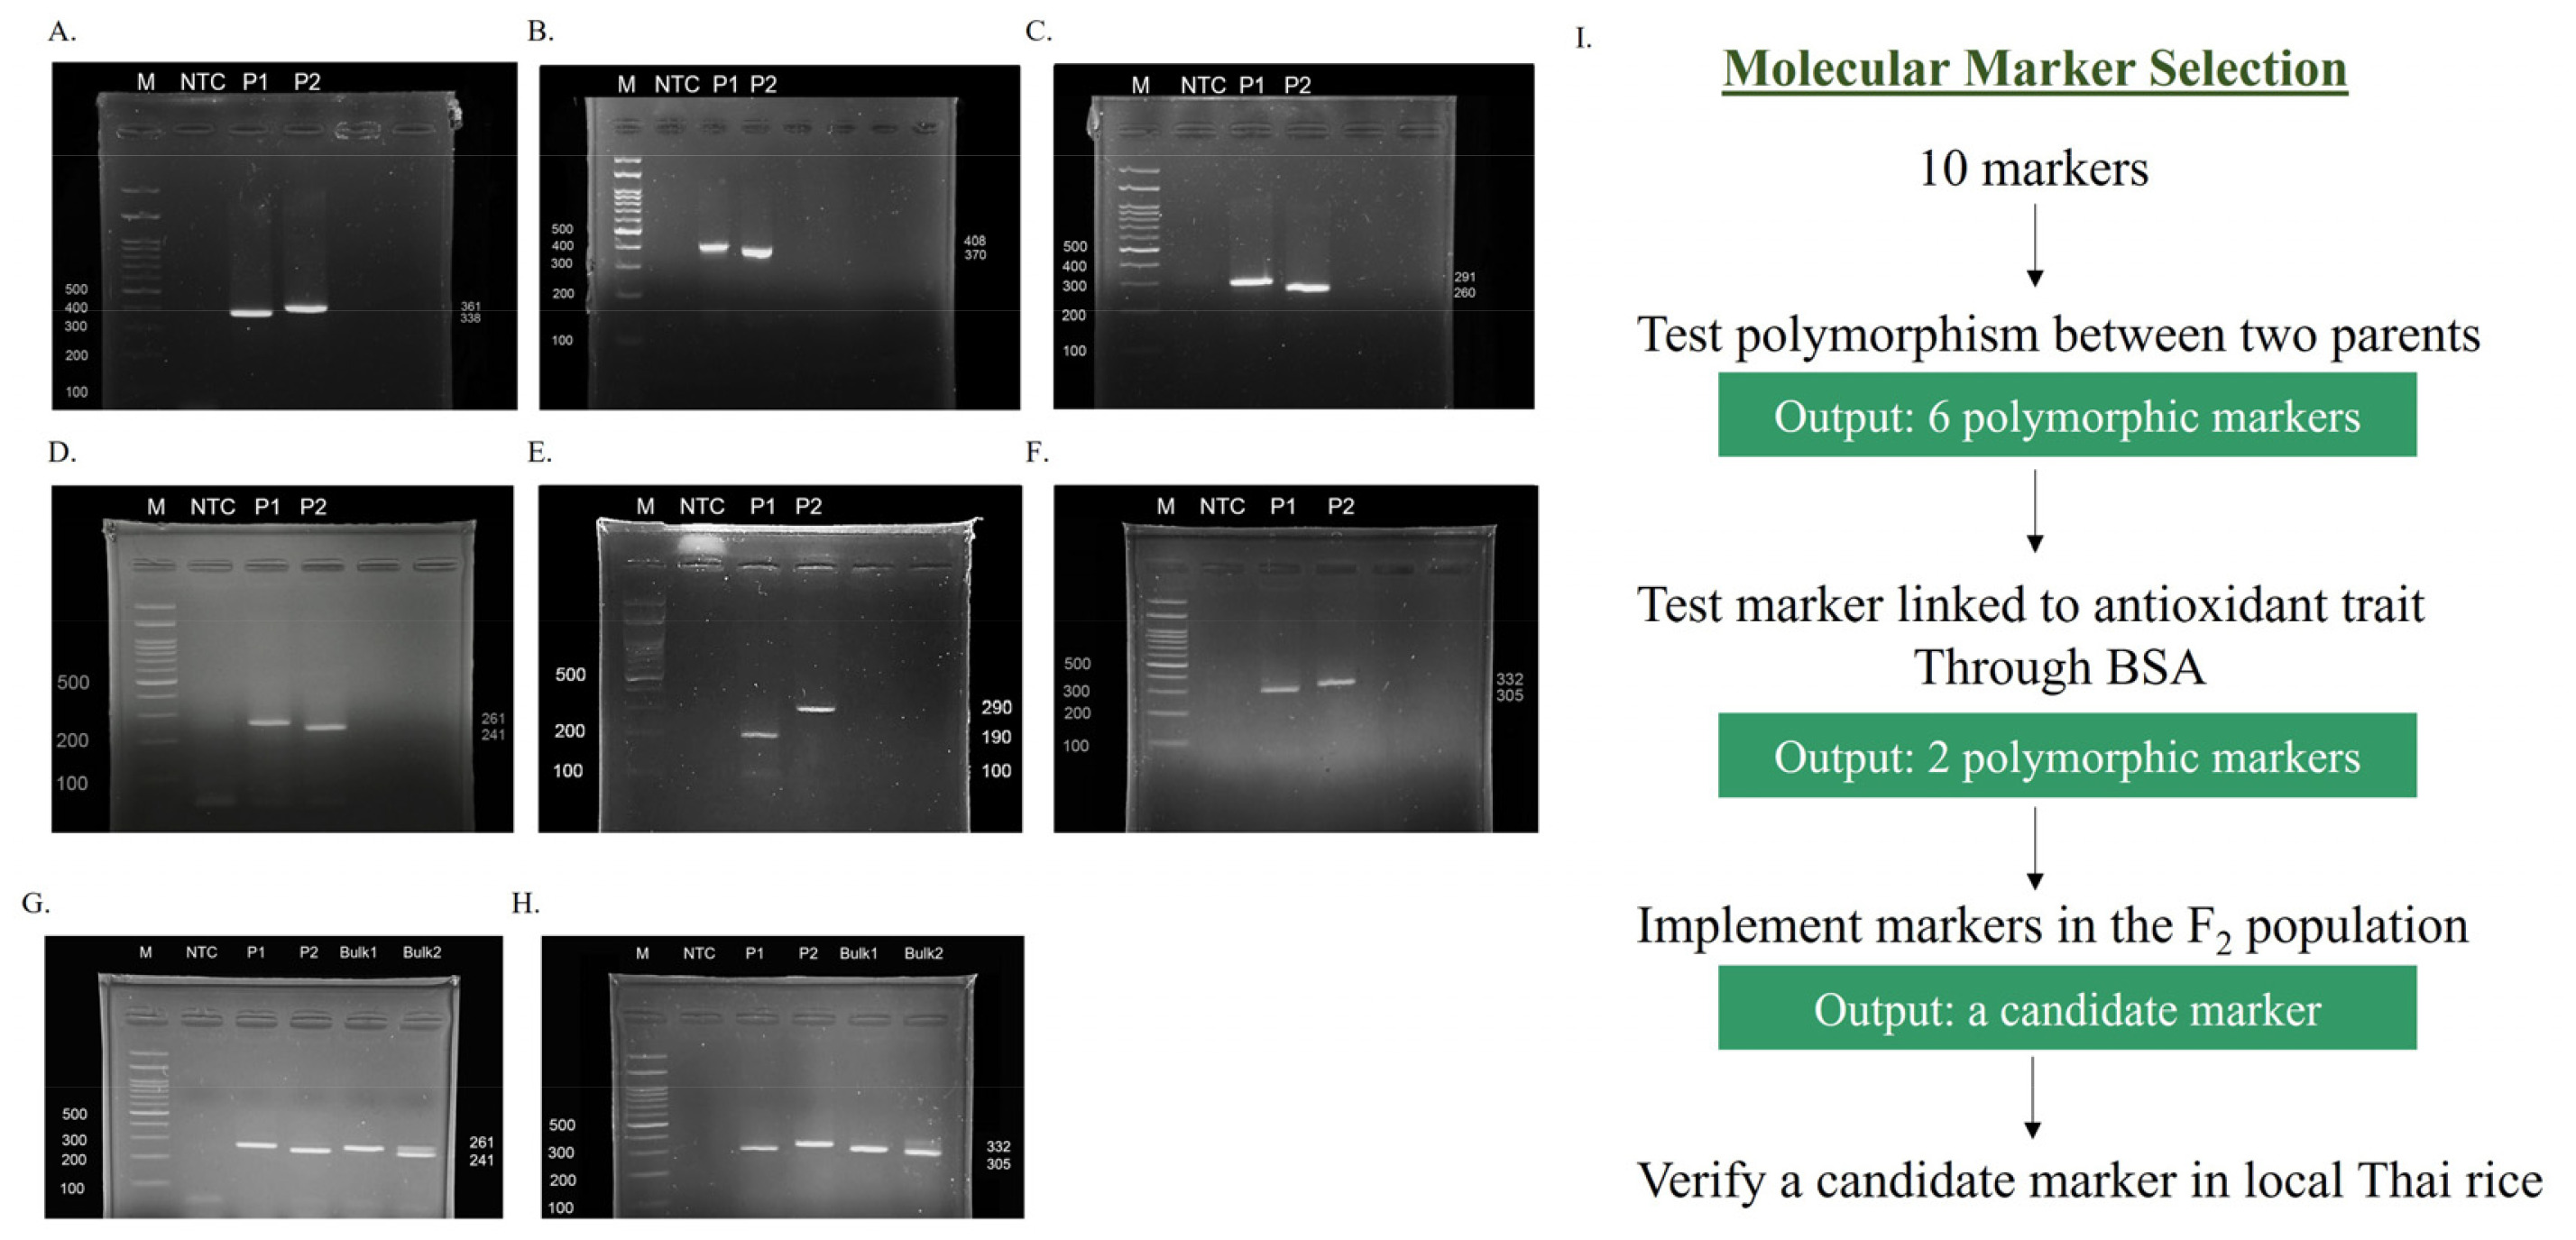
Because molecular markers are important tools for enhancing the efficiency of selecting complex traits, the validation of molecular markers is a prerequisite before their introduction into a breeding program. To validate the molecular markers associated with antioxidant traits, our marker selection criteria followed the scheme outlined in
Fig. 2I Initially, 10 molecular markers (
Table 1) associated with antioxidant traits in local Thai rice were investigated in parent cultivars to identify polymorphic markers. Of these, six markers exhibited polymorphism between P1 and P2 (
Figs. 2A~2F), including NOI (338 bp for P1 and 361 bp for P2), Dof zinc-1 (408 bp for P1 and 370 bp for P2), Dof zinc-2 (291 bp for P1 and 260 bp for P2),
OsRc (261 bp for P1 and 241 bp for P2), H8 (190 bp and 100 bp (a faded band) for P1 and 290 bp for P2), and In1-
Rc (305 bp for P1 and 332 bp for P2). Furthermore, to detect markers linked to antioxidant traits within the population, these six polymorphic markers were then validated through the BSA approach. Two DNA bulks were prepared on the basis of TPC, which exhibited strong positive correlations with other traits and the highest heritability and GA. The BSA results (
Figs. 2G,
2H) revealed that only two markers, namely
OsRc and In1-
Rc, displayed polymorphism between Bulk1 and Bulk2, suggesting their potential linkage to genomic regions controlling TPC in this population. For both markers, the PCR bands of Bulk1 from both markers were identical to the bands in P1 (261 bp for
OsRc and 305 bp for In1-
Rc), indicating the low antioxidant alleles. By contrast, Bulk2 featured two PCR bands that were identical to the bands in P1 and P2. This might have resulted from the use of a bulked sample of 50 individuals with high TPC, which would include both homozygous (P2-like) and heterozygous individuals. Conversely, the other four markers generated monomorphic bands in both DNA bulks, indicating their inability to distinguish the genetic background between high- and low-TPC samples. Thus, they were excluded from further selection.
The two polymorphic markers validated by BSA were applied to the segregating F2 population to test their selection efficiency. OsRc and In1-Rc were employed to genotype 454 F2 individuals. Concerning OsRc, 131 plants featured an identical allele size as P2 (241 bp), and 117 plants exhibited the same allele size as P1 (261 bp). The remaining 206 plants contained two alleles that were identical to their parental bands (AB genotype). The genotyping of F2 individuals using In1-Rc indicated that among 454 individuals, 18 individuals carried the same homozygous allele as P2 (332 bp), and 244 individuals featured the same homozygous allele as P1 (305 bp). The remaining 193 individuals had heterozygous alleles (AB genotype). These markers can be used to discriminate between homozygous and heterozygous plants, as both markers were expressed as co-dominant markers.
The relationships of the two candidate markers with antioxidant traits were analyzed via simple linear regression analysis. The results in
Table 5 revealed that
OsRc could mainly explain 52.2% (95% confidence interval [CI] = 45.9–58.5) of the total variation (R
2) of TPC (
p < 0.001) and 43.0% (95% CI = 36.2–49.8) of the variation of FRAP (
p < 0.001). This marker exhibited significant correlations with both traits (
r = 0.66–0.72,
p < 0.001). However, this marker accounted for only 16.6% (95% CI = 10.4–22.8) of the variation of TFC and exhibited a moderate correlation with TFC. Moreover,
OsRc could statistically predict the antioxidant traits using the equations of linear relationships (
Table 5). When the genotype of
OsRc contained one more homozygous allele from P2, TPC increased to 516.80 mg GAE/g of rice, FRAP increased to 570.28 mg TEAC/g of rice, and TFC slightly improved to 26.78 mg RE/g of rice. By contrast, In1-
Rc explained only 0.1% (95% CI = 0–0.7) of trait variations (
p > 0.05), suggesting extremely weak linkage to antioxidant traits, which might have resulted from its targeting of an intron region. This, this marker might not directly control gene function.
As
OsRc exhibited significant associations and correlations with antioxidant traits, this marker was prioritized in this study for further analysis. Meanwhile, In1-
Rc was not utilized in selection owing to its insignificant associations with antioxidant traits. To explore the global view of
Rc and antioxidant traits, the scatter matrix was generated on the basis of antioxidant traits, and the genotypes of
OsRc were flagged (
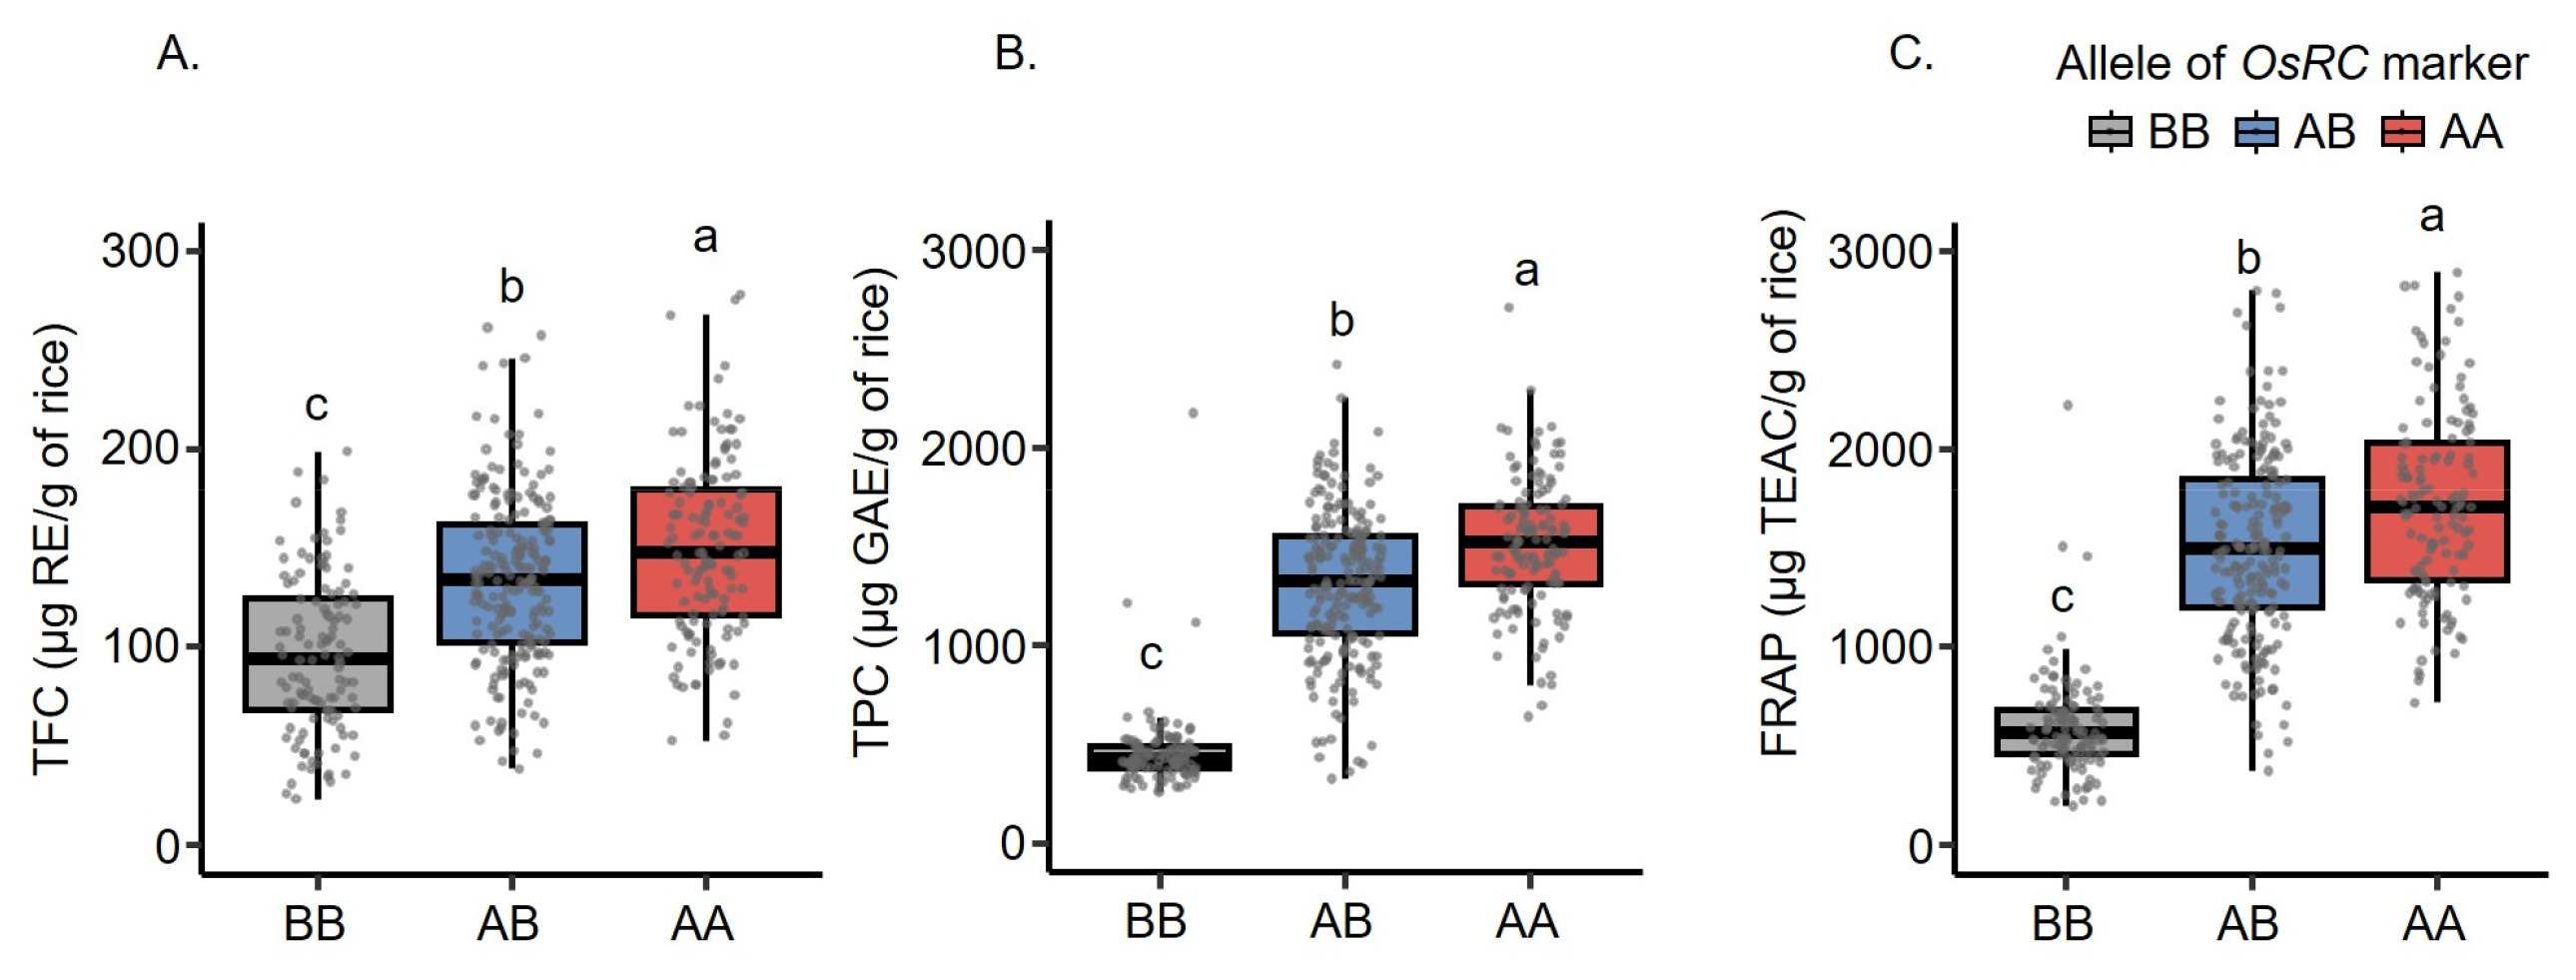
Fig. 3). The result revealed corresponding trends among TPC, FRAP, and marker genotypes. The AA and AB genotypes were densely accumulated in the range of higher TFC, TPC, and FRAP, whereas the BB genotype was mostly present in the range of lower trait values. The boxplots (
Fig. 4) confirmed that F
2 individuals carrying the AA genotype of
OsRc had significantly higher TFC, TPC, and FRAP than those carrying the AB and BB genotypes (
p < 0.05). Therefore, the selection of plants carrying the AA genotype of
OsRc potentially provided stronger antioxidant traits than the other genotypes.
To verify the novel marker for selecting high antioxidant traits,
OsRc was further confirmed in 21 Thai rice cultivars, including seven each from black, red, and white pericarp rice, which known for their different antioxidant levels, using PCR genotyping.
Anantasri (2024) described antioxidant traits (TFC, TPC, FRAP, ABTS, and DPPH) in these Thai rice cultivars. As presented in
Table 6, black and red pericarp cultivars mainly possessed high value for antioxidant traits, whereas white pericarp cultivars exhibited low vales.
By genotyping
OsRc in local Thai rice cultivars, it was determined that red pericarp cultivars with high antioxidant traits generated a band size of 241 bp, similarly as P2 (
Table 7). Meanwhile, black and white pericarp cultivars had an allele size of 261 bp, similarly as P1. Thus, the alleles of
OsRc could discriminate red pericarp rice from black and white pericarp rice. The P2 allele of
OsRc was associated with red pericarp and high antioxidant traits in red rice (
Tables 6,
7), whereas the P1 allele was found in both black and white rice, meaning it cannot distinguish them. Therefore, other markers should be used to help select high antioxidant traits in black and white rice. This result indicated that the P1 allele might be associated with low antioxidant traits in white rice, and it underlined the efficacy of
OsRc in selecting high antioxidant traits, specifically in red and white pericarp rice cultivars.
Discussion
The distribution of the F
2 population (
Fig. 1) demonstrated that TFC, TPC, and FRAP featured continuous distributions, indicating that they are polygenic traits influenced by QTLs. These results are consistent with those of previous studies (
Thaworn et al. 2022;
Thong et al. 2022), which also reported the quantitative distribution of several antioxidant traits, including TFC, TPC, ABTS, TAC, FRAP, and DPPH, in F
2 populations derived from the crosses of black and white rice. Remarkably, some F
2 individuals exhibited antioxidant traits (TFC, TPC, and FRAP) exceeding the mean values of the high antioxidant parent, suggesting transgressive segregation. This phenomenon, which results from the rearrangement of genes, represents an important resource for plant breeders (
Poehlman et al. 1995) to obtain segregating progenies that are superior to their parents concerning quantitative traits. Consequently, superior rice lines with enhanced antioxidant traits can be effectively selected from this F
2 population.
According to the results of correlation analysis (
Table 3), TPC was strongly correlated with FRAP. The results align with those of previous research that reported a strong correlation between TPC and antioxidant variables such as FRAP (
Goffman et al. 2004;
Sompong et al. 2011). Conversely, TFC only displayed moderate correlations with other antioxidant traits,
consistent with the findings of Tyagi et al. (2022). However, these results did not correspond with some studies (
Pramai et al. 2016;
Thaworn et al. 2022) that reported strong positive correlations among TFC, TPC, DPPH, FRAP, and ABTS, likely because of the genetic diversity of the rice cultivars under study. In the F
2 population, TPC might play a crucial role in the high antioxidant activities of FRAP, with TFC providing a more moderate effect on total antioxidant activity.
In this study, high GCV and PCV were found across TFC, TPC, and FRAP, indicating substantial genetic diversity within the F
2 population. The small difference between GCV and PCV suggests that genetic factors mainly influenced these antioxidant traits, highlighting the efficiency of selection across all traits, which is desirable in breeding programs (
Magar et al. 2021). High heritability (>80%) was recorded for all traits, confirming that antioxidant traits in this population are greatly heritable. Concurrently, TFC, TPC, and FRAP displayed high GA (66%–94%). GA explains the expected progress from the selection intensities in composite populations (
Poehlman et al. 1995) and refers to the improvement in the mean genotypic value of selected plants over the parental populations (
Lokeshkumar et al. 2018). The consideration of heritability together with GA represents a more robust selection strategy for predicting genetic gain than the use of heritability alone (
Lokeshkumar et al. 2018;
Poehlman et al. 1995). The consistent observation of high heritability coupled with high %GA across all traits strongly suggests that these antioxidant traits are primarily controlled by additive gene effects, implying that effective selection can lead to substantial and predictable improvements in subsequent generations. This indicates that even simple selection methods would be effective for improving these traits (
Lokeshkumar et al. 2018;
Magar et al. 2021). However, the improvement of rice lines with high antioxidant traits through conventional methods can be time-consuming and expensive, particularly in selecting desired progenies from large populations. To address this, MAS offers a significant advantage, as it can facilitate a breeding program for improving the antioxidant traits by allowing the direct selection of favorable plants based on their genotypes at early development stages.
In this study,
OsRc was validated as a highly effective tool for MAS of high antioxidant traits, specifically concerning TPC and FRAP, in red Thai rice.
OsRc exhibited strong predictive power, explaining 52.2% of the variation of TPC and 43% of the variation of FRAP (
p < 0.001). Previous studies developed and tested molecular markers linked to antioxidant traits in an F
2 population derived from a cross between P1 and “Kam Noi” (black rice). These studies also found similar results to our findings, revealing that markers were strongly associated with traits and explained 51.9% of the variation of DPPH antioxidant activity (
Thong et al. 2022) and 31.9% of the variation of anthocyanin (
Richinda et al. 2021). Additionally, these markers can be effectively utilized for MAS for high antioxidant traits in backcross breeding programs (
Richinda et al. 2021;
Thong et al. 2022). The significant association and strong predictive power of
OsRc could permit the efficient identification of promising genotypes, thereby facilitating breeding programs compared with traditional phenotyping methods.
OsRc was prioritized for selecting high antioxidants in terms of TPC and FRAP because of its direct linkage to the
Rc gene (
LOC_Os07g11020), which has consistently been associated with antioxidant traits in the local Thai rice population (
Purnama et al. 2025). The
Rc gene, encoding a bHLH transcription factor, is a key regulator of proanthocyanidin biosynthesis in red pericarp rice (
Furukawa et al. 2007;
Sweeney et al. 2006). Proanthocyanidins contribute to the high antioxidant capacity of red pericarp rice (
Oki et al. 2002). Our findings confirm that variation at the
Rc locus, as captured by
OsRc, is an important determinant of TPC and FRAP, underscoring its crucial role in enhancing the nutritional quality of rice.
Although
OsRc displayed strong efficiency in selecting high antioxidant traits in the F
2 population, its practical utility required verification across a diverse panel of local Thai rice with varied antioxidant properties. Genotyping 21 local Thai rice cultivars using
OsRc revealed its consistent ability to discriminate red pericarp cultivars, which carry the P2 allele (241 bp), from black and white pericarp cultivars, which possess the P1 allele (261 bp). Importantly, the P2 allele was consistently associated with high antioxidant traits in red pericarp rice (
Fig. 3,
Tables 6,
7), whereas the P1 allele was related to low antioxidant traits in white pericarp rice. These results were consistent with those of previous studies, indicating that white and black pericarp feature many nucleotide changes in the
Rc gene (
Lim et al. 2013), including a 14-bp deletion in exon 6, which disrupts gene function because of the introduction of a premature stop codon and explains the lack of pigmentation and proanthocyanidin synthesis in white pericarp rice (
Sweeney et al. 2007;
Sweeney et al. 2006).
However,
OsRc has a specific limitation; specifically, it could not effectively distinguish high antioxidant traits in black pericarp cultivars because of the distinct antioxidant biosynthetic pathways and different major compounds between black and red rice. Black rice accumulates substantial levels of anthocyanins and flavonoids (
Limtrakul et al. 2019), which mainly contribute to its high antioxidant activities (
Goffman et al. 2004), whereas red pericarp rice is plentiful in proanthocyanins (
Gunaratne et al. 2013;
Oki et al. 2002). Therefore,
OsRc is specific for high TPC and FRAP, which are likely mediated by proanthocyanidins in red rice but not by anthocyanins in black pericarp rice. This is consistent with the findings of previous studies on local Thai rice, which reported higher TPC and ABTS in red pericarp cultivars than in black pericarp cultivars (
Purnama et al. 2025;
Thaworn et al. 2021), further indicating that different antioxidant assays can reflect different genes involved in antioxidant regulation (
Purnama et al. 2025).
In the context of black pericarp rice,
Ra, encoding the anthocyanin regulatory bHLH transcription factor, has been linked to antioxidant traits in rice (
Purnama et al. 2025;
Shao et al. 2011). Furthermore,
OsTT8 (
LOC_Os04g47059.1), also known as
OsKala4 and
OsB2, encodes another bHLH transcription factor, and it is involved in anthocyanin biosynthesis, which is essential for the formation of purple–black pericarp in rice (
Kim et al. 2021;
Zheng et al. 2021).
OsTT8 is closely linked to
Ra (approximately 40 kb), and these genes are located within the same linkage disequilibrium block (
Purnama et al. 2025). Whereas
OsTT8 was designed to target this gene region and it displayed a significant correlation with the black rice cultivar (possessing the Hom2 allele), it could not distinguish between the white and red rice parents used in this study, as it carried the Hom1 allele (
Purnama et al. 2025). These findings further highlight that different genetic mechanisms, involving genes such as
Ra and
OsTT8, govern the antioxidant profile of black rice. This explains why
OsRc is not effective for segregating these phenotypes in black rice cultivars.
Whereas previous studies, including various GWAS-based analyses, identified genetic loci associated with antioxidant traits in rice (
Jin et al. 2009;
Purnama et al. 2025;
Rana et al. 2022;
Shao et al. 2014a;
Shao et al. 2011;
Xu et al. 2016;
Xu et al. 2017), our research provides a novel and significant contribution through the robust validation of
OsRc in a Thai F
2 population and in local cultivars. This represents a practical, ready-to-use tool for breeders aiming to improve antioxidant traits in red rice lines. Previous studies reported another insertion–deletion (indel) marker linked to
Rc, such as the indel marker, which is specific to a 14-bp deletion in exon 6, and this marker can effectively identify red pericarp individuals in F
2 populations of Thai red and white rice (
Dela Cruz et al. 2018). However, these studies mainly focused on pericarp color, and they did not establish a direct association between the
Rc-linked marker and antioxidant traits in red rice. Our study fills this gap by demonstrating a strong and significant association of
OsRc with pericarp color and high TPC and FRAP. This provides a more efficient genetic tool for selecting for improved antioxidant properties in red rice lines.
For broader deployment of
OsRc in MAS, it is important to consider additional factors such as linkage disequilibrium, pleiotropic effects, and marker–environment interaction. The results suggested that
OsRc might be linked to the
Rc locus rather than being the direct functional variant. This linkage needs to be considered across a diverse rice panel with various genetic backgrounds. Additionally,
Rc displayed pleiotropic effects for both red pericarp color (
Dong et al. 2008;
Furukawa et al. 2007;
Rana et al. 2022;
Sweeney et al. 2006) and antioxidant traits (TPC, PA, FRAP, ABTS, DPPH;
Jin et al. 2009;
Shao et al. 2014a;
Xu et al. 2016). Although this marker has advantages in selecting both traits simultaneously, breeders should thoroughly consider additional or complementary markers when targeting high antioxidant capacities in non-red pericarp varieties. Although
OsRc was strongly validated in this study, the predictive power of MAS markers can be influenced by environmental factors. Future research should evaluate the stability and efficacy of
OsRc under diverse environmental conditions to ensure its precision and consistency. Consequently, our findings suggested that the validated marker
OsRc is applicable to practical MAS tools in red rice breeding programs. Its efficiency in selecting high antioxidant genotypes will accelerate the development and deployment of red rice cultivars with desirable health benefits for consumers.
Conclusion
This study demonstrated that OsRc is an effective and reliable tool for selecting high antioxidant trait rice lines. The AA genotype of OsRc is linked to favorable TPC and FRAP levels. Therefore, OsRc represents a powerful tool for MAS in breeding programs aiming to increase antioxidant traits in rice lines. Future research should focus on integrating this marker into large-scale breeding programs and evaluating its stability across several environmental conditions.
Supplementary data
Table S1. Forward and reverse primers of molecular markers used in this study.
Acknowledgments
This study was supported by the Department of Botany, Faculty of Science, Chulalongkorn University, Thailand. Furthermore, the authors are pleased to thank the Center of Excellence in Environment and Plant Physiology and the School of Agricultural Resources, Chulalongkorn University, Thailand, for supplying the chemicals, equipment, and reagents. The authors are also pleased to thank the Pathum Thani Rice Research Center, Thailand, for their support in providing the rice seeds and experiment field for this research. The scholarship from the Graduate School, Chulalongkorn University, to commemorate the 72nd anniversary of His Majesty King Bhumibol Adulyadej, is gratefully acknowledged.
Fig. 1The distribution of antioxidant traits and pericarp color in the F2 population. (A) Distribution of TFC. (B) Distribution of TPC. (C) Distribution of FRAP. (D) Examples and a pie graph presenting the number of F2 individuals with red and white pericarp.
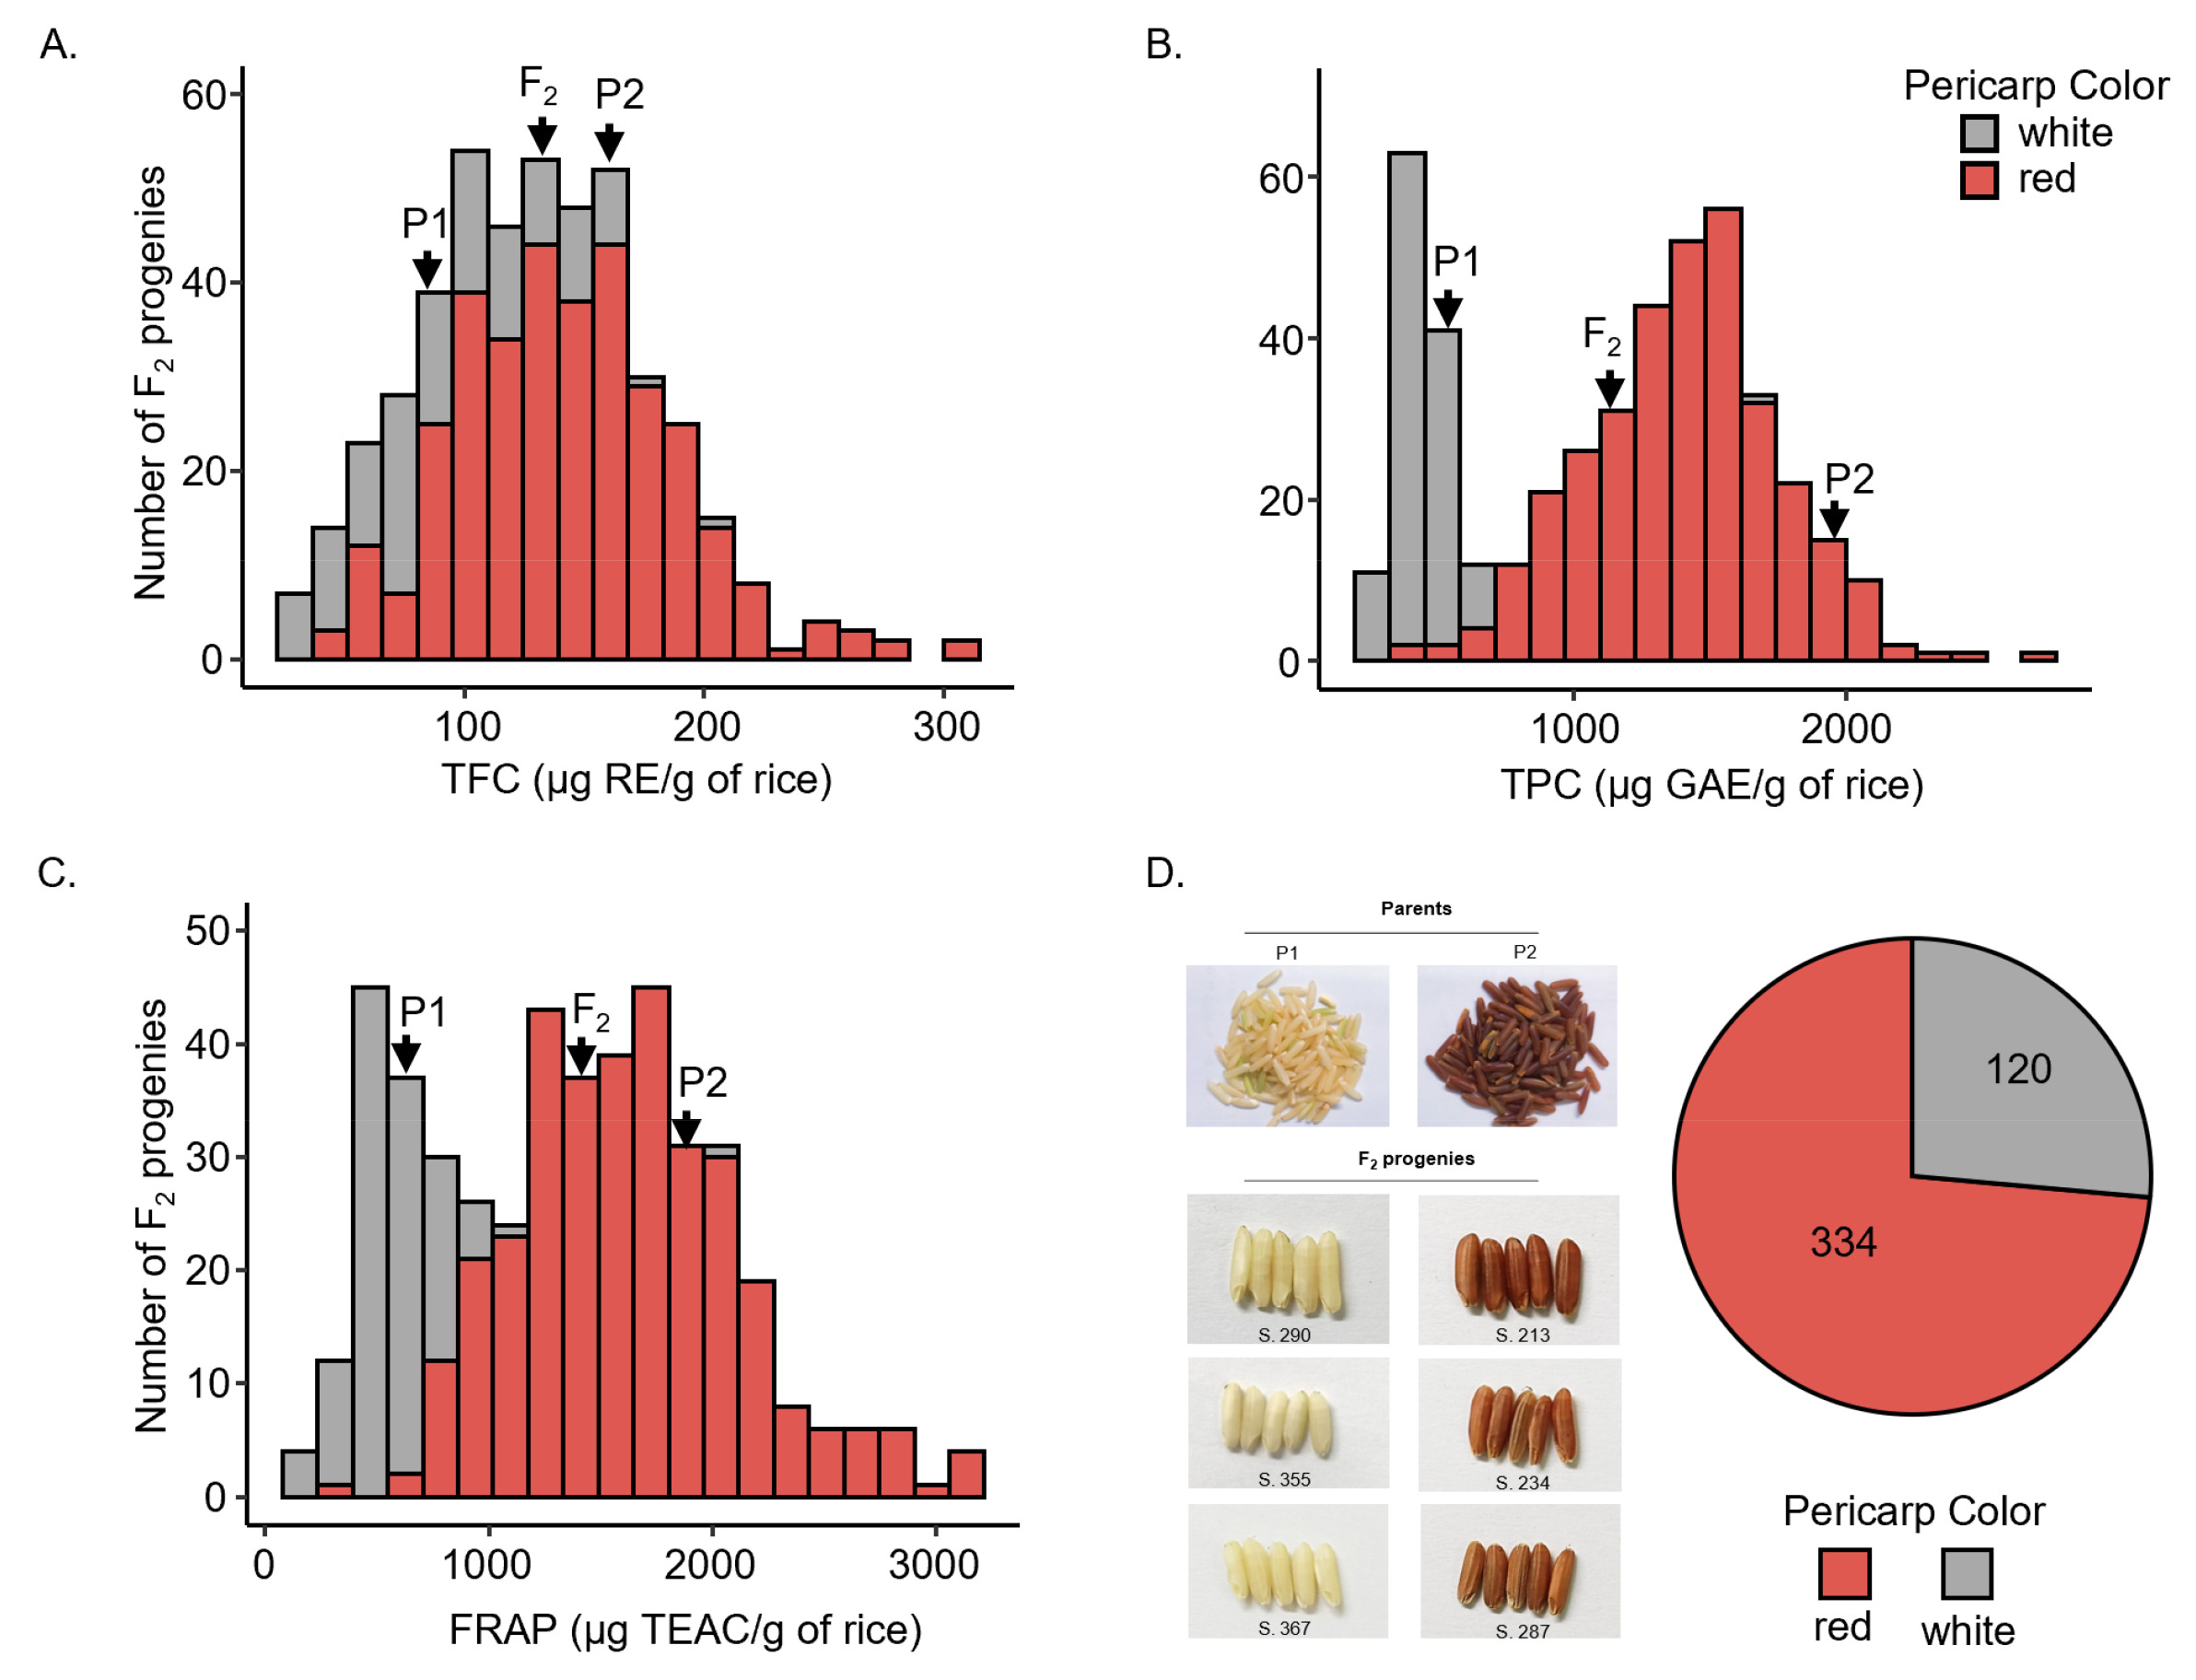
Fig. 2Molecular marker selection in the parent cultivars and BSA analysis. (A–F) Six polymorphic markers in the parent cultivars. (A) NOI. (B) Dof zinc-1. (C) Dof zinc-2. (D) OsRc. (E) H8. (F) In1-Rc. (G–H) Two polymorphic markers validated by BSA. (G) OsRc. (H) In1-Rc. M represents the 100-bp DNA ladder. NTC refers to the no template control. P1 and P2 are “Pathum Thani 1” and “Hawm Mali Daeng,” respectively. Bulk1 is the DNA pool of the 50 individuals with the lowest TPC, and Bulk2 is the DNA pool of the 50 individuals with the highest TPC.

Fig. 3Scatter matrix of antioxidant traits based on the genotype of OsRc. Red, blue, and grey points represent the AA, AB, and BB genotypes, respectively. Red, blue, and grey curves depict the densities of the AA, AB, and BB genotypes, respectively.
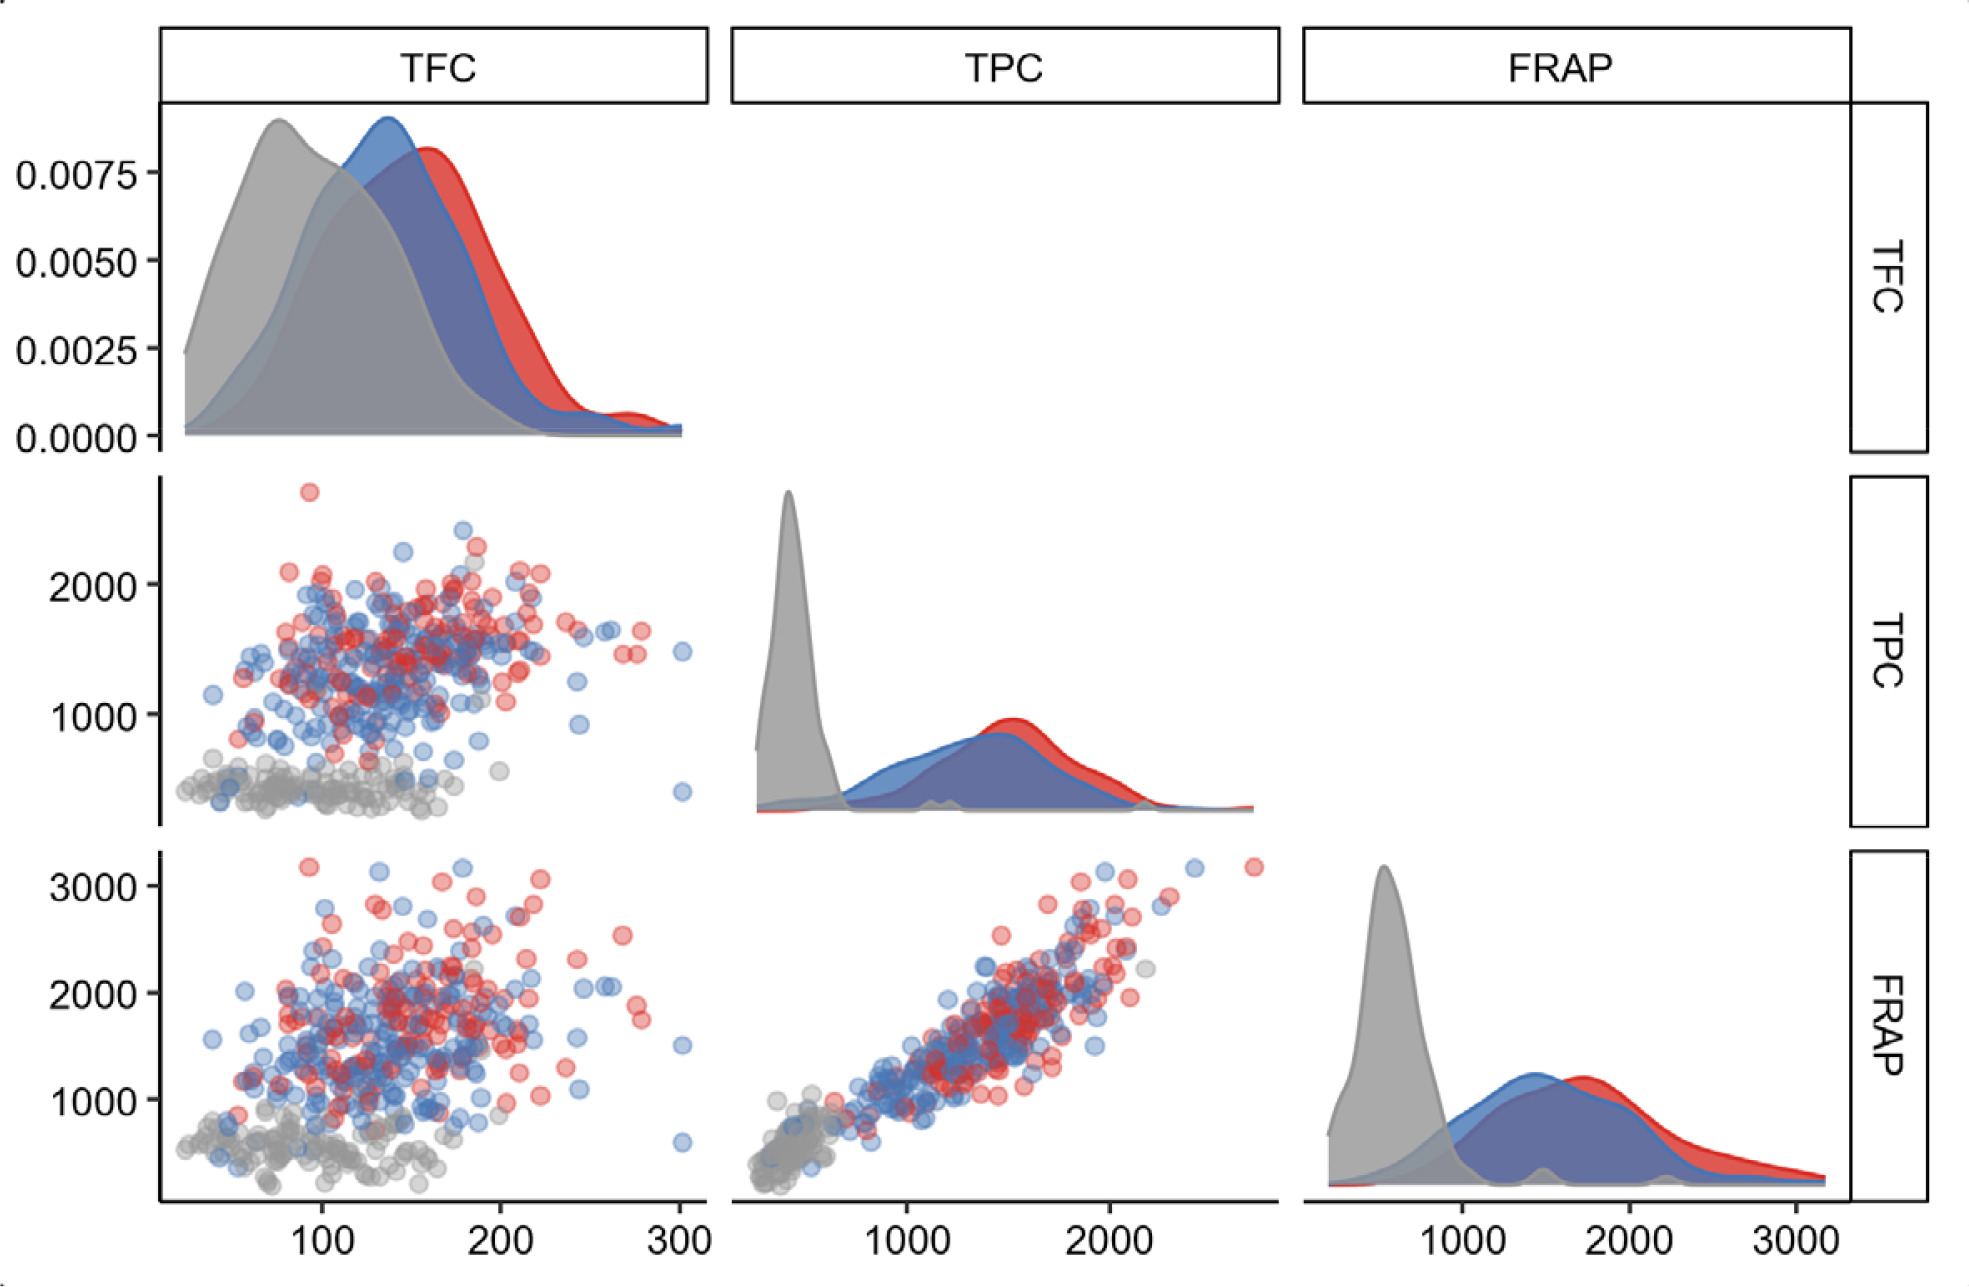
Fig. 4Boxplot of three antioxidant traits based on the genotypes of OsRc. (A) TFC. (B) TPC. (C) FRAP. In the boxplots, the median for each genotype is denoted by the black horizontal line, and the whiskers represent the range of data. The different lowercase letters denote significant differences of the means determined by ANOVA followed by DMRT (p < 0.05). AB represents a heterozygous allele containing two bands similarly as their parents. BB is a homozygous allele that is identical to P1. AA is a homozygous allele that is identical to P2.

Table 1Molecular markers used in this study.
Table 2Phenotypic performance of antioxidant traits in parents and the F2 population.
Table 2
|
Trait |
P1 |
P2 |
|
F2 population |
|
|
|
|
Mean ± SDz
|
Mean ± SD |
Range |
Skewness |
Kurtosis |
|
TFC (mg RE/g of rice) |
84.19 ± 47.54c
|
155.90 ± 69.07a
|
|
129.56 ± 48.59b
|
23.08–301.28 |
0.38 |
0.33 |
|
TPC (mg GAE/g of rice) |
516.88 ± 36.89c
|
1925.71 ± 167.45a
|
|
1148.92 ± 528.54b
|
258.33–2710.70 |
−0.11 |
−1.01 |
|
FRAP (mg TEAC/g of rice) |
625.05 ± 55.82c
|
1811.78 ± 263.63a
|
|
1351.77 ± 642.59b
|
197.05–3176.16 |
0.29 |
−0.48 |
Table 3Correlation analysis among TFC, TPC, and FRAP in the F2 population.
Table 3
|
Trait |
TFC |
TPC |
FRAP |
|
TFC |
1 |
0.48**z
|
0.45** |
|
TPC |
|
1 |
0.93** |
|
FRAP |
|
|
1 |
Table 4Genetic components for TPC and FRAP in the segregating F2 population.
Table 4
|
Trait |
GCV (%) |
PCV (%) |
PCV–GCV |
H2 (%) |
%GA |
|
TFC |
35.69 |
39.24 |
3.56 |
82.70 |
66.95 |
|
TPC |
45.79 |
46.19 |
0.40 |
98.26 |
93.63 |
|
FRAP |
46.94 |
48.13 |
1.19 |
95.13 |
94.45 |
Table 5Simple linear regression and correlation analysis among significant markers and antioxidant traits.
Table 5
|
Marker |
Trait |
R2 (%)z
|
95% CIy for R2
|
rx
|
Equation of linear relationship
(y = α + βx) |
p
|
|
|
LCL (%) |
UCL (%) |
|
OsRc (x1)w
|
TFC (y1)v
|
16.6 |
10.4 |
22.8 |
0.41*** |
y1 = 101.95 + 26.78x1
|
<0.001 |
|
TPC (y2) |
52.2 |
45.9 |
58.5 |
0.72*** |
y2 = 616.19 + 516.80x1
|
<0.001 |
|
FRAP (y3) |
43.0 |
36.2 |
49.8 |
0.66*** |
y3 = 763.91 + 570.28x1
|
<0.001 |
|
In1-Rc (x2) |
TFC (y1) |
0.1 |
0 |
0.7 |
−0.03 |
y1 = 130.91 −2.70x2
|
>0.05 |
|
TPC (y2) |
0.1 |
0 |
0.7 |
0.03 |
y2 = 1134.71 + 28.30x2
|
>0.05 |
|
FRAP (y3) |
0.1 |
0 |
0.7 |
0.03 |
y3 = 1332.84 + 37.71x2
|
>0.05 |
Table 6Antioxidant traits in 21 local Thai rice cultivars.
Table 6
|
Traits |
Mean ± SDz
|
|
|
Black pericarp |
Red pericarp |
White pericarp |
|
TFC (mg GAE/100 g of rice)y
|
1196.79 ± 147.93a
|
1063.17 ± 203.88a
|
321.91 ± 101.55b
|
|
TPC (mg GAE/100 g of rice) |
554.54 ± 126.61a
|
580.57 ± 82.67a
|
110.28 ± 40.51b
|
|
FRAP (mg TEAC/100 g of rice) |
16563.87 ± 8176.53a
|
12653.01 ± 5657.57a
|
3842.97 ± 437.94b
|
|
ABTS (mM TEAC/100 g of rice) |
64.52 ± 23.12b
|
80.76 ± 7.97a
|
8.66 ± 2.64c
|
|
DPPH (mg TEAC/100 g of rice) |
36.35 ± 16.15a
|
21.05 ± 7.01b
|
5.11 ± 1.28c
|
Table 7Verification of the novel marker in Thai rice cultivars and the allele size of OsRc.
Table 7
|
Cultivar |
Pericarp color |
Antioxidant level |
Allele size of OsRcz
|
|
|
241 bp (P2 allele) |
261 bp (P1 allele) |
|
Mali Dam |
Black |
High |
0 |
1 |
|
Khao’ Niaw Dam Mor |
Black |
High |
0 |
1 |
|
Khao’ Niaw Dam 4 |
Black |
High |
0 |
1 |
|
Gam Meuang Nan |
Black |
High |
0 |
1 |
|
Khao’ Gam |
Black |
High |
0 |
1 |
|
Riceberry |
Black |
High |
0 |
1 |
|
Niaw Dam Rai |
Black |
High |
0 |
1 |
|
|
Mali Daeng |
Red |
High |
1 |
0 |
|
Mali Daeng Bow |
Red |
High |
1 |
0 |
|
Mali Daeng San Nak |
Red |
High |
1 |
0 |
|
Mali Daeng Yao Nak |
Red |
High |
1 |
0 |
|
Hawm Mali Daeng |
Red |
High |
1 |
0 |
|
Loy Ha Ruang |
Red |
High |
1 |
0 |
|
RD69 |
Red |
High |
1 |
0 |
|
|
Tawng Kam |
White |
Low |
0 |
1 |
|
Khao’ Prae |
White |
Low |
0 |
1 |
|
Supanburi 1 |
White |
Low |
1 |
1 |
|
Khao Tah Haeng 17 |
White |
Low |
0 |
1 |
|
Khao Gaew |
White |
Low |
0 |
1 |
|
Nahng Gerd |
White |
Low |
0 |
1 |
|
Nahng Dam |
White |
Low |
0 |
1 |
|
|
Pathum Thani 1 (P1) |
White |
Low |
0 |
1 |
|
Hawm Mali Daeng (P2) |
Red |
High |
1 |
0 |
References
- Anantasri P. 2024. "Genetic markers development for antioxidant trait in Thai rice (Oryza sativa L. ) via genome-wide association analysis." Master's thesis. Department of Botany, FoS., Chulalongkorn University..
- Arjinajarn P, Chueakula N, Pongchaidecha A, Jaikumkao K, Chatsudthipong V, Mahatheeranont S, et al. 2017. Anthocyanin-rich Riceberry bran extract attenuates gentamicin-induced hepatotoxicity by reducing oxidative stress, inflammation and apoptosis in rats. Biomed. Pharmacother. 92: 412-420.
- Barbier FF, Chabikwa TG, Ahsan MU, Cook SE, Powell R, Tanurdzic M, et al. 2019. A phenol/chloroform-free method to extract nucleic acids from recalcitrant, woody tropical species for gene expression and sequencing. Plant Methods. 15(1): 62
- Butsat S, Siriamornpun S. 2010. Antioxidant capacities and phenolic compounds of the husk, bran and endosperm of Thai rice. Food Chem. 119(2): 606-613.
- Callcott ET, Blanchard CL, Snell P, Santhakumar AB. 2019. The anti-inflammatory and antioxidant effects of acute consumption of pigmented rice in humans. Food Funct. 10(12): 8230-8239.
- Callcott ET, Thompson K, Oli P, Blanchard CL, Santhakumar AB. 2018. Coloured rice-derived polyphenols reduce lipid peroxidation and pro-inflammatory cytokines ex vivo. Food Funct. 9(10): 5169-5175.
- Chaipoot S, Punfa W, Ounjaijean S, Phongphisutthinant R, Kulprachakarn K, Parklak W, et al. 2023. Antioxidant, anti-diabetic, anti-obesity, and antihypertensive properties of protein hydrolysate and peptide fractions from black sesame cake. Molecules. 28(1): 211
- Chen PN, Kuo WH, Chiang CL, Chiou HL, Hsieh YS, Chu SC. 2006. Black rice anthocyanins inhibit cancer cells invasion via repressions of MMPs and u-PA expression. Chem. Biol. Interact. 163(3): 218-229.
- Chen X, Tao Y, Ali A, Zhuang Z, Guo D, Guo Q, et al. 2019. Transcriptome and proteome profiling of different colored rice reveals physiological dynamics involved in the flavonoid pathway. Int. J. Mol. Sci. 20(10): 2463
- Collard BCY, Mackill DJ. 2008. Marker-assisted selection: an approach for precision plant breeding in the twenty-first century. Philos. Trans. R. Soc. B, Biol. Sci. 363(1491): 557-572.
- Dela Cruz L, Pongjaroenkit S, Sakulsingharoj C, Sangtong V. 2018. Evaluation of Rc and development of Rd markers of white pericarp RD49 and red pericarp Red Hawm Thai rice varieties. Khon Kaen Agr. J. 46(5): 1009-1022.
- Dong Y, Xu J, Xiao K, Zhang Y, Zhang J, Luo L, et al. 2008. Genomic regions associated with the degree of red coloration in pericarp of rice (Oryza sativa L.). J. Cereal Sci. 48(2): 556-560.
- Dudonné S, Vitrac X, Coutière P, Woillez M, Mérillon JM. 2009. Comparative study of antioxidant properties and total phenolic content of 30 plant extracts of industrial interest using DPPH, ABTS, FRAP, SOD, and ORAC assays. J. Agric. Food Chem. 57(5): 1768-1774.
- FAOSTAT 2025.2025. Statistics of the food and agriculture organisation of the united nations. Vol. 2025.
- Furukawa T, Maekawa M, Oki T, Suda I, Iida S, Shimada H, et al. 2007. The Rc and Rd genes are involved in proanthocyanidin synthesis in rice pericarp. Plant J. 49(1): 91-102.
- Goffman FD, Bergman CJ. 2004. Rice kernel phenolic content and its relationship with antiradical efficiency. J. Sci. Food Agric. 84(10): 1235-1240.
- Gunaratne A, Wu K, Li D, Bentota A, Corke H, Cai Y-Z. 2013. Antioxidant activity and nutritional quality of traditional red-grained rice varieties containing proanthocyanidins. Food Chem. 138(2): 1153-1161.
- Hansakul P, Srisawat U, Itharat A, Lerdvuthisopon N. 2011. Phenolic and flavonoid contents of Thai rice extracts and their correlation with antioxidant activities using chemical and cell assays. J. Med. Assoc. Thai. 94(7): S122-S130.
- Huang D, Ou B, Prior RL. 2005. The chemistry behind antioxidant capacity assays. J. Agric. Food. Chem. 53(6): 1841-1856.
- IBM Corp.2022. IBM SPSS statistics for macOS,. pp. IBM SPSS Statistics for macOS. IBM. Corp.. New York.
- Jin L, Xiao P, Lu Y, Shao Y, Shen Y, Bao J. 2009. Quantitative trait loci for brown rice color, phenolics, flavonoid contents, and antioxidant capacity in rice grain. Cereal Chem. 86(6): 609-615.
- Johnson HW, Robinson HF, Comstock RE. 1955. Estimates of genetic and environmental variability in soybeans. Agron. J. 47(7): 314-318.
- Karim A, Azlan A, A I, Hashim P, Abdullah N. 2014. Antioxidant properties of cocoa pods and shells. MCJ. 8: 49-56.
- Kate-ngam S. 2014. Molecular Plant Breeding. Ubon Ratchathani: Ubon Ratchathani University. (in Thai)..
- Kim D-H, Yang J, Ha S-H, Kim JK, Lee J-Y, Lim S-H. 2021. An OsKala3, R2R3 MYB TF, is a common key player for black rice pericarp as main partner of an OsKala4, bHLH TF. Front. Plant Sci. 12: 765049
- Lim S, Ha SH. 2013. Marker development for the identification of rice seed color. Plant Biotechnol. Rep. 7: 391-398.
- Limtrakul P, Semmarath W, Mapoung S. Venketeshwer R, Dennis M, Leticia R, 2019. Anthocyanins and proanthocyanidins in natural pigmented rice and their bioactivities. editors. in Phytochemicals in Human Health. IntechOpen. London: pp. 1-24.
- Lokeshkumar LBM, Patil BR. 2018. Estimation of genetic variability parameters in F2 population of Gossypium hirsutum L. for yield, yield attributes and fiber quality traits. Int. J. Curr. Microbiol. Appl. Sci. 7: 360-367.
- Magar BT, Acharya S, Gyawali B, Timilsena K, Upadhayaya J, Shrestha J. 2021. Genetic variability and trait association in maize (Zea mays L.) varieties for growth and yield traits. Heliyon. 7(9): e07939
- Michelmore RW, Paran I, Kesseli RV. 1991. Identification of markers linked to disease-resistance genes by bulked segregant analysis: a rapid method to detect markers in specific genomic regions by using segregating populations. Proc. Natl. Acad. Sci. 88(21): 9828
- Miliauskas G, Venskutonis PR, van Beek TA. 2004. Screening of radical scavenging activity of some medicinal and aromatic plant extracts. Food Chem. 85(2): 231-237.
- Nagy ZT. 2010. A hands-on overview of tissue preservation methods for molecular genetic analyses. Org. Divers. Evol. 10(1): 91-105.
- Oki T, Masuda M, Kobayashi M, Nishiba Y, Furuta S, Suda I, et al. 2002. Polymeric procyanidins as radical-scavenging components in red-hulled rice. J. Agric. Food. Chem. 50(26): 7524-7529.
- Pintha K, Yodkeeree S, Limtrakul P. 2015. Proanthocyanidin in red rice inhibits MDA-MB-231 breast cancer cell invasion via the expression control of invasive proteins. Biol. Pharm. Bull. 38(4): 571-81.
- Pintha K, Yodkeeree S, Pitchakarn P, Limtrakul P. 2014. Anti-invasive activity against cancer cells of phytochemicals in red jasmine rice (Oryza sativa L.). Asian Pac. J. Cancer Prev. 15(11): 4601-7.
- Poehlman JM, Sleper DA. 1995. Breeding Field Crops. Iowa: Iowa State University Press..
- Pramai P, Jiamyangyuen S. 2016. Chemometric classification of pigmented rice varieties based on antioxidative properties in relation to color. Songklanakarin J. Sci. Technol. 38: 463-472.
- Prior RL, Wu X, Schaich K. 2005. Standardized methods for the determination of antioxidant capacity and phenolics in foods and dietary supplements. J. Agric. Food. Chem. 53(10): 4290-302.
- Purnama PR, Suwanchaikasem P, Junbuathong S, Chotechuen S, Moung-Ngam P, Kasettranan W, et al. 2025. Uncovering genetic determinants of antioxidant properties in Thai landrace rice through genome-wide association analysis. Sci. Rep. 15(1): 1443
- Rana N, Kumawat S, Singh U, Singh V, Deshmukh R, Sharma T, et al. 2022. Identification of genomic loci governing pericarp colour through GWAS in rice (Oryza sativa L.). Indian J. Genet. Plant Breed. 82: 1-6.
- Richinda A, Sangtong V, Pongjaroenkit S, Khemkladngoen N, Roongjang S, Lanumteang K, et al. 2021. DNA markers related to anthocyanin contents and pericarp color in F2 progenies of the cross between Pathumthani 1 and Kham Noi. Khon Kaen Agr. J. 49(5): 1301-1312. (in Thai).
- Robinson HF, Comstock RE, Harvey PH. 1949. Estimates of heritability and the degree of dominance in corn. Agron. J. 41(8): 353-359.
- Shabir G, Aslam K, Khan AR, Shahid M, Manzoor H, Noreen S, et al. 2017. Rice molecular markers and genetic mapping: current status and prospects. J. Integr. Agric. 16(9): 1879-1891.
- Shao Y, Tang F, Huang Y, Xu F, Chen Y, Tong C, et al. 2014a. Analysis of genotype×environment interactions for polyphenols and antioxidant capacity of rice by association mapping. J. Agric. Food. Chem. 62(23): 5361-5368.
- Shao Y, Xu F, Sun X, Bao J, Beta T. 2014b. Identification and quantification of phenolic acids and anthocyanins as antioxidants in bran, embryo and endosperm of white, red and black rice kernels (Oryza sativa L.). J. Cereal Sci. 59(2): 211-218.
- Shao YF, Jin L, Zhang G, Lu Y, Shen Y, Bao JS. 2011. Association mapping of grain color, phenolic content, flavonoid content and antioxidant capacity in dehulled rice. Theor. Appl. Genet. 122: 1005-1016.
- Shen Y, Jin L, Xiao P, Lu Y, Bao JS. 2009. Total phenolics, flavonoids, antioxidant capacity in rice grain and their relations to grain color, size, and weight. J. Cereal Sci. 49: 106-111.
- Singh RK, Chaudhary BD. 1985. Biometrical methods in quantitative genetics analysis. New Delhi: Kalyani Publishers..
- Sivasubramanian S, Menon M. 1973. Heterosis and inbreeding depression in rice. Madras Agric. J. 60: 1139-1149.
- Sompong R, Siebenhandl-Ehn S, Linsberger-Martin G, Berghofer E. 2011. Physicochemical and antioxidative properties of red and black rice varieties from Thailand, China and Sri Lanka. Food Chem. 124(1): 132-140.
- Somsong P, Santivarangkna C, Tiyayon P, Hsieh CM, Srichamnong W. 2020. Assessing polyphenol components and antioxidant activity during fermented Assam tea ball processing. Sustainability. 12(14): 5853
- Sowcharoensuk C. 2024. Industry outlook 2024-2026: rice industry. Vol. 2025. Krungsri Research.
- Sreewongchai T, Rattanapol P, Vichukit V. 2014. Alternate phenotype-genotype selection method for developing photoperiod insensitive, good cooking quality and potential high- yielding rice lines. Agr. Nat. Resour. 48: 851-859.
- Swapnil , Kumari P, Jenny E, Krishna P. Ashok KJ, Ujjwal K, 2019. Marker assisted selection a new tools of plant breeding. editors. Pp. 189-198 in Recent Advances in Chemical Sciences and Biotechnology. New Delhi Publishers. New Delhi.
- Sweeney MT, Thomson MJ, Cho YG, Park YJ, Williamson SH, Bustamante CD, et al. 2007. Global ddissemination of a single mutation conferring white pericarp in rice. PLoS Genet. 3(8): e133
- Sweeney MT, Thomson MJ, Pfeil BE, McCouch S. 2006. Caught red-handed: Rc encodes a basic helix-loop-helix protein conditioning red pericarp in rice. Plant Cell. 18(2): 283-294.
- Thaworn S. 2020. "Quantitative trait loci analysis for antioxidant traits in rice Oryza sativa L.". Doctoral dissertation Biotechnology, Faculty of Science, Chulalongkorn University.
- Thaworn S, Chadchawan S, Paliyavuth C, Kasettranan W. 2021. Clustering of white, red and purple rice cultivars according to their total phenolic content, total flavonoid content and antioxidant capacity in their grains. Agr. Nat. Resour. 55(1): 89-97.
- Thaworn S, Paliyavuth C, Kasettranan W. 2022. Inheritance of antioxidant traits of the brown rice in F2 population from the cross of "RD41"×"Riceberry". Khon Kaen Agr. J. 50(4): 1131-1142. (in Thai).
- Thong T, Richinda A, Sangtong V, Pongjaroenkit S, Lanumteang K, Sakulsingharoj C. 2022. SSR markers linked to genes related to antioxidant activity, anthocyanin content and pericarp color in F2 progenies of cross between Pathum Thani 1 and Kham Noi. Khon Kaen Agr. J. 50(4): 1112-1130. (in Thai).
- Tyagi A, Lim MJ, Kim NH, Barathikannan K, Vijayalakshmi S, Elahi F, et al. 2022. Quantification of amino acids, phenolic compounds profiling from nine rice varieties and their antioxidant potential. Antioxid. 11(5): 839
- Walter M, Marchesan E, Massoni PFS, da Silva LP, Sartori GMS, Ferreira RB. 2013. Antioxidant properties of rice grains with light brown, red and black pericarp colors and the effect of processing. Food Res. Int. 50(2): 698-703.
- Wickham H. 2016. ggplot2: elegant Graphics for Data Analysis. Springer-Verlag. New York, US:
- Xu F, Bao J, Kim TS, Park YJ. 2016. Genome-wide association mapping of polyphenol contents and antioxidant capacity in whole-grain rice. J. Agric. Food. Chem. 64(22): 4695-703.
- Xu TY, Sun J, Chang HL, Zheng HL, Wang JG, Liu HL, et al. 2017. QTL mapping for anthocyanin and proanthocyanidin content in red rice. Euphytica. 213(11): 243
- Zhang Q, Zhang J, Shen J, Dennis DA, Barrow CJ. Silva Al2006. A simple 96-well microplate method for estimation of total polyphenol content in seaweeds. J. Appl. Phycol. 18: 445-450.
- Zheng J, Wu H, Zhao M, Yang Z, Zhou Z, Guo Y, et al. 2021. OsMYB3 is a R2R3-MYB gene responsible for anthocyanin biosynthesis in black rice. Mol. Breed. 41(8): 51