Abstract
We analyzed the transcriptional profile of the Xoo infected bbr1 mutant using a commercial rice gene chip containing 51,279 transcripts. Microarray revealed 92 genes with increased levels of expression and 22 genes with decreased levels of expression in bbr1. Some of the differentially expressed genes were validated by qRT-PCR. Higher expression of defense-related genes and AP2 domain containing transcription factors along with lower expression of reactive oxygen scavenging enzymes may be responsible for defense signaling in the bbr1 upon Xoo infection. The putative target genes of AP2 domain containing transcription factors also showed differential gene expression during Xoo infection, some of which encoded bacterial pathogen resistance-related protein. Induction of AP2 domain containing transcription factors along with up-regulation of their putative target genes during Xoo infection may inhibit pathogen spread in the bbr1. This observation supports the hypothesis that AP2 domain containing transcription factors is involved in the regulation of differentially expressed genes in bbr1.
-
Key words: Bacterial blight resistant rice, Gamma-ray mutant, Xanthomonas oryzae pv. oryzae, ERF and DREB/CBF
INTRODUCTION
Rice (
Oryza sativa L.) is the most important crop in the world as it feeds half of the world’s population. The stable production of rice is affected by biotic and abiotic stress. The rice diseases caused by plant pathogenic fungi, bacteria and viruses are capable of causing heavy loss on rice crop, the global yields of which is annually decreasing by 10–15% (
Dai et al. 2007). The use of resistant cultivars is one of the most important factors used to control diseases.
Because worldwide rice production has been severely affected by bacterial blight (BB) caused by
Xanthomonas oryzae pv.
oryzae (
Xoo), early research efforts have been focused on the utilizing disease resistance (
R) genes in rice. Since the first cloning of the
R gene
Xa21 which confers resistance to
Xoo almost twenty years ago (
Song et al. 1995), nearly 30 major
R genes for resistance to
Xoo have been identified (
Kurata and Yamazaki 2006) and five of them:
Xa1,
Xa3/
Xa26,
xa5,
xa13 and
Xa27, have been cloned: (
Yoshimura et al. 1998;
Iyer and McCouch 2004;
Sun et al. 2004;
Gu et al. 2005;
Chu et al. 2006;
Jiang et al. 2006). Genetic studies of BB resistance have resulted in the development of donor lines carrying major
R genes. A number of these donor lines have been used in rice breeding programs around the world. Using transgenic approach, agronomically important cultivars such as IR64 and IR72 have been transformed with the
Xa21 gene and field trials of selected lines were successfully undertaken in China (
Zhang et al. 1998;
Tu et al. 2000). Further, the
Xa21 gene has been introduced into a widely used restorer of hybrid rice in China, Minghui 63, in order to produce BB-resistant hybrid rice with elite agronomic characters (
Zhai et al. 2002).
Mutation breeding is also an important tool for crop improvement. During the past 75 years, more than 3,100 mutant varieties have been produced worldwide (The FAO/IAEA Mutant Varieties Database,
http://mvgs.iaea.org/AboutMutantVarities.aspx). More than 501 new varieties in rice have been obtained by applying different mutagenic agents. In Asia Pacific, there are approximately 343 mutants of rice released (
Ahloowalia et al. 2004).
In previous study, six rice mutant lines (M5 generation); TILL300-534, TILL300-537, TILL300-1212, TILL300-793, TILL300-693 and TILL300-651, which present resistant phenotype against
Xoo KXO85 were selected from 3000 lines of gamma-ray mutated M3 plants (
Lim et al. 2010). Among selected six mutant lines TILL300-651 (
Bacterial Blight Resistance 1;
bbr1) showed relatively strong induction of rice
R gene
Xa21 which confers resistance to
Xoo and other rice
R genes such as
Pi36 and
Pi-ta against
Magnaporthe oryzae (
Lim et al. 2010). To further understand defense response in the
bbr1-
Xoo interaction, we profiled the expression of rice genes involved in the phenotype of rice mutant,
bbr1, using a commercial rice gene chip containing 51,279 transcripts representing two rice cultivars, indica and japonica.
MATERIALS AND METHODS
Plant materials and pathogen inoculation
‘Dongan’ seeds (Oryza sativa L. cv. japonica) were allowed to imbibe water overnight at 22°C and kept on moistened filter paper until germination. Germinated seeds were grown in soil in a greenhouse for 40 days prior to Xoo inoculation.
Bacterial cells of
Xoo were suspended in sterile distilled water and the inoculation concentration was adjusted to OD
600 = 1.0 (
Song et al. 1995). Rice leaves were inoculated with the bacterial suspension using the leaf clipping method (
Kauffman et al. 1973). For gene expression analysis, leaf samples were collected from untreated control and infected leaves at 10 days after inoculation. The samples were flash frozen in liquid nitrogen and stored at −80°C.
Total RNA was isolated from the collected samples using RNaesy mini kit (Qiagen) according to the manufacturer’s instruction. Approximately 1 μg DNA-free RNA was used for first-strand cDNA synthesis using the Moloney Murine Leukemia Virus (M-MuLV) reverse transcriptase for quantitative real-time polymerase chain reaction (qRT-PCR; Fermentas). The qRT-PCR reactions were performed using a Thermal Cycler Dice Real Time System TP850 (TaKaRa,
http://www.takara-bio.com) and SYBR Premix Ex Taq (TaKaRa). Primer sets prepared at 0.1 μM final concentration were used for a final volume of 25 μL. The thermal profile of the qRT-PCR reactions was 10 min at 95°C, 40 cycles of 5 s at 95°C/20 s at 60°C. Subsequently, a dissociation curve was generated. All reactions were carried out in triplicate. Primers used for qRT-PCR are listed in the
Table 1.
The microarray experiment was conducted by the DNA Link Corporation (Seoul, Korea) according to the Affymetrix technical manual (
http://www.affymetrix.com/support/index.affx). Total RNAs were extracted from the samples stored at −80 °C and gene expression was compared between the wild type ‘Dongan’ and
bbr1 mutant with two replicates. Hybridization, washing, staining and scanning procedures were performed as described in the Affymetrix technical manual. The analysis software was the Affymetrix Command Console, R affy-package (2.9.2), Expression Console1.1, DAVID.
RESULTS AND DISCUSSION
Isolation of the bbr1 mutant with enhanced Xoo resistance
To examine whether the
Xoo resistant phenotype can be maintained in the next generation, progeny from the TILL300-651 (M5) were tested for the
Xoo resistance phenotype.
Figure 1a shows a picture of typical leaves from each of the following inoculated wild type ‘Dongan’ and
bbr1 mutant. While all
bbr1 mutant progenies tested were resistant, showing relatively short lesions, inoculated leaves of wild type ‘Dongan’ developed water soaked long lesions (
Fig. 1a, b). This result demonstrates that the
bbr1 mutant enhanced resistance to
Xoo.
Leaf samples were collected from the uninoculated (no treatment; NT) and
Xoo-inoculated (10 DAI) wild type ‘Dongan’ (WT) and
bbr1 mutant (M6), to detect differential gene expression under both conditions. To reduce experimental variation we separately pooled the leaf samples from eight inoculated/uninoculated WT and
bbr1 mutant of individual biological replicate. Total RNA was then isolated from pooled samples and used for labeling. To identify the significantly differential expression of
Xoo responsive genes in
bbr1 compared to WT, we applied the following criteria; (a) the gene expression change occurred at the same direction (increase or decrease) in replication; and (b) the average ratio (fold change of
bbr1/WT signal intensity) of expression levels in all microarray analyses was greater than 4 or less than −4. Applying these criteria, we detected 92 genes with increased (up-regulated) levels of expression and 22 genes with decreased (down-regulated) levels of expression in
bbr1 (
Fig. 2). These genes were considered as characteristics of the
bbr1 mutant during
Xoo infection. These 114
differentially
expressed
genes (DEGs) were further analyzed and annotated using public access databases (
http://www.genome.jp/kegg). According to predicted functions of their homologous genes in
Arabidopsis, these genes could be assigned to eleven biological process categories (
Fig. 2), including defense and/or stress response, carbohydrate metabolic process, hormone responses, lipid metabolic process, nucleic acid metabolism, oxidation reduction, phosphate metabolism, protein metabolism, structure, transport and unknown function. Major categories of DEGs were biotic and abiotic stress related and transcription factors (
Table 2). Thirty-three genes were classified into these categories and only considered for functions on specific pathways to further illustrate the differential response of WT and
bbr1 mutant to
Xoo infection (
Table 2).
Higher expression of β-1,3-glucanase-like protein (Os01g0944900; >19 fold), lipoxygenase 2.3, chloroplast precursor (Os02g0194700; >10 fold), seven transmembrane protein MLO2 (Os03g0129100; >8 fold), protein phosphatase 2C family protein (Os06g0698300; 7 fold) and basic secretory protein (Os10g0490800; >14 fold) genes were detected at 10 DAI in
bbr1 mutant plant. On the other hand, lower expression of iron-phytosiderophore transporter protein yellow stripe 1 (Os02g0649900; >6 fold) and pathogen-related protein (Os01g0731100; >8 fold) were detected in
Xoo-infected
bbr1 leaf tissue (
Table 1). qRT-PCR analysis further confirmed the expression of representative five genes (R-1 ~ R-5;
Table 1) that were highly up-regulated in
bbr1 mutant 10 DAI. Among the five genes, three [Os01g0944900 (β-1,3-glucanase-like protein; R-1), Os02g0194700 (lipoxygenase 2.3 chloroplast precursor (R-2); and Os03g0129100 (seven transmembrane protein MLO2; R-3) were expressed at higher levels in
bbr1 than in WT after
Xoo inoculation (
Fig. 3a).
As a member of the PR-2 group of pathogenesis-related (PR) proteins, β-1,3-glucanase is induced by pathogen infection and plays an active antifungal role in hydrolyzing β-1,3-glucan, a major structural component of fungal cell walls (
Sela-Buurlage et al. 1993;
Jach et al. 1995). Lipid peroxidation, triggered by lipoxygenases and reactive oxygen species (ROS), is a hallmark of plant pathogen responses, both in signal transduction processes and during the execution of programmed cell death. Lipoxygenases oxidize free fatty acids in the cytosol or chloroplasts, thereby initiating several oxylipin pathways including the jasmonic acid and hydroperoxide lyase pathway (
Mosblech et al. 2009). Twelve predicted
Mlo homologs were identified in the rice genome (
Goff et al. 2002). The seven transmembrane MLO protein (
Devoto et al. 1999) is thought to mediate defense suppression against
Blumeria graminis f. sp.
hordei attack via direct Ca
2+-dependent interaction with calmodulin (
Kim et al. 2002). MLO- mediated defense suppression also likely involves one or several small GTP-binding proteins of the ROP (Rho- related GTPases from plants) family (
Schultheiss et al. 2002). Consistent with its involvement in plant-microbe interactions,
MLO expression is induced upon biotic and abiotic stress stimuli (
Piffanelli et al. 2002). Induction of defense related genes during
Xoo infection may inhibit pathogen spread in the
bbr1.
Four class III peroxidases genes [Os03g0235000 (POD-1), Os07g0677100 (POD-2), Os07g0677200 (POD-3) and Os08g0113000 (POD-4) were expressed at lower levels in the
bbr1 mutant than in WT 10 DAI (
Table 2). qRT-PCR also confirmed lower level of four peroxidases expression (
Fig. 3b). Peroxidases belong to well-known class of PR-9 proteins (
van Loon et al. 2006). They are expressed to limit cellular spreading of the infection through the establishment of structural barriers or generation of highly toxic environments by massively producing ROS and reactive nitrogen species (RNS) (
Passardi et al. 2005). Since POD scavenges the ROS, a reduced activity of this enzyme will increase the levels of ROS and result in hastened cell death. Down-regulation of
PODs in
bbr1 may therefore result in enhanced resistance against the invading pathogen. A lower expression of four
PODs in
bbr1 mutant implies the ROS involvement in defense against
Xoo invasion.
Higher expression of heat shock transcription factor 31 (Os02g0527300; >11 fold), RAP2.6 (Os08g0474000; >50 fold) and CBF-like protein (Os06g0127100; >40 fold), MYB domain containing protein LHY (Os04g0583900; >6 fold) and LBM1 (Os07g0558100; >6 fold) and NAM domain containing protein (Os03g0327800; >5 fold) genes were detected in
bbr1 mutant plant 10 DAI. On the other hand, lower expression of typical P-type R2R3 MYB protein (Os01g0975300; >7 fold) and AP2 domain containing protein RAV (Os01g0141000; >4 fold) were detected in
Xoo-infected
bbr1 leaf tissue (
Table 2). qRT-PCR analysis further confirmed the expression of eight representative transcription factor genes (TF1-1 ~ TF-8;
Table 1) that were highly up- and down-regulated in
bbr1 mutant 10 DAI. The result showed that expression levels of TF-1 (heat shock transcription factor 31), TF-2 (CBF-like protein) and TF-3 (RAP2.6) were increased in
bbr1 whereas TF-7 (typical P-type R2R3 Myb protein) and TF-8 (RAV-like protein) were suppressed in
bbr1 which are in agreement with the microarray results (
Fig. 3c). Due to the central role of ERF and CBFs/DREBs in biotic and abiotic stress responses and their ability to regulate a large number of stress-responsive target genes, induction of these transcription factors are involved in the regulation of differentially expressed genes in
bbr1.
On the basis of the number of AP2/ERF domains encoded and the gene function, the AP2/EREBP gene family has been divided into four subfamilies: AP2, RAV, DREB and ERF (
Sakuma et al. 2002). Both ERF and DREB/CBF subfamilies are of particular interest owing to their involvement in plant responses to stresses.
ERF subfamily genes encode a large number of ERFs (
Fujimoto et al. 2000), which have been shown to participate in the plant response to biotic stress such as pathogens by recognizing the
cis-acting element GCCGCC, known as the GCC-box (
Hao et al. 1998). The DREB subfamily genes play an important role in the resistance of plants to abiotic stresses by recognizing the dehydration responsive element (DRE), which has a core motif CCGAC (
Liu et al. 1998). The transcription factors, RAV1 and RAV2, contain an AP2 domain in the N-terminal regions and a B3 domain in the C-terminal regions (
Kagaya et al. 1999). Using binding site selection assays, the AP2 and B3 domains of RAV1 were found to bind to the CAACA and CACCTG motifs (
Kagaya et al. 1999). Ectopic expression of the
CaRAV1 gene in transgenic Arabidopsis plants resulted in the induction of some pathogenesis related (PR) genes, enhancing resistance against infection by bacterial pathogens, and tolerance to osmotic stresses caused by high salinity and dehydration conditions (
Sohn et al. 2006).
Among the differentially expressed transcription factor genes observed in this study, the average expression fold change of RAP2.6 (51.32 fold higher than wild type) and CBF like protein (43.92 fold higher than wild type) are the highest in the
bbr1. Another AP2 domain containing transcription factor RAV-like protein (4.17 fold lower than wild type) is also suppressed in the
bbr1 after
Xoo infection (
Table 2). The extent of induction or repression of an individual gene by
Xoo infection in
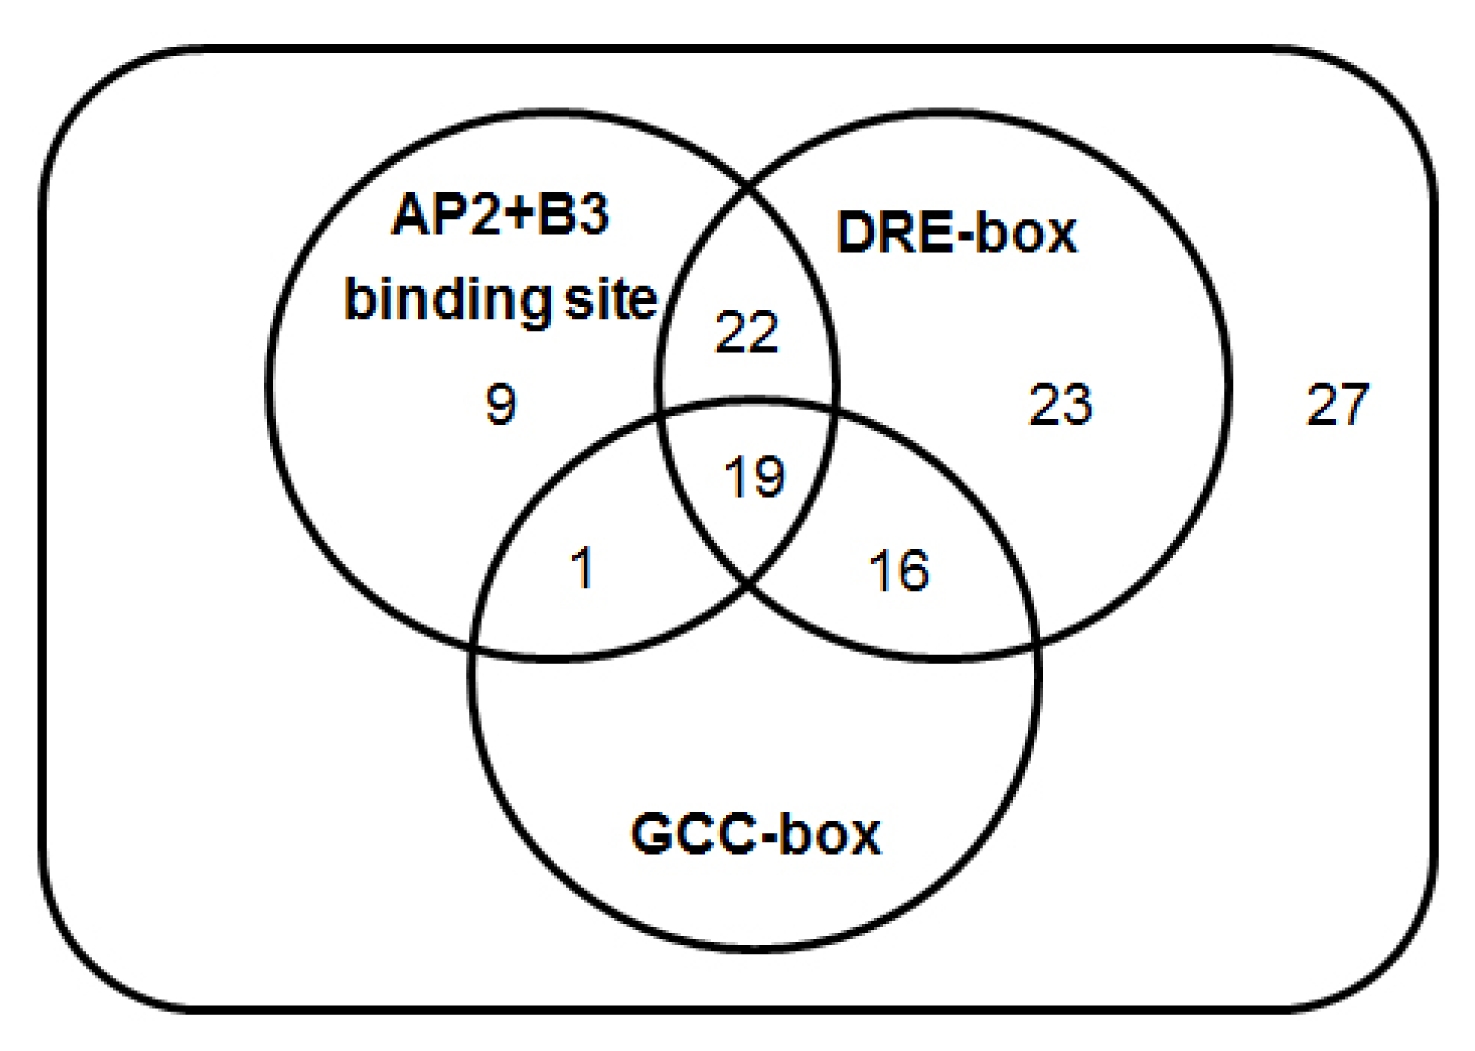
bbr1 depends on a complex interaction between its transcription apparatus and associated regulation related sequences. To analyze the promoter region of target genes we selected 117 candidates which are more than two fold up- or down-regulated genes in
bbr1 and used sequences located 2 kb upstream of the 5′ termini of each candidate genes. Among 117 candidate genes, GCC-box (GCCGCC;
Table S1), DRE-related core motifs (CCGAC;
Table S2) and AP2+B3 binding motif (CAACA and CACCTG;
Table S3) are found in the promoter regions of 90 (73.77%) putative target genes (
Fig. 4). Among the genes we detected, several were reported to be related to disease resistance, such as F-BOX STRESS INDUCED 2 (
Maldonado-Calderon et al. 2012), PEN3 (
Xin et al. 2013), RPM1-INDUCED PROTEIN KINASE (
Feng et al. 2012), WRKY108 (
Higashi et al. 2008) and BETA-1,3-GLUCANASE 2 (
Silipo et al. 2005). This observation supports the hypothesis that AP2 domain containing transcription factors are involved in the regulation of differentially expressed genes in
bbr1.
CONCLUSION
Japonica rice mutant bbr1 which is selected by mutant screening in this study was characterized. The up- and down-regulated genes identified in Xoo resistant bbr1 may play a role in resistance. To investigate the Xoo resistance of the gamma-ray irradiated mutant line, bbr1, we performed the commercial rice gene chip analysis. Through DNA microarray analysis, we found significantly elevated expression of AP2 domain containing transcription factor genes, RAP2.6 (Os08g0474000) and CBF (Os06g0127100). Because the primary role of ERF and CBFs/DREBs is the regulation of a large number of target stress-responsive genes in biotic and abiotic stress, the enriched expression of the transcription factors suggests that they might be involved in the regulation of differentially expressed genes in bbr1. Also, the suppression of ROS scavenging enzyme, class III POD genes (Os03g023500, Os07g0677100, Os07g0677200, and Os08g0113000) was detected from DNA microarray analysis of bbr1. Down-regulation of PODs in bbr1 may contribute to the resistance against the invading pathogen. A lower expression of four PODs in bbr1 mutant than wild-type implies that increased ROS may have influence on the defense against Xoo invasion. These observations support the hypothesis that the genes mentioned above, contribute to bacterial blight resistance in bbr1 mutant.
Supplementary materials
Table S1Thirty-six GCC-box containing differentially expressed genes in bbr1 mutant compared to wild type.
Table S1
|
Gene Description |
Gene Title |
AGI Number |
Number of GCC-box in putative promoter regiona
|
Average fold changeb
|
|
|
GCCGCC |
GGCGGC |
Total No |
NT |
Xoo |
|
Transcription factor activity |
|
MYB family transcription factor |
Os01g0863300 |
AT2G38090 |
3 |
3 |
6 |
7.5 |
8.72 |
|
MYB family transcription factor |
Os02g0104500 |
AT1G76890 |
5 |
10 |
15 |
−5.62 |
−2.1 |
|
Response to stress |
|
HSF-type DNA-binding domain containing protein |
Os06g0553100 |
AT3G24520 |
0 |
4 |
4 |
2.69 |
24.93 |
|
VQ domain containing protein |
Os01g0278000 |
AT2G41010 |
1 |
1 |
2 |
4.84 |
7.29 |
|
oxidoreductase/transition metal ion binding protein |
Os09g0445600 |
AT5G19875 |
1 |
5 |
6 |
3.57 |
6.87 |
|
Similar to F-BOX STRESS INDUCED 2 |
Os07g0561300 |
AT4G21510 |
5 |
3 |
8 |
3.64 |
6.57 |
|
Calmodulin-related calcium sensor protein |
Os01g0955100 |
AT1G76640 |
1 |
1 |
2 |
7.24 |
6.32 |
|
phosphate carrier protein |
Os09g0454600 |
AT3G48850 |
4 |
2 |
6 |
3.86 |
6.19 |
|
diacylglycerol kinase 1 |
Os12g0224000 |
AT5G63770 |
1 |
1 |
2 |
2.31 |
2.75 |
|
PR (pathogenesis-related) peptide |
Os12g0437800 |
AT2G38870 |
12 |
5 |
17 |
−3.81 |
1.06 |
|
Protein modification process |
|
protein phosphatase 2C |
Os03g0268600 |
AT2G29380 |
1 |
2 |
3 |
7.29 |
9.99 |
|
STE_MEKK_ste11_MAP3K.6 - STE kinases |
Os01g0699500 |
AT5G55090 |
2 |
0 |
2 |
9.48 |
9 |
|
receptor protein kinase CRINKLY4 precursor |
Os08g0374600 |
AT3G55950 |
2 |
0 |
2 |
4.94 |
8.88 |
|
protein kinase |
Os02g0165100 |
AT1G16670 |
2 |
0 |
2 |
6.63 |
8.63 |
|
STE_MEKK_ste11_MAP3K.4 - STE kinases |
Os01g0699100 |
AT5G55090 |
2 |
2 |
4 |
3.1 |
7.44 |
|
protein phosphatase 2C |
Os01g0583100 |
AT1G17550 |
1 |
1 |
2 |
2.93 |
3.77 |
|
Nucleotide binding |
|
WD domain containing protein |
Os01g0383700 |
AT4G03020 |
2 |
0 |
2 |
4.42 |
5.19 |
|
Development |
|
late embryogenesis abundant protein D-34 |
Os06g0341300 |
AT3G22490 |
4 |
3 |
7 |
5.39 |
15.56 |
|
senescence-associated gene 29 |
Os02g0513100 |
AT3G48740 |
2 |
0 |
2 |
4.47 |
10.93 |
|
Auxin regulated protein? |
Os01g0851100 |
AT2G37980 |
1 |
1 |
2 |
3.86 |
6.41 |
|
Metabolic procss |
|
fringe-related protein |
Os03g0269900 |
AT2G37730 |
3 |
2 |
5 |
3.86 |
6.94 |
|
gibberellin receptor GID1L2 |
Os03g0790500 |
AT5G06570 |
1 |
1 |
2 |
4.76 |
6.82 |
|
Anthranilate synthase alpha 2 subunit |
Os03g0264400 |
AT2G29690 |
2 |
0 |
2 |
3.4 |
3.23 |
|
starch synthase |
Os06g0133000 |
AT1G32900 |
1 |
1 |
2 |
13.45 |
1.23 |
|
Unknown function |
|
transposon protein |
Os01g0186900 |
|
0 |
3 |
3 |
17.03 |
15.89 |
|
expressed protein |
Os01g0305200 |
AT1G69510 |
1 |
9 |
10 |
4.3 |
9.88 |
|
RPGR, putative |
Os03g0296200 |
|
1 |
1 |
2 |
6.77 |
8.97 |
|
expressed protein |
Os02g0527200 |
AT2G27830 |
2 |
4 |
6 |
5.1 |
8.57 |
|
expressed protein |
Os02g0601000 |
|
4 |
0 |
4 |
4.99 |
6.54 |
|
expressed protein |
Os06g0133300 |
|
4 |
2 |
6 |
4.3 |
4.13 |
|
expressed protein |
Os01g0138500 |
AT2G01260 |
0 |
1 |
1 |
2.88 |
4.13 |
|
DUF966 domain containing protein |
Os01g0975000 |
AT5G59790 |
2 |
3 |
5 |
3.48 |
4.04 |
|
cyclase/dehydrase family protein |
Os01g0772400 |
AT4G17650 |
1 |
3 |
4 |
3.36 |
3.38 |
|
expressed protein |
Os12g0209700 |
AT4G10930 |
2 |
3 |
5 |
−2.31 |
−2.19 |
|
expressed protein |
Os11g0307600 |
|
2 |
0 |
2 |
−7.41 |
−2.37 |
|
Similar to pnn protein |
Os12g0516700 |
|
1 |
23 |
24 |
−3.88 |
−3.67 |
Table S2Seventy-nine DRE binding domain containing differentially expressed genes in bbr1 mutant compared to wild type.
Table S2
|
Description |
Gene Title |
AGI Number |
Number of DRE-box in putative promoter regiona
|
Average fold changeb
|
|
|
CCGAC |
GTCGG |
Total No. |
NT |
Xoo |
|
Transcription factor activity |
|
Tify domain containing protein |
Os10g0391400 |
No |
5 |
3 |
8 |
2.98 |
85.24 |
|
transcription factor bHLH92-like |
Os03g0741100 |
No |
1 |
1 |
2 |
2.4 |
35.02 |
|
Heat shock transcription factor 31 |
Os02g0527300 |
AT2G26150 |
0 |
1 |
1 |
3.05 |
26.01 |
|
WRKY DNA -binding domain |
Os01g0821300 |
No |
2 |
6 |
8 |
2.14 |
25.72 |
|
Similar to MCB2 protein (Myb-type) |
Os01g0863300 |
AT5G04760 |
4 |
0 |
4 |
3.39 |
19.37 |
|
Chitin-inducible gibberellin-responsive protein |
Os07g0545800 |
AT5G48150 |
1 |
3 |
4 |
2.08 |
12.32 |
|
RING/FYVE/PHD-type domain containing protein |
Os02g0682300 |
No |
1 |
0 |
1 |
2.65 |
8.86 |
|
Tify domain containing protein |
Os09g0439200 |
No |
2 |
1 |
3 |
3.07 |
8.84 |
|
MYC/bHLH transcription factor-like |
Os06g0164400 |
AT5G67110 |
2 |
1 |
3 |
2.51 |
6.05 |
|
NAM protein domain containing protein |
Os12g0123800 |
AT5G18270 |
0 |
1 |
1 |
2.85 |
4.36 |
|
Response to stress |
|
Avr9Cf-9 rapidly elicited protein 74 |
Os06g0248500 |
No |
4 |
1 |
5 |
3.24 |
95.27 |
|
hypothetical protein |
Os01g0186900 |
AT5G12010 |
1 |
1 |
2 |
2.97 |
92.16 |
|
Avr9Cf-9 rapidly elicited protein 74 |
Os03g0240600 |
No |
1 |
0 |
1 |
2.65 |
57.38 |
|
EF-hand Ca2+-binding protein CCD1 |
Os06g0683400 |
AT4G27280 |
8 |
1 |
9 |
2.33 |
23.83 |
|
GLYCINE-RICH PROTEIN 8 |
Os01g0278000 |
AT4G39260 |
2 |
0 |
2 |
2.56 |
13.9 |
|
RPM1-INDUCED PROTEIN KINASE |
Os09g0442100 |
AT2G05940 |
2 |
0 |
2 |
2.58 |
13.33 |
|
phosphate transport protein |
Os09g0454600 |
AT5G14040 |
1 |
2 |
3 |
2.46 |
9.71 |
|
expressed protein |
Os01g0582600 |
AT5G12010 |
2 |
1 |
3 |
2.18 |
9.36 |
|
putative beta-1,3 glucanase |
Os09g0542900 |
AT1G76070 |
1 |
1 |
2 |
2.23 |
9.32 |
|
Similar to Protein phosphatase 2C |
Os01g0583100 |
AT5G57050 |
1 |
1 |
2 |
2.93 |
5.22 |
|
heat shock protein Oshsp18.0 |
Os03g0267000 |
AT3G46230 |
0 |
5 |
5 |
2.54 |
4.68 |
|
Dehydrin Rab25 |
Os01g0702500 |
No |
2 |
1 |
3 |
4.59 |
3.68 |
|
subtilisin-chymotrypsin inhibitor-2A-like |
Os12g0437800 |
No |
3 |
6 |
9 |
−3.81 |
1.06 |
|
Protein modification precess |
|
protein kinase domain containing protein |
Os01g0699600 |
No |
0 |
1 |
1 |
3.65 |
70.53 |
|
protein kinase domain containing protein. |
Os01g0699500 |
No |
2 |
0 |
2 |
3.25 |
26.42 |
|
HIGHLY ABA-INDUCED PP2C GENE 3 |
Os03g0268600 |
AT2G29380 |
3 |
1 |
4 |
3.24 |
22.68 |
|
Protein kinase |
Os02g0165100 |
No |
2 |
1 |
3 |
2.76 |
20.92 |
|
Similar to Receptor kinase-like |
Os08g0374600 |
No |
1 |
1 |
2 |
3.02 |
14.39 |
|
MAPKKK18 |
Os01g0699400 |
AT1G05100 |
2 |
0 |
2 |
2.93 |
11.11 |
|
Oryza sativa MAP kinase BIMK1 |
Os03g0285800 |
No |
3 |
2 |
5 |
2.61 |
10.7 |
|
protein kinase domain containing protein |
Os01g0699100 |
No |
4 |
3 |
7 |
3.61 |
6.43 |
|
diacylglycerol kinase |
Os12g0224000 |
No |
2 |
1 |
3 |
2.04 |
3.19 |
|
Similar to Chaperone protein dnaJ 1 |
Os03g0822800 |
AT5G59610 |
1 |
1 |
2 |
2.6 |
−1.12 |
|
Biosynthetic process |
|
Similar to Viviparous-14 |
Os07g0154100 |
No |
0 |
1 |
1 |
2.48 |
16.14 |
|
Mog1/PsbP |
Os01g0934400 |
AT3G05410 |
1 |
2 |
3 |
4.89 |
8.9 |
|
GRANULE BOUND STARCH SYNTHASE 1 |
Os06g0133000 |
AT1G32900 |
2 |
2 |
4 |
13.45 |
1.23 |
|
Similar to Cytochrome P450 |
Os07g0635500 |
AT2G46960 |
6 |
1 |
7 |
2.82 |
6.25 |
|
Development |
|
zinc finger protein ZFP15 mRNA |
Os03g0820400 |
No |
4 |
2 |
6 |
3.91 |
34.75 |
|
Seed maturation protein domain containing protein |
Os06g0341300 |
AT3G22490 |
1 |
2 |
3 |
4.37 |
19.29 |
|
CALMODULIN LIKE 39 |
Os01g0955100 |
AT1G76640 |
|
1 |
1 |
2.53 |
18.25 |
|
Late embryogenesis abundant protein |
Os01g0705200 |
No |
1 |
0 |
1 |
3.21 |
6.62 |
|
Gene regulation |
|
arginine/serine-rich 12 |
Os12g0516700 |
|
1 |
17 |
18 |
−3.84 |
−3.63 |
|
Metabolic process |
|
hypothetical protein |
Os01g0952900 |
No |
1 |
3 |
4 |
3.73 |
248.65 |
|
Nuclease, Phoaphatase |
Os01g0716800 |
AT1G71710 |
1 |
2 |
3 |
2.87 |
15.91 |
|
α/β hydrolase fold-3 domain containing protein |
Os03g0790500 |
AT5G06570 |
2 |
0 |
2 |
2.83 |
11.52 |
|
putative beta-1,3 glucanase |
Os03g0792800 |
AT1G64760 |
1 |
2 |
3 |
2.91 |
6.35 |
|
putative 4-coumarate-CoA ligase |
Os01g0901600 |
AT5G63380 |
1 |
1 |
2 |
2.25 |
5.04 |
|
Similar to H-ATPase |
Os03g0689300 |
AT5G62670 |
0 |
1 |
1 |
3.53 |
4.88 |
|
Transport |
|
peptidylprolyl isomerase ROC7 |
Os06g0708300 |
AT4G39220 |
1 |
1 |
2 |
2.65 |
10.09 |
|
Similar to MtN3 protein precursor |
Os02g0513100 |
AT5G50800 |
1 |
1 |
2 |
5.73 |
8.59 |
|
putative axi 1 protein |
Os01g0851100 |
AT2G37980 |
2 |
0 |
2 |
3.62 |
6.9 |
|
Anthranilate synthase component I family protein |
Os03g0264400 |
AT5G05730 |
2 |
2 |
4 |
2.24 |
4.94 |
|
dehydrase family protein |
Os01g0772400 |
AT4G17650 |
2 |
1 |
3 |
4.09 |
2.8 |
|
Similar to GTP-binding nuclear protein Ran1B |
Os06g0600301 |
AT5G55190 |
1 |
0 |
1 |
2.15 |
2.12 |
|
Nucleotide binding |
|
WD-40 repeat family protein |
Os01g0383700 |
AT4G03020 |
4 |
2 |
6 |
3.56 |
6.49 |
|
Unknown function |
|
ZIM domain containing protein |
Os03g0181100 |
No |
3 |
5 |
8 |
2.73 |
56.55 |
|
hypothetical protein |
Os06g0133500 |
No |
1 |
0 |
1 |
3.01 |
45.58 |
|
hypothetical protein |
Os02g0733900 |
No |
1 |
1 |
2 |
3.47 |
44.9 |
|
DWNN domain domain containing protein |
Os03g0659400 |
No |
1 |
2 |
3 |
2.91 |
19.86 |
|
hypothetical protein |
Os02g0527200 |
No |
4 |
4 |
8 |
2.55 |
17.3 |
|
hypothetical protein |
Os02g0601000 |
No |
3 |
5 |
8 |
2.47 |
13.29 |
|
hypothetical protein |
Os01g0305200 |
No |
4 |
5 |
9 |
3.23 |
13.21 |
|
hypothetical protein |
Os01g0121600 |
No |
0 |
2 |
2 |
2.51 |
10.85 |
|
hypothetical protein |
Os03g0296200 |
No |
4 |
0 |
4 |
6.64 |
9.28 |
|
hypothetical protein |
Os07g0115500 |
No |
1 |
1 |
2 |
2.58 |
9.08 |
|
hypothetical protein |
Os06g0133300 |
No |
0 |
1 |
1 |
2.34 |
7.59 |
|
DUF604 family protein |
Os03g0269900 |
AT2G37730 |
1 |
0 |
1 |
3.6 |
7.49 |
|
DUF966 family protein |
Os01g0975000 |
No |
2 |
2 |
4 |
2.24 |
6.31 |
|
Cyclin-like F-box domain containing protein |
Os07g0561300 |
No |
5 |
2 |
7 |
3.9 |
6.17 |
|
hypothetical protein |
Os09g0445600 |
AT2G31940 |
0 |
2 |
2 |
4.22 |
5.75 |
|
DUF789 family protein |
Os01g0138500 |
AT2G01260 |
4 |
4 |
8 |
2.28 |
5.22 |
|
TonB box domain containing protein |
Os09g0532000 |
No |
1 |
0 |
1 |
2.35 |
4.15 |
|
Conserved hypothetical protein |
Os01g0121500 |
No |
1 |
0 |
1 |
2.88 |
3.07 |
|
hypothetical protein |
Os07g0516400 |
No |
1 |
2 |
3 |
4.83 |
3 |
|
metallothionein-like type 2 (OsMT-2) mRNA |
Os01g0149200 |
No |
1 |
3 |
4 |
2.77 |
2.78 |
|
hypothetical protein |
Os12g0209700 |
No |
4 |
2 |
6 |
−2.36 |
−2.14 |
|
Hydroxyproline-rich glycoprotein DZ-HRGP |
Os11g0307600 |
No |
3 |
0 |
3 |
−4.59 |
−2.89 |
|
similar to GT-2 factor |
Os02g0104500 |
No |
2 |
0 |
2 |
−5.62 |
−2.1 |
|
hypothetical protein |
Os01g0303800 |
No |
3 |
3 |
6 |
−2.08 |
−14.42 |
Table S3Fifty-one RAV1 binding domain containing differentially expressed genes in bbr1 mutant compared to wild type.
Table S3
|
Gene Description |
Gene Title |
AGI Number |
Number of RAV-binding site in putative promoter regiona
|
Average fold changeb
|
|
|
CAACA+ CACCTG |
TGTTG+ CAGGTG |
Total NO |
NT |
Xoo |
|
Transcription factor activity |
|
WRKY108, expressed |
Os01g0821300 |
AT4G11070 |
1 |
1 |
2 |
5.86 |
9.35 |
|
HSF-type DNA-binding domain containing protein |
Os06g0553100 |
AT3G24520 |
1 |
0 |
1 |
2.69 |
4.03 |
|
Response to stress |
|
U-box protein CMPG1 |
Os06g0248500 |
AT5G37490 |
0 |
1 |
1 |
14.72 |
20.82 |
|
cytochrome P450 |
Os12g0150200 |
AT2G27690 |
1 |
1 |
2 |
14.57 |
18.57 |
|
Similar to ATL31 and ATL6 |
Os02g0759400 |
AT5G27420 |
3 |
0 |
3 |
9.25 |
12.55 |
|
HSF-type DNA-binding domain containing protein |
Os02g0527300 |
AT5G03720 |
1 |
1 |
2 |
6.84 |
11.51 |
|
Similar to RAP 2.4 |
Os03g0191900 |
AT1G78080 |
1 |
2 |
3 |
6.15 |
9.38 |
|
late embryogenesis abundant protein, group 3 |
Os01g0705200 |
AT3G15670 |
1 |
0 |
1 |
2.87 |
7.34 |
|
oxidoreductase/transition metal ion binding protein |
Os09g0445600 |
AT5G19875 |
1 |
0 |
1 |
3.57 |
6.87 |
|
phosphate carrier protein |
Os09g0454600 |
AT3G48850 |
1 |
0 |
1 |
3.86 |
6.19 |
|
Similar to RPM1-induced kinase |
Os09g0442100 |
AT2G05940 |
1 |
0 |
1 |
5.76 |
5.96 |
|
Similar to PEN3 |
Os01g0609300 |
AT1G59870 |
1 |
0 |
1 |
5.68 |
5.62 |
|
expressed protein |
Os01g0582600 |
AT5G12010 |
1 |
0 |
1 |
4.24 |
4.81 |
|
Similar to 4CL |
Os08g0448000 |
AT3G21240 |
0 |
1 |
1 |
4.55 |
4 |
|
glutamate decarboxylase |
Os03g0236200 |
AT5G17330 |
2 |
1 |
3 |
4.27 |
3.46 |
|
Similar to PR-6 proteinase inhibitor family |
Os12g0437800 |
AT2G38870 |
1 |
0 |
1 |
−3.81 |
1.06 |
|
heat shock protein DnaJ |
Os03g0822800 |
AT5G59610 |
1 |
0 |
1 |
2.6 |
−1.12 |
|
Protein modification process |
|
STE_MEKK_ste11_MAP3K.7 - STE kinases |
Os01g0699600 |
AT2G32510 |
1 |
2 |
3 |
18.13 |
14.07 |
|
STE_MEKK_ste11_MAP3K.6 - STE kinases |
Os01g0699500 |
AT5G55090 |
0 |
3 |
3 |
9.48 |
9 |
|
receptor protein kinase CRINKLY4 precursor |
Os08g0374600 |
AT3G55950 |
0 |
1 |
1 |
4.94 |
8.75 |
|
protein kinase |
Os02g0165100 |
AT1G16670 |
1 |
0 |
1 |
6.66 |
8.63 |
|
protein phosphatase 2C |
Os09g0325700 |
AT2G29380 |
1 |
0 |
1 |
4.76 |
7.59 |
|
STE_MEKK_ste11_MAP3K.4 - STE kinases |
Os01g0699100 |
AT5G55090 |
1 |
0 |
1 |
3.1 |
7.44 |
|
STE_MEKK_ste11_MAP3K.5 - STE kinases |
Os01g0699400 |
AT5G55090 |
1 |
0 |
1 |
4.63 |
6.99 |
|
protein phosphatase 2C |
Os01g0583100 |
AT1G17550 |
2 |
1 |
3 |
4.03 |
3.77 |
|
Nucleotide binding |
|
CCHC-type zinc finger |
Os03g0659400 |
AT5G47430 |
0 |
1 |
1 |
6.23 |
9.25 |
|
WD domain |
Os01g0383700 |
AT4G03020 |
1 |
0 |
1 |
4.42 |
5.19 |
|
Development |
|
EF hand family protein |
Os06g0683400 |
AT2G46600 |
1 |
0 |
1 |
7.94 |
6.94 |
|
growth regulator related protein |
Os01g0851100 |
AT2G37980 |
1 |
0 |
1 |
3.86 |
6.41 |
|
glucan endo-1,3-beta-glucosidase precursor |
Os03g0792800 |
AT2G19440 |
1 |
0 |
1 |
3.13 |
5.9 |
|
senescence-inducible chloroplast stay-green protein 1 |
Os09g0532000 |
AT4G11910 |
0 |
1 |
1 |
2.72 |
3.57 |
|
Metabolic procss |
|
lumenal PsbP |
Os01g0934400 |
AT3G05410 |
0 |
2 |
2 |
5.08 |
12.04 |
|
expressed protein |
Os06g0203600 |
AT2G26310 |
1 |
0 |
1 |
9.19 |
11.35 |
|
AMP-binding domain containing protein |
Os01g0901600 |
AT5G63380 |
1 |
0 |
1 |
2.69 |
4.2 |
|
Transport |
|
white-brown complex homolog protein 7 |
Os01g0121600 |
AT2G01320 |
1 |
2 |
3 |
4.87 |
5.54 |
|
Rer1 protein |
Os06g0708300 |
AT4G39220 |
1 |
0 |
1 |
4.58 |
5.8 |
|
ras-related protein |
Os06g0600301 |
AT5G55190 |
0 |
1 |
1 |
2.17 |
2.06 |
|
Unknown function |
|
expressed protein |
Os01g0952900 |
AT5G12340 |
1 |
0 |
1 |
27.86 |
33.01 |
|
transposon protein |
Os01g0186900 |
|
2 |
0 |
2 |
17.09 |
15.89 |
|
expressed protein |
Os06g0133500 |
|
1 |
0 |
1 |
10.78 |
12.64 |
|
expressed protein |
Os01g0305200 |
AT1G69510 |
1 |
0 |
1 |
4.3 |
9.88 |
|
RPGR, putative, |
Os03g0296200 |
|
1 |
0 |
1 |
6.82 |
9 |
|
expressed protein |
Os02g0527200 |
AT2G27830 |
1 |
0 |
1 |
5.1 |
8.57 |
|
expressed protein |
Os02g0601000 |
|
1 |
1 |
2 |
4.99 |
6.5 |
|
expressed protein |
Os07g0516400 |
|
1 |
0 |
1 |
2.27 |
6.34 |
|
expressed protein |
Os01g0138500 |
AT2G01260 |
1 |
0 |
1 |
2.88 |
4.07 |
|
expressed protein |
Os09g0542900 |
AT1G76070 |
1 |
0 |
1 |
5.26 |
3.93 |
|
transposon protein |
Os01g0872900 |
|
1 |
0 |
1 |
5.68 |
3.64 |
|
cyclase/dehydrase family protein |
Os01g0772400 |
AT4G17650 |
0 |
1 |
1 |
3.36 |
3.38 |
|
expressed protein |
Os12g0209700 |
AT4G10930 |
0 |
1 |
1 |
−2.31 |
−2.13 |
ACKNOWLEDGMENTS
This work was supported by grants from the Technology Development Program for Agriculture and Forestry, Ministry of Agriculture, Food and Rural Affairs, Republic of Korea, and the KRIBB Research Initiative Program.
Fig. 1Phenotypic analysis of the rice bbr1 mutant. (a) Water-soaked disease lesions on three leaves from wild type ‘Dongan’ (WT) and bbr1 mutants (M6). 40-day-old plants were inoculated with Xoo. Image was taken two weeks after Xoo inoculation. (b) Leaf lesion lengths of eight bbr1 M6 progeny. Lesion lengths were measured at two weeks post Xoo inoculation. Experiments were repeated two times with similar results. Each data point represents the average and standard deviation of at least three leaves.
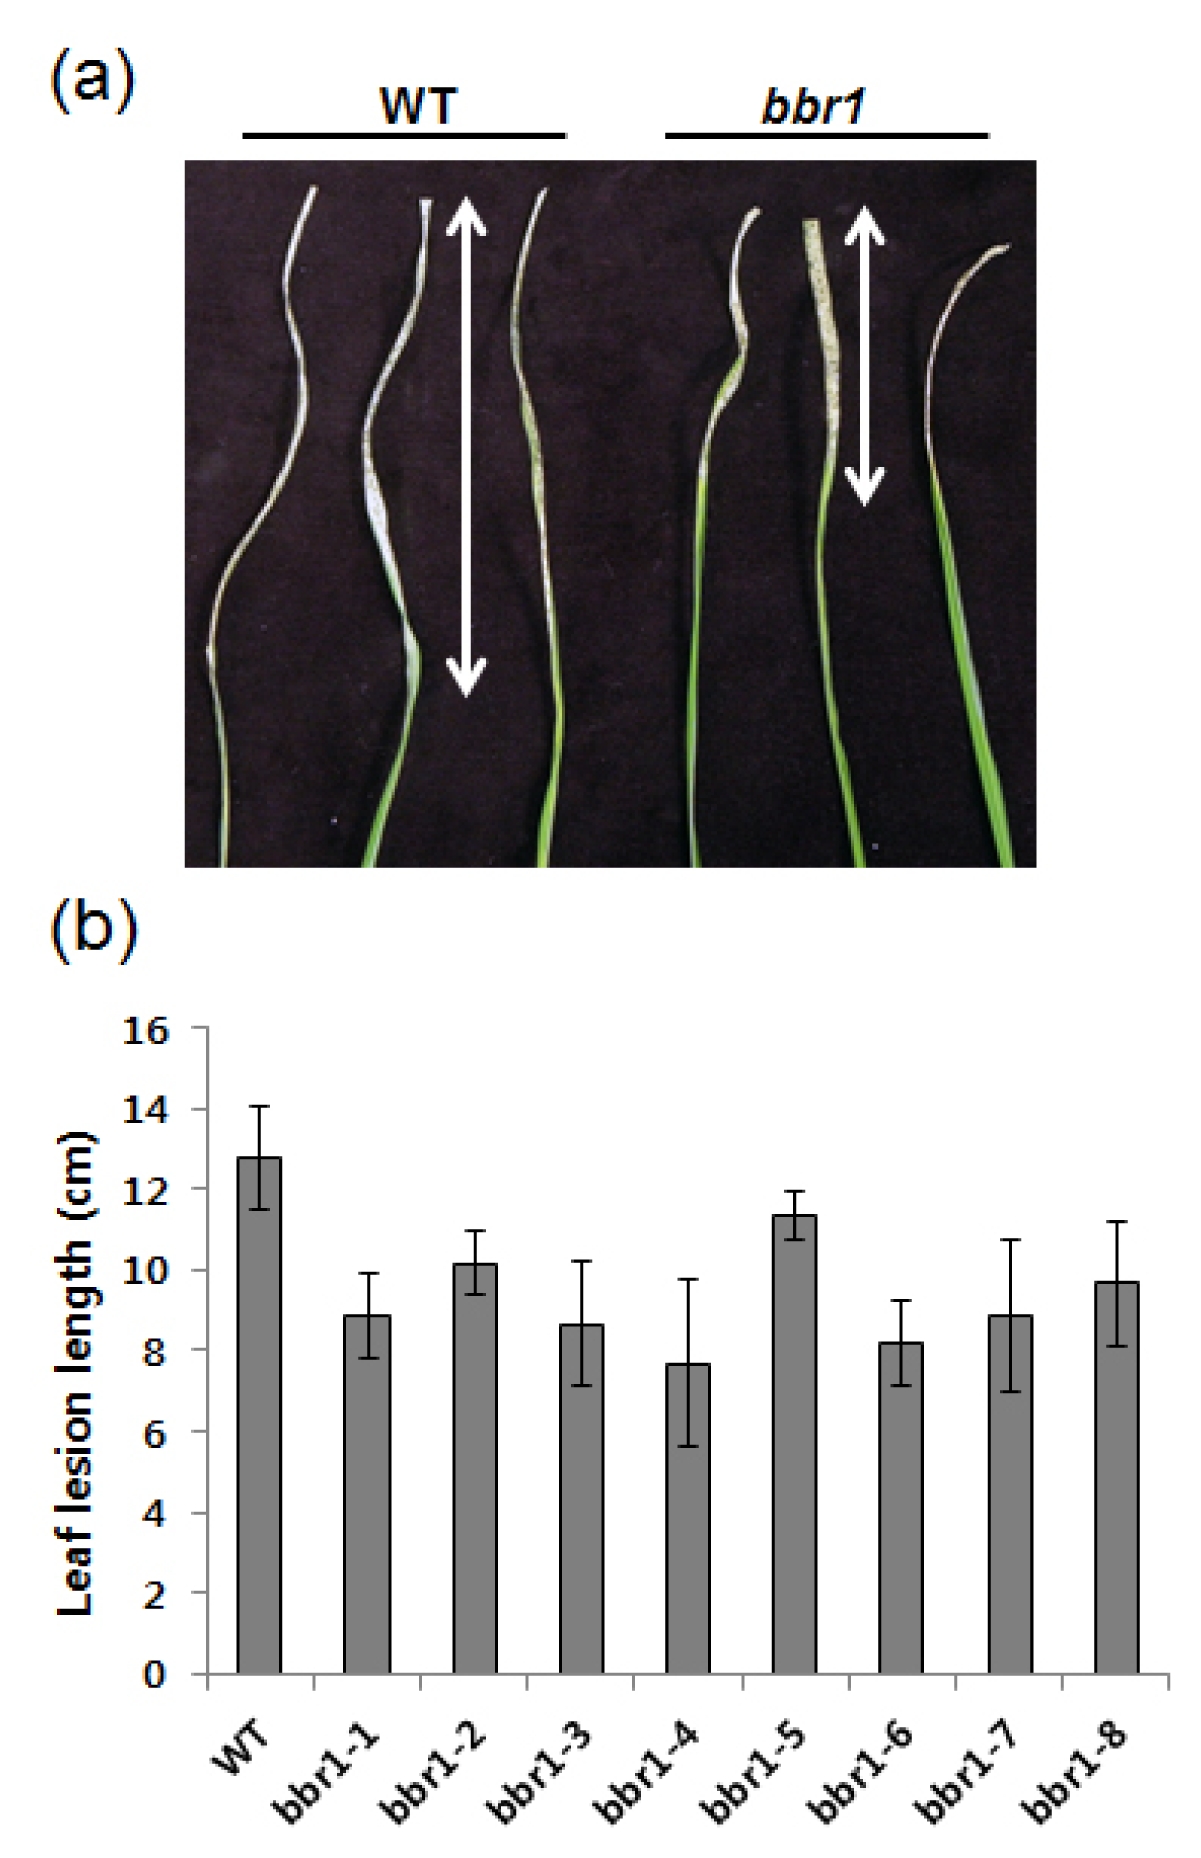
Fig. 2Gene ontology classification of differentially expressed genes in rice leaves at 10 day post inoculation. Functional categories are derived from the primary annotation of biological process retrieved from the Kyoto Encyclopedia of Genes and Genomes (KEGG;
www.genome.jp/kegg). Differentially-regulated genes were expressed at 4-fold higher or lower levels in the
bbr1 mutant compared to wild type from two independent microarray analyses. White bars indicated the number of four-fold down regulated genes and black bars indicated the number of four-fold up-regulated genes compared to the WT.
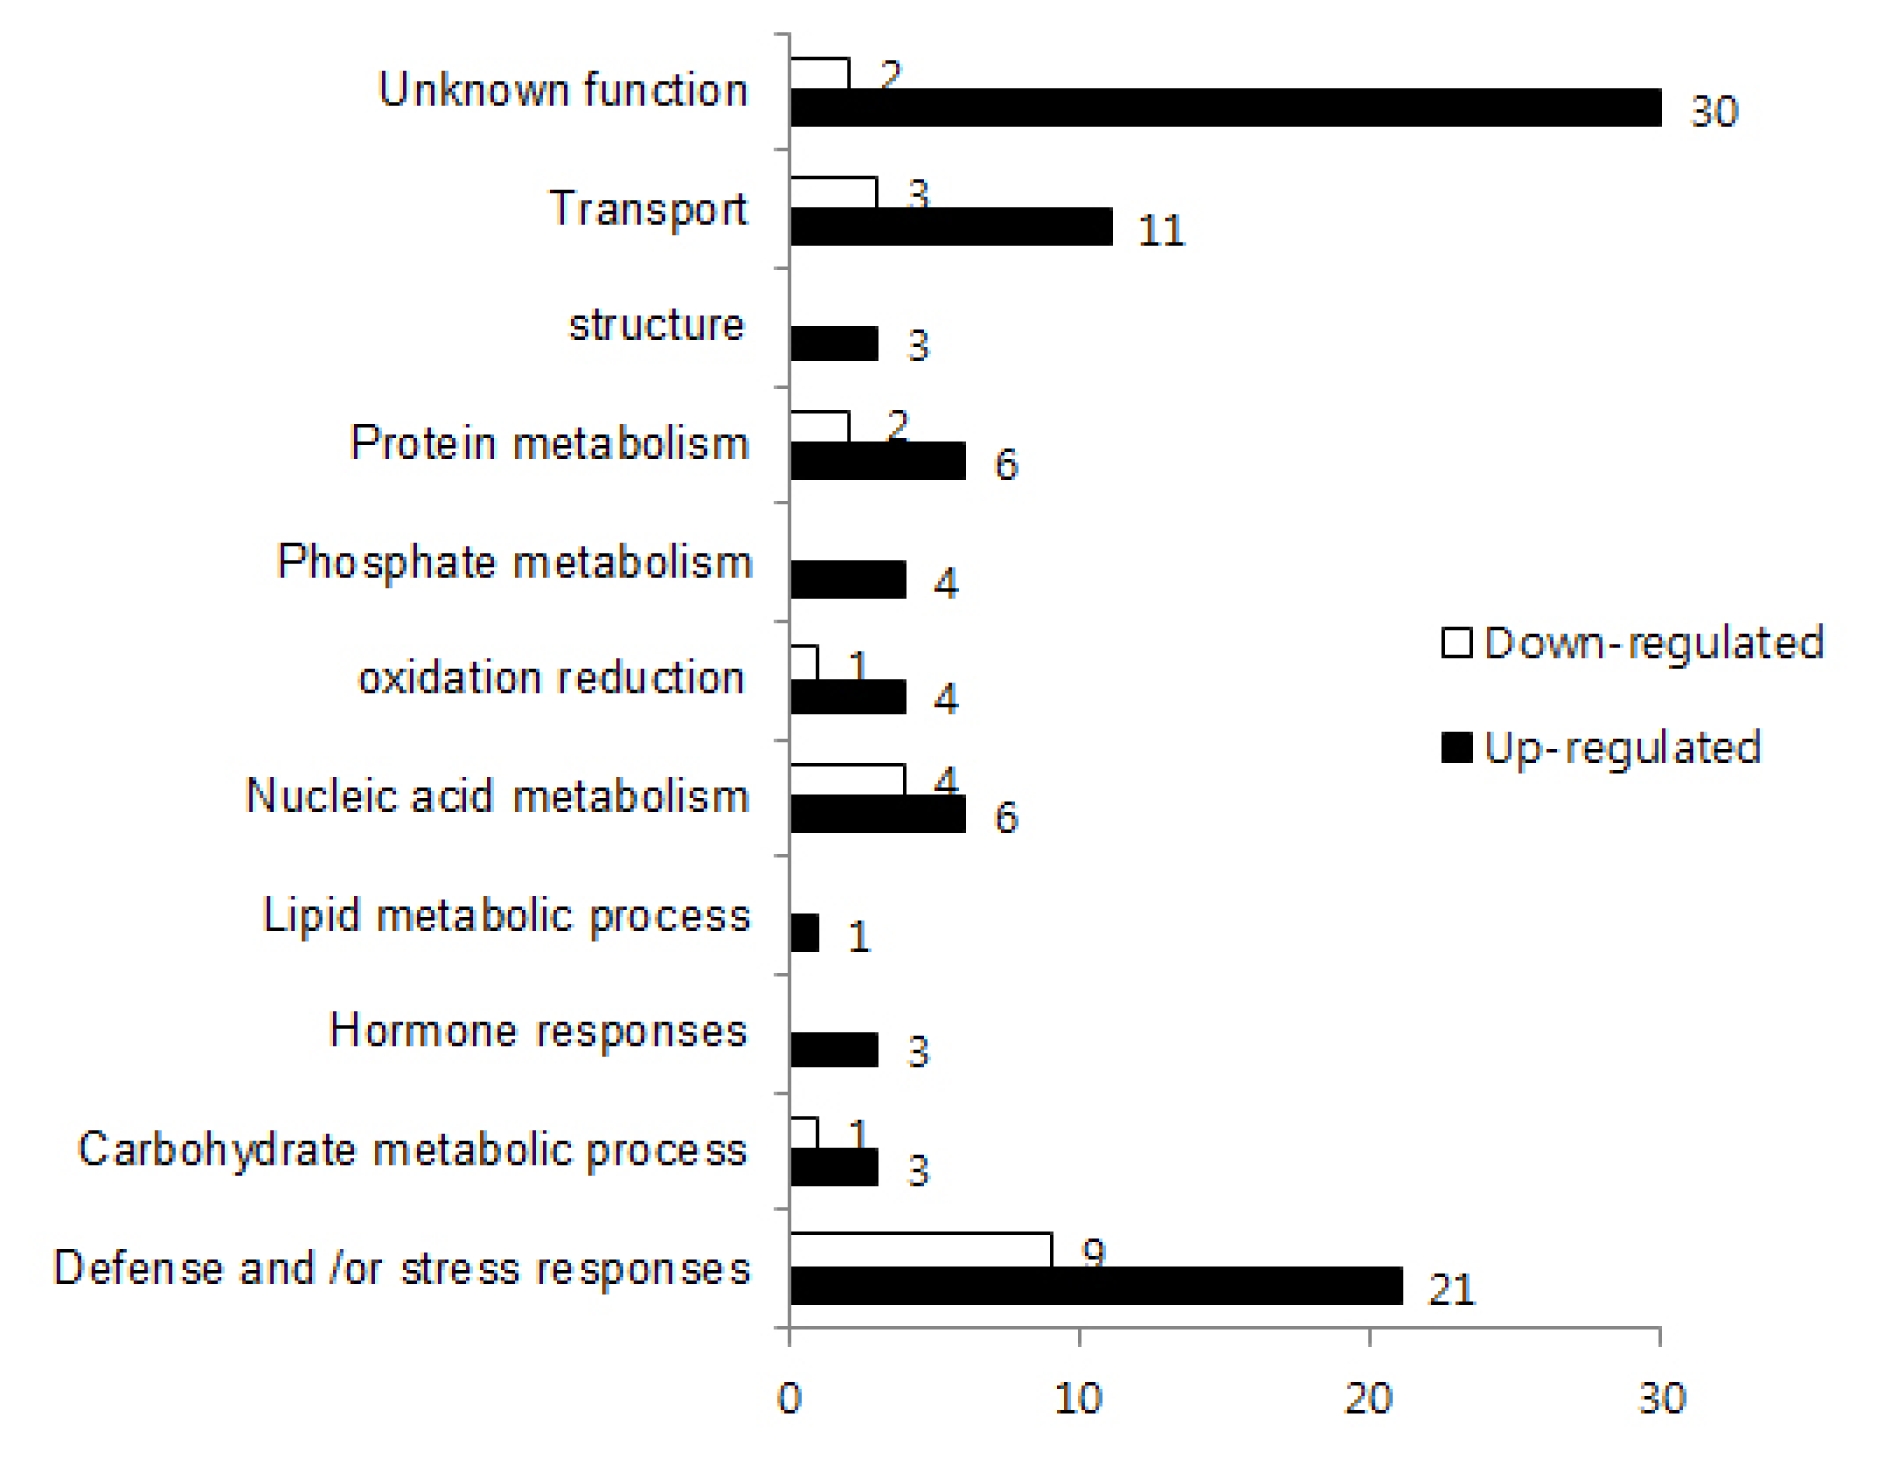
Fig. 3Altered expressions of genes related to Xoo inoculation in bbr1. The rice ACTIN gene was used as an internal positive control and transcript levels of the tested genes were normalized with that of ACTIN. Relative expressions of the tested genes were compared with that in WT plants. Bar represents standard deviation (three replicates) (a) qRT-PCR analysis was performed to study the transcript levels of peroxidase genes in the leaves of WT and bbr1 plants at the 40-day-old stage. The tested genes include POD-1, Os03g0235000; POD-2, Os07g0677100; POD-3, Os07g0677200; POD-4, Os08g0113000. (b) qRT-PCR analysis of the transcripts level of defense-related genes in the leaves of WT and bbr1 plants at the 40-day-old stage. The tested genes include R-1, Os01g0944900; R-2, Os02g0194700; R-3, Os03g0129100. (c) qRT-PCR analysis of the transcripts level of transcription factor genes in the in the leaves of WT and bbr1 plants at the 40-day-old stage. The tested genes include TF-1, Os02g0527300; TF-2, Os06g0127100; TF-3, Os08g0474000; TF-7, Os01g0975300; TF-8, Os01g0141000.
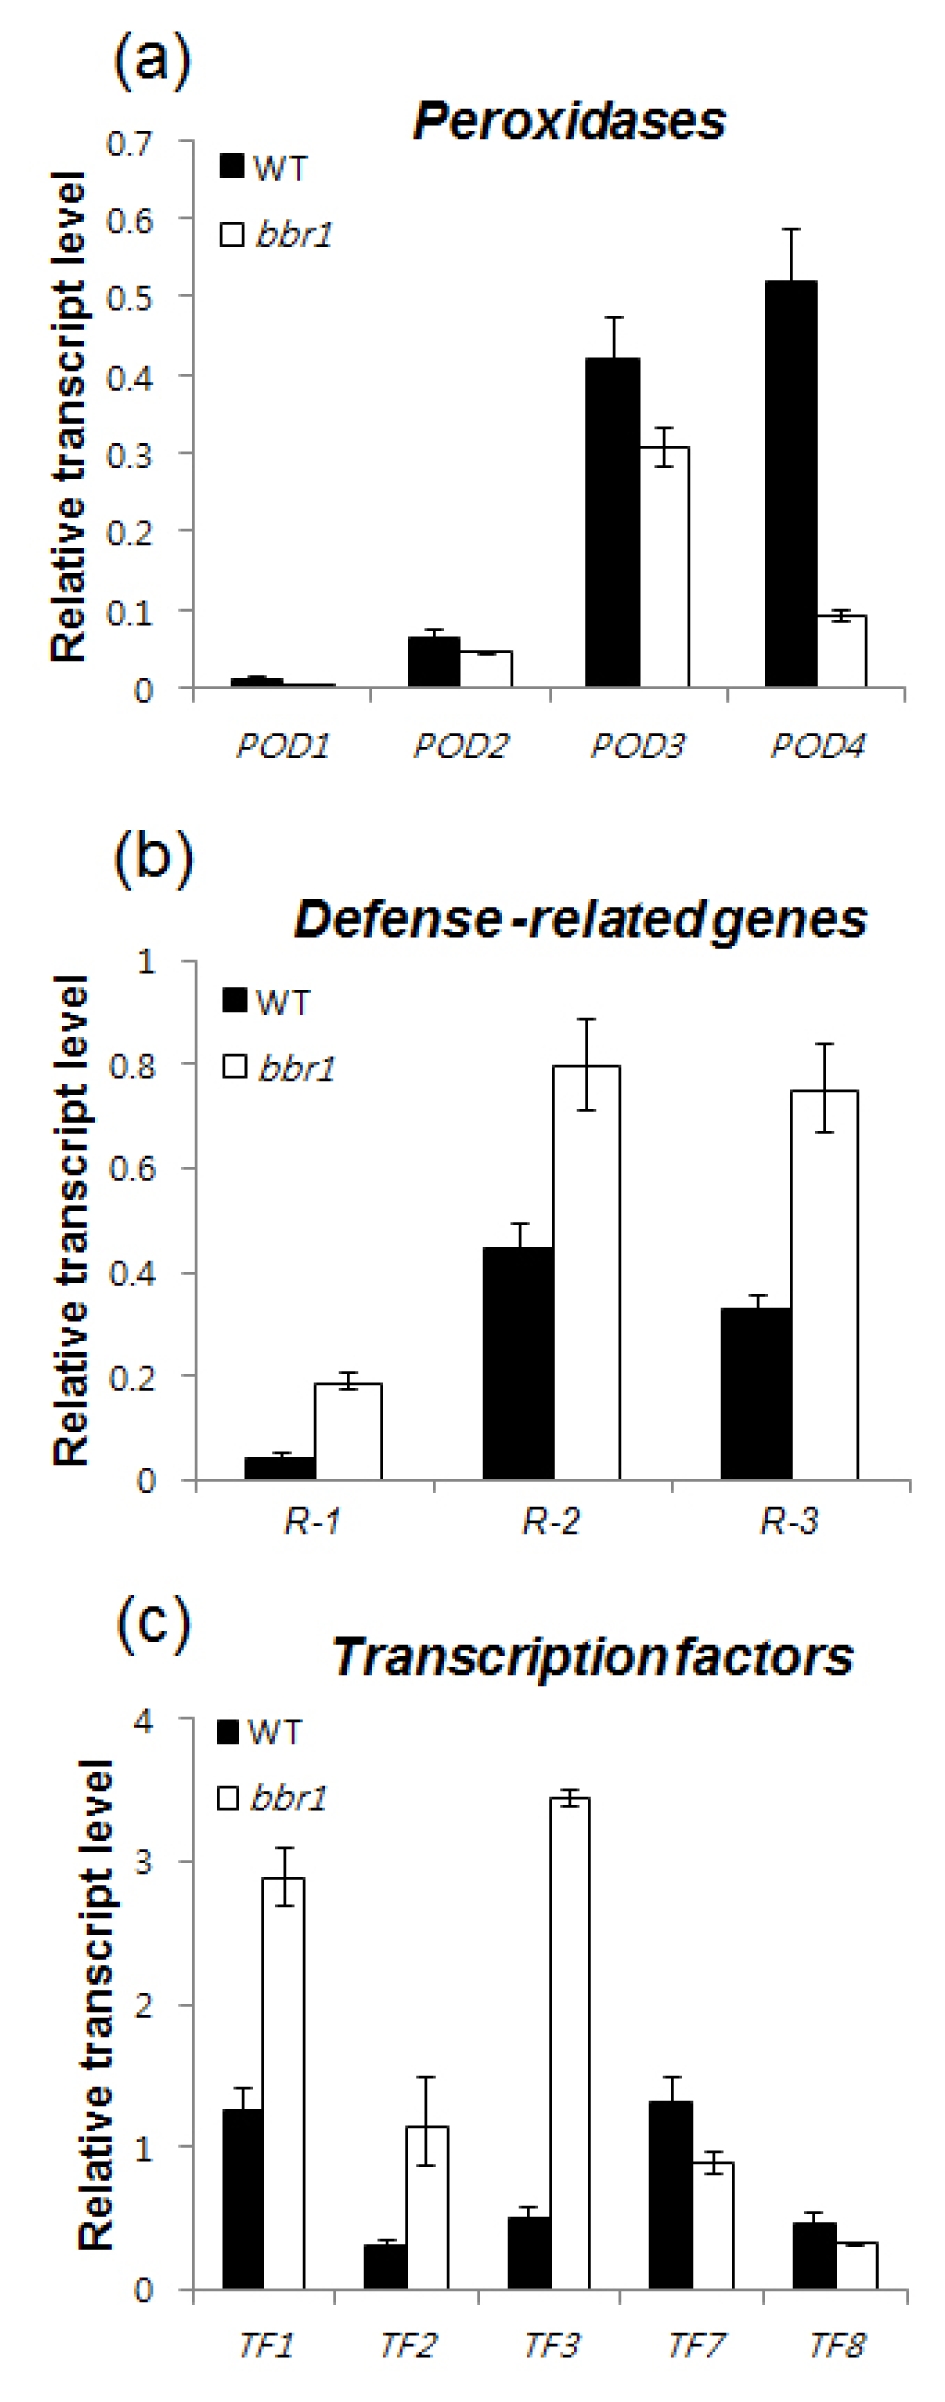
Fig. 4Venn diagram of more than two folds up- and down-regulated genes with different AP2 domain binding motif in bbr1 mutant. A total 117 genes were differentially expressed before and after Xoo infection, among which 90 putative target genes contain DRE-related core motifs (80 genes), GCC-box (36 genes) and AP2+B3 binding motif (51 genes) in their putative promoter regions.

Table 1Summary table displaying Arabidopsis orthologous of differentially expressed genes with known roles in disease resistance (R- ), transcript regulation (TF- ) and oxidative stress (POD- ) and sequences of forward and reverse primers used in quantitative RT-PCR to validate the 17 selected gene expression changes determined by microarray analysis. TF, Transcription factor; R, Resistance; POD, Peroxidase.
Table 1
|
Primer name |
Gene title |
Arabidopsis orthologous |
Forward-primer |
Reverset-primer |
|
TF-1 |
Os02g0527300 |
AT2G26150 |
gtggcactagtcagcaagca |
tactctcccaagctgcgttt |
|
TF-2 |
Os06g0127100 |
AT4G25480 |
ctacgcgtactacggcaaca |
gaggagcaaagctggttgag |
|
TF-3 |
Os08g0474000 |
AT4G34410 |
gagacaggggaccagctct |
ttcaattagtacaccagagccaat |
|
TF-4 |
Os04g0583900 |
AT5G37260 |
ctccacaaaacagggagtgg |
tgttttctttagctcgcctgt |
|
TF-5 |
Os03g0327800 |
AT3G04070 |
ctaggtcgtccgatcatgc |
ccggctttatgatcttgaca |
|
TF-6 |
Os07g0558100 |
AT4G21440 |
gcaacaaccacaacgtcaac |
agtgttcgattcggctctgt |
|
TF-7 |
Os01g0975300 |
AT5G59780 |
cagccagaggatgagtcgt |
gcgaataatccgagcagaag |
|
TF-8 |
Os01g0141000 |
AT1G13260 |
atcagcgtactcctgcccta |
tgcaatctctgacctgacaaa |
|
R-1 |
Os01g0944900 |
AT4G16260 |
gcttactacccggacgtcaa |
atgacggatgggttggtg |
|
R-2 |
Os02g0194700 |
AT3G45140 |
gctgcatttgggacaagatt |
atccgtccgcatgacatact |
|
R-3 |
Os03g0129100 |
AT2G39200 |
aaagggtgaggtcggaagat |
ggccatcaccgttgtacact |
|
R-4 |
Os06g0698300 |
AT4G31750 |
ctgcaaagaagctcctccag |
tctgcttggcacaagacaac |
|
R-5 |
Os10g0490800 |
AT2G15130 |
gtggactacgcgaagcaggt |
gtcacctccgtcctcacg |
|
POD-1 |
Os03g0235000 |
AT5G06720 |
ggcaactccatggtcaagat |
gcgctccacaacacattaaa |
|
POD-2 |
Os07g0677100 |
AT5G05340 |
atcaggcttagctgctccaa |
tcggtacataacatgggcttc |
|
POD-3 |
Os07g0677200 |
AT5G05340 |
agctgctccaaggtgaactc |
atggctgctctgctccatac |
|
POD-4 |
Os08g0113000 |
AT4G33420 |
ctgaattgcccgccttag |
cctccatgccacaatacaaa |
|
ACTIN |
Os03g50890 |
AT3G18780 |
ggaactggataggtcaaggc |
agtctcatggatacccgcag |
Table 2Highlight of differentially expressed genes with known or putative roles in stress response and transcript regulation. Differentially-regulated genes were expressed at 4-fold higher or lower levels in the bbr1 mutant compared to wild type from two independent microarray analyses.
Table 2
|
Description |
Gene Title |
Average fold changea
|
|
Transcription factor activity |
|
TF-1; Similar to Heat shock transcription factor 31 |
Os02g0527300 |
11.52 |
|
TF-2; AP2, Similar to CBF-like protein |
Os06g0127100 |
43.92 |
|
TF-3; AP2, Similar to AP2 domain containing protein RAP2.6 |
Os08g0474000 |
51.32 |
|
TF-4; MYB, Similar to LHY protein |
Os04g0583900 |
6.12 |
|
TF-5; NAM, No apical meristem (NAM) domain containing protein |
Os03g0327800 |
5.37 |
|
TF-6; MYB, Similar to Myb-related transcription factor LBM1 |
Os07g0558100 |
6.04 |
|
TF-7; MYB, Similar to Typical P-type R2R3 Myb protein |
Os01g0975300 |
−7.52 |
|
TF-8; AP2, RAV-like protein |
Os01g0141000 |
−4.17 |
|
Response to biotic stress |
|
R-1; Similar to Beta-1,3-glucanase-like protein |
Os01g0944900 |
19.29 |
|
R-2; Similar to Lipoxygenase 2.3, chloroplast precursor |
Os02g0194700 |
10.9 |
|
R-3; Seven transmembrane protein MLO2 |
Os03g0129100 |
8.27 |
|
R-4; Protein phosphatase 2C family protein |
Os06g0698300 |
7 |
|
R-5; Similar to NtPRp27 |
Os10g0490800 |
14.22 |
|
Similar to Iron-phytosiderophore transporter protein yellow stripe 1 |
Os02g0649900 |
−6.28 |
|
Similar to Pathogen-related protein |
Os01g0731100 |
−8.17 |
|
Response to oxidative stress |
|
POD-1; Peroxidase |
Os03g0235000 |
−42.2 |
|
POD-2; Peroxidase |
Os07g0677100 |
−7.73 |
|
POD-3; Peroxidase |
Os07g0677200 |
−4.79 |
|
POD-4; Similar to Peroxidase 47 precursor |
Os08g0113000 |
−14.6 |
|
Response to abiotic stress |
|
Late embryogenesis abundant (LEA) group 1 family |
Os04g0589800 |
25.25 |
|
Similar to Low-temperature induced protein lt101.2 |
Os05g0122700 |
16.92 |
|
Similar to Allyl alcohol dehydrogenase |
Os04g0497000 |
11.48 |
|
Similar to 1-Cys peroxiredoxin; |
Os07g0638300 |
9.16 |
|
Similar to Small heat stress protein class CIII |
Os02g0782500 |
8.33 |
|
GRAM domain containing protein; |
Os12g0478100 |
7.53 |
|
Similar to Acyl-CoA-binding protein 2 (ACBP 2) |
Os06g0115300 |
6.89 |
|
Hly-III related proteins family protein |
Os06g0652200 |
6.54 |
|
Similar to Dehydrin DHN1 (B8) |
Os01g0702500 |
6.42 |
|
Heat shock protein DnaJ, N-terminal domain containing protein |
Os01g0606900 |
6.34 |
|
EFA27 for EF hand, abscisic acid, 27kD |
Os04g0511200 |
4.86 |
|
Glycoside hydrolase, family 17 protein |
Os01g0860800 |
4.44 |
|
Similar to germin-like protein 8 |
Os08g0189850 |
−6.45 |
|
Similar to germin-like protein 12 |
Os08g0189900 |
−6.92 |
References
- Ahloowalia BS, Maluszynski M, Nichterlein K. 2004. Global impact of mutation-derived varieties. Euphytica. 135: 187-204.
- Cho SK, Jung KW, Jeung JU, Kang KH, Shim KS, You MK, Yoo KS, Ok SH, Shin JS. 2005. Analysis of differentially expressed transcripts from planthopper-infested wild rice (Oryza minuta). Plant Cell Rep. 24: 59-67.
- Chu S, DeRisi J, Eisen M, Mulholland J, Botstein D, Brown PO, Herskowitz I. 1998. The transcriptional program of sporulation in budding yeast. Science. 282: 699-705.
- Chu Z, Yuan M, Yao J, Ge X, Yuan B, Xu C, Li X, Fu B, Li Z, Bennetzen JL, Zhang Q, Wang S. 2006. Promoter mutations of an essential gene for pollen development result in disease resistance in rice. Genes Dev. 20: 1250-1255.
- Dai LY, Liu XL, Xiao YH, Wang GL. 2007. Recent advances in cloning and characterization of disease resistance genes in rice. J Integr Plant Biol. 49: 112-119.
- Desaki Y, Miya A, Venkatesh B, Tsuyumu S, Yamane H, Kaku H, Minami E, Shibuya N. 2006. Bacterial lipopolysaccharides induce defense responses associated with programmed cell death in rice cells. Plant Cell Physiol. 47: 1530-1540.
- Devoto A, Piffanelli P, Nilsson I, Wallin E, Panstruga R, von Heijne G, Schulze-Lefert P. 1999. Topology, subcellular localization, and sequence diversity of the Mlo family in plants. J Biol Chem. 274: 34993-35004.
- Feng F, Yang F, Rong W, Wu X, Zhang J, Chen S, He C, Zhou JM. 2012. A Xanthomonas uridine 5′-monophosphate transferase inhibits plant immune kinases. Nature. 485: 114-118.
- Fujimoto SY, Ohta M, Usui A, Shinshi H, Ohme-Takagi M. 2000. Arabidopsis ethylene-responsive element binding factors act as transcriptional activators or repressors of GCC box-mediated gene expression. Plant Cell. 12: 393-404.
- Fujiwara S, Tanaka N, Kaneda T, Takayama S, Isogai A, Che FS. 2004. Rice cDNA microarray-based gene expression profiling of the response to flagellin perception in cultured rice cells. Mol Plant-Microbe Interact. 17: 986-998.
- Goff SA, Ricke D, Lan TH, Presting G, Wang R, Dunn M, Glazebrook J, Sessions A, Oeller P, Varma H, Hadley D, Hutchison D, Martin C, Katagiri F, Lange BM, Moughamer T, Xia Y, Budworth P, Zhong J, Miguel T, Paszkowski U, Zhang S, Colbert M, Sun WL, Chen L, Cooper B, Park S, Wood TC, Mao L, Quail P, Wing R, Dean R, Yu Y, Zharkikh A, Shen R, Sahasrabudhe S, Thomas A, Cannings R, Gutin A, Pruss D, Reid J, Tavtigian S, Mitchell J, Eldredge G, Scholl T, Miller RM, Bhatnagar S, Adey N, Rubano T, Tusneem N, Robinson R, Feldhaus J, Macalma T, Oliphant A, Briggs S. 2002. A draft sequence of the rice genome (Oryza sativa L. ssp. japonica). Science. 296: 92-100.
- Gu K, Yang B, Tian D, Wu L, Wang D, Sreekala C, Yang F, Chu Z, Wang GL, White FF, Yin Z. 2005. R gene expression induced by a type-III effector triggers disease resistance in rice. Nature. 435: 1122-1125.
- Hao D, Ohme-Takagi M, Sarai A. 1998. Unique mode of GCC box recognition by the DNA-binding domain of ethylene-responsive element-binding factor (ERF domain) in plant. J Biol Chem. 273: 26857-26861.
- Higashi K, Ishiga Y, Inagaki Y, Toyoda K, Shiraishi T, Ichinose Y. 2008. Modulation of defense signal transduction by flagellin-induced WRKY41 transcription factor in Arabidopsis thaliana. Mol Genet Genomics. 279: 303-312.
- Hirayama T, Shinozaki K. 2010. Research on plant abiotic stress responses in the post-genome era: past, present and future. Plant J. 61: 1041-1052.
- Iyer AS, McCouch SR. 2004. The rice bacterial blight resistance gene xa5 encodes a novel form of disease resistance. Mol Plant Microbe Interact. 17: 1348-1354.
- Jach G, Gornhardt B, Mundy J, Logemann J, Pinsdorf E, Leah R, Schell J, Maas C. 1995. Enhanced quantitative resistance against fungal disease by combinatorial expression of different barley antifungal proteins in transgenic tobacco. Plant J. 8: 97-109.
- Jiang GH, Xia ZH, Zhou YL, Wan J, Li DY, Chen RS, Zhai WX, Zhu LH. 2006. Testifying the rice bacterial blight resistance gene xa5 by genetic complementation and further analyzing xa5 (Xa5) in comparison with its homolog TFIIAgamma1. Mol Genet Genomics. 275: 354-366.
- Kagaya Y, Ohmiya K, Hattori T. 1999. RAV1, a novel DNA-binding protein, binds to bipartite recognition sequence through two distinct DNA-binding domains uniquely found in higher plants. Nucleic Acids Res. 27: 470-478.
- Kauffman HE, Reddy APK, Hsieh SPV, Marca SD. 1973. An improved technique for evaluation of resistance of rice varieties to Xanthomonas oryzae. Plant Dis Rep. 57: 537-541.
- Kim KM, Cho SK, Shin SH, Kim GT, Lee JH, Oh BJ, Kang KH, Hong JC, Choi JY, Shin JS, Chung YS. 2005. Analysis of differentially expressed transcripts of fungal elicitor- and wound-treated wild rice (Oryza grandiglumis). J Plant Res. 118: 347-354.
- Kim MC, Panstruga R, Elliott C, Muller J, Devoto A, Yoon HW, Park HC, Cho MJ, Schulze-Lefert P. 2002. Calmodulin interacts with MLO protein to regulate defence against mildew in barley. Nature. 416: 447-451.
- Kottapalli KR, Rakwal R, Satoh K, Shibato J, Kottapalli P, Iwahashi H, Kikuchi S. 2007. Transcriptional profiling of indica rice cultivar IET8585 (Ajaya) infected with bacterial leaf blight pathogen Xanthomonas oryzae pv oryzae. Plant Physiol Biochem. 45: 834-850.
- Kurata N, Yamazaki Y. 2006. Oryzabase. An integrated biological and genome information database for rice. Plant Physiol. 140: 12-17.
- Li Q, Chen F, Sun L, Zhang Z, Yang Y, He Z. 2006. Expression profiling of rice genes in early defense responses to blast and bacterial blight pathogens using cDNA microarray. Physiological and Mol Plant Pathol. 68: 51-60.
- Lim CJ, Lee HY, Kim WB, Ahmad R, Moon JS, Kim DS, Kwon SY. 2010. Screening of gamma radiation-induced pathogen resistance rice lines against Xanthomonas oryzae pv. oryxae. J Radiation Ind. 4: 209-213.
- Liu Q, Kasuga M, Sakuma Y, Abe H, Miura S, Yamaguchi-Shinozaki K, Shinozaki K. 1998. Two transcription factors, DREB1 and DREB2, with an EREBP/AP2 DNA binding domain separate two cellular signal transduction pathways in drought- and low-temperature-responsive gene expression, respectively, in Arabidopsis. Plant Cell. 10: 1391-1406.
- Maldonado-Calderon MT, Sepulveda-Garcia E, Rocha-Sosa M. 2012. Characterization of novel F-box proteins in plants induced by biotic and abiotic stress. Plant Sci. 185–186: 208-217.
- Mosblech A, Feussner I, Heilmann I. 2009. Oxylipins: structurally diverse metabolites from fatty acid oxidation. Plant Physiol Biochem. 47: 511-517.
- Passardi F, Cosio C, Penel C, Dunand C. 2005. Peroxidases have more functions than a Swiss army knife. Plant Cell Rep. 24: 255-265.
- Piffanelli P, Zhou F, Casais C, Orme J, Jarosch B, Schaffrath U, Collins NC, Panstruga R, Schulze-Lefert P. 2002. The barley MLO modulator of defense and cell death is responsive to biotic and abiotic stress stimuli. Plant Physiol. 129: 1076-1085.
- Saibo NJ, Lourenco T, Oliveira MM. 2009. Transcription factors and regulation of photosynthetic and related metabolism under environmental stresses. Ann Bot. 103: 609-623.
- Sakuma Y, Liu Q, Dubouzet JG, Abe H, Shinozaki K, Yamaguchi-Shinozaki K. 2002. DNA-binding specificity of the ERF/AP2 domain of Arabidopsis DREBs, transcription factors involved in dehydration- and cold-inducible gene expression. Biochem Biophys Res Commun. 290: 998-1009.
- Santos AP, Serra T, Figueiredo DD, Barros P, Lourenco T, Chander S, Oliveira MM, Saibo NJ. 2011. Transcription regulation of abiotic stress responses in rice: a combined action of transcription factors and epigenetic mechanisms. OMICS. 15: 839-857.
- Scharf KD, Berberich T, Ebersberger I, Nover L. 2012. The plant heat stress transcription factor (Hsf) family: structure, function and evolution. Biochim Biophys Acta. 1819. 104-119.
- Schena M, Shalon D, Davis RW, Brown PO. 1995. Quantitative monitoring of gene expression patterns with a complementary DNA microarray. Science. 270: 467-470.
- Schultheiss H, Dechert C, Kogel KH, Huckelhoven R. 2002. A small GTP-binding host protein is required for entry of powdery mildew fungus into epidermal cells of barley. Plant Physiol. 128: 1447-1454.
- Sela-Buurlage MB, Ponstein AS, Bres-Vloemans SA, Melchers LS, Van Den Elzen P, Cornelissen B. 1993. Only Specific Tobacco (Nicotiana tabacum) Chitinases and [beta]-1,3-Glucanases Exhibit Antifungal Activity. Plant Physiol. 101: 857-863.
- Shimizu T, Satoh K, Kikuchi S, Omura T. 2007. The repression of cell wall- and plastid-related genes and the induction of defense-related genes in rice plants infected with Rice dwarf virus. Mol Plant-Microbe Interact. 20: 247-254.
- Silipo A, Molinaro A, Sturiale L, Dow JM, Erbs G, Lanzetta R, Newman MA, Parrilli M. 2005. The elicitation of plant innate immunity by lipooligosaccharide of Xanthomonas campestris. J Biol Chem. 280: 33660-33668.
- Singh K, Foley RC, Onate-Sanchez L. 2002. Transcription factors in plant defense and stress responses. Curr Opin Plant Biol. 5: 430-436.
- Sohn KH, Lee SC, Jung HW, Hong JK, Hwang BK. 2006. Expression and functional roles of the pepper pathogen-induced transcription factor RAV1 in bacterial disease resistance, and drought and salt stress tolerance. Plant Mol Biol. 61: 897-915.
- Song WY, Wang GL, Chen LL, Kim HS, Pi LY, Holsten T, Gardner J, Wang B, Zhai WX, Zhu LH, Fauquet C, Ronald P. 1995. A receptor kinase-like protein encoded by the rice disease resistance gene, Xa21. Science. 270: 1804-1806.
- Sun X, Cao Y, Yang Z, Xu C, Li X, Wang S, Zhang Q. 2004. Xa26, a gene conferring resistance to Xanthomonas oryzae pv. oryzae in rice, encodes an LRR receptor kinase-like protein. Plant J. 37: 517-527.
- Tu J, Zhang G, Datta K, Xu C, He Y, Zhang Q, Khush GS, Datta SK. 2000. Field performance of transgenic elite commercial hybrid rice expressing bacillus thuringiensis delta-endotoxin. Natl Biotechnol. 18: 1101-1104.
- van Loon LC, Rep M, Pieterse CM. 2006. Significance of inducible defense-related proteins in infected plants. Annu Rev Phytopathol. 44: 135-162.
- Xin XF, Nomura K, Underwood W, He SY. 2013. Induction and suppression of PEN3 focal accumulation during Pseudomonas syringae pv. tomato DC3000 infection of Arabidopsis. Mol Plant-Microbe Interact. 26: 861-867.
- Yoshimura S, Yamanouchi U, Katayose Y, Toki S, Wang ZX, Kono I, Kurata N, Yano M, Iwata N, Sasaki T. 1998. Expression of Xa1, a bacterial blight-resistance gene in rice, is induced by bacterial inoculation. Proc Natl Acad Sci U S A. 95: 1663-1668.
- Zhai W, Wang W, Zhou Y, Li X, Zheng X, Zhang Q, Wang G, Zhu L. 2002. Breeding bacterial blight-resistant hybrid rice with the cloned bacterial blight resistance gene Xa21. Mol Breed. 8: 285-293.
- Zhang S, Song W-Y, Chen L, Ruan D, Taylor N, Ronald P, Beachy R, Fauquet C. 1998. Transgenic elite Indica rice varieties, resistant to Xanthomonas oryzae pv. oryzae. Mol Breed. 4: 551-558.