Abstract
Hybrid sterility is the major obstacle that can act as a barrier to genetic recombination and limits favorable gene transfer during inter-subspecific crosses in rice. However, hybrid sterility can be overcome by utilization of wide-compatible varieties (WCV). In the present study, two F2 populations generated from crosses between a wide-compatibility line (HWC-line) and two Korean varieties, Dasan and Hwacheong were evaluated for eight agronomic traits. A total of 157 molecular markers consisted of 116 STS, 40 SSR and 1 FNP were used to create genetic linkage maps spanning all 12 chromosomes. Twenty-one main-effect QTLs (M-QTLs) were identified in HWC-line/Dasan (HD) population. These loci are populated with two QTLs for culm length, one for spikelet per panicle, one for spikelet fertility, four for grain length, five for grain width, five for grain shape, and three for 100 grain-weight. In HWC-line/Hwacheong (HH) population, 17 QTLs were detected including two QTLs for culm length, one for panicle length, one for spikelet fertility, five for grain length, three for grain width, three for grain shape, and two for 100-grain weight. Of the total 34 QTLs found in the two F2 populations, 9 QTLs associated with culm length, grain length, grain width and grain shape were newly identified in this study. These QTLs will be useful for further understanding the genetic basis of agronomic traits and for developing markers for selection in rice breeding. In addition, HWC-line could be used as a bridge for inter-subspecies crosses overcoming hybrid sterility.
-
Key words: Indica, Japonica, QTL analysis, Rice, Wide compatibility
INTRODUCTION
Rice is the most important food crop in Asia. Asian rice (
Oryza sativa L.) was domesticated from wild relative
Oryza rufipogon and differentiated into two subspecies,
indica and
japonica, on the basis of sterility in F
1 hybrids between them (
Oka 1988). Conventional cross hybridization and selection is a widely used strategy for developing new cultivars with important agronomic traits in rice breeding program. Cross hybridization and selection has provided on average about a 1% increase in the annual yield potential of rice since the development of IR8, the first improved semi-dwarf rice variety (
Peng et al. 2000). However, hybrid sterility in rice has been a major obstacle in the transfer of useful genes by inter-subspecific crosses and lowers the productivity of the hybrid rice.
Ikehashi and Araki (1986) found that this sterility barrier can be overcome by the utilization of a wide-compatibility variety (WCV) carrying the
S5n allele, such that hybrids of either
indica/WCV or
japonica/WCV were highly fertile. Recently,
S5 gene was cloned and its molecular mechanism was elucidated (
Chen et al. 2008;
Yang et al. 2012). Therefore, the use of these wide compatibility variety may provide a tool to overcome the sterility barrier between
indica and
japonica subspecies.
Development of molecular markers, construction of rice molecular linkage maps (
Kurata et al. 1994;
McCouch et al. 2002;
Temnykh et al. 2000), and the development of statistical models in quantitative genetics greatly facilitate the study of quantitatively inherited complex traits (
Tanksley 1993;
Zeng 1994). The identification of QTLs provides the first step toward dissecting the molecular basis of complex traits in crops. Recent advance in the positional cloning techniques has allowed it to become one of the most effective means to clone QTLs. So far, more than 15 QTLs including for the growth period, plant architecture, stress tolerance, grain shape and yield of rice have been successfully cloned. Moreover, comparison of the linkage maps among populations within a single or between different rice varieties can give valuable insight into understanding various parameters affecting recombination event, including the direction of crossing and/or parental varieties, genomic differences among parents, and the nature of QTLs and their application in marker-assisted breeding programs (
Antonio et al. 1996;
He et al. 2001;
Liang et al. 2011;
Qiao et al. 2008).
However, there were only limited studies comparing constructed maps with detected QTLs in different rice populations derived from crosses between WCV and indica and/or japonica cultivars. Thus, in this study, we constructed molecular linkage maps and detected QTLs for some agronomic traits in two F2 populations derived from crosses between a WCV line and Dasan (Korean Tongil-type cultivar, derived from an indica × japonica cross and similar to indica in its genetic make-up) and Hwacheong (Korean temperate japonica cultivar).
MATERIALS AND METHODS
Plant material
The HWC-line, a line showing wide compatibility when crossed to either
indica or
japonica cultivars, was found and maintained at the Experimental Farm of Seoul National University, Suwon, Korea (
Kim 1999). Each of the two populations comprising 190 F
2 plants derived from the crosses between HWC-line and two Korean cultivars, Dasan (Korean
Tongil-type cultivar) and Hwacheong (Korean temperate
japonica cultivar), were used to construct the genetic linkage maps and QTL mapping analysis. In 2010, the F
2 populations including three parental lines were planted at one plant per hill and grown by conventional cultural practices at the Experimental Farm of Seoul National University in Suwon, Korea. The F
2 plants that headed before September 1 were used in this study.
A total of eight agronomic traits including culm length (CL), panicle length (PL), spikelet per panicle (SPP), spikelet fertility (SF), grain length (GL), grain width (GW), grain shape (length width ratio, GS), and 100-grain weight (100GW) were measured in two F2 populations and three parents. CL was measured in centimeters (cm) from the soil surface to the neck of the tallest tiller. PL was measured in cm from panicle neck to panicle tip. SPP was calculated as the average number of spikelet per panicle. SF was calculated as filled grain per total number of spikelet in a panicle, expressed as a percentage. Harvested rice was air-dried and stored at room temperature before measuring. Ten randomly chosen, fully filled grains derived from each parent, and F2:3 were used to measure GL, GW and GS at 0.01 mm precision and the values were averaged as the measurements for the plant. The GL and GW were evaluated using digital microscope and measuring software. 100GW was measured in grams as the weight of 100 fully ripened (14% moisture) grains per plant.
Correlation coefficients of eight traits were calculated to determine the correlations between eight traits in the two F
2 populations using PROC CORR in the SAS 9.1. 3 (
SAS Institute Inc. 2004).
At the maximum tillering stage, young leaf tissues of parents and each F
2 plant were harvested in field-grown, and genomic DNA was extracted using the modified CTAB method as described in
Murray and Thompson (1980).
Numerous Sequence-Tagged Site (STS) markers designed at Crop Molecular Breeding Lab, Seoul National University (unpublished), subspecies-specific STS (SS-STS) markers in
Chin et al. (2007) and Simple Sequence Repeat(SSR) markers in
Temnykh et al. (2000) and
McCouch et al. (2002) were used in this study. One Functional Nucleotide Polymorphism (FNP) marker, qSW5 designed from primer data of
Shomura et al. (2008) was employed for genotyping
qSW5 allele. The primers sequence of qSW5 are 5′-CGTCTTGCAACCAACGCCGATGTTATAC-3′ (N1212del-F) for forward and 5′-GCATCAGCATCACGCATCTTTC-3′ (M23-R) for reverse. Screening of polymorphic STS and SSR markers among three parents, HWC-line, Dasan and Hwacheong was conducted. The markers that are polymorphic and relatively easy to score were used in the construction of the linkage map to cover the entire genome.
For PCR amplification of STS and SSR markers, each 10 μl reaction mixture contained 20 ng of template DNA, 0.25 μM of each primer, 1.25 mM of dNTP, 1× of PCR buffer and 0.5 U of Taq DNA polymerase. Amplification was carried out in a PTC220 dual 96-well and 384-well thermocycler (MJ Research, USA) as follows: 5 min at 94°C, followed by 35 cycles of 30 sec at 94°C, 30 sec at 55°C or 58°C, 30 sec at 72°C, and 10 min at 72°C for final extension. PCR products were separated on 3% agarose gel in 0.5× TBE buffer.
For PCR amplification of qSW5 marker, a 50 μl reaction mixture was prepared containing 100 ng of template DNA, 0.4 μM of each primer, 1.6 mM of dNTP Mixture, 2.5 mM of MgCl2, 5 μl of 10× LA PCR buffer II (Mg2+free) and 2.5 U of TaKaRa LA Taq DNA polymerase. Amplification was carried out in a PTC220 dual 96-well thermocycler (MJ Research, USA) as follows: 1 min at 94°C, followed by 30 cycles of 10 sec at 98°C, 3 min 30 sec at 68°C, and 10 min at 72°C for final extension. PCR products were separated on 1% agarose gel in 0.5× TBE buffer.
Linkage map construction and QTL analysis
The molecular linkage map was constructed using the JoinMap 4.0 software (
van Ooijen 2006). The Kosambi mapping function (
Kosambi 1944) with a minimum LOD (Logarithm of the odds) threshold of 3.0 and a linkage threshold significance of
p=0.05 was applied to transform the recombination frequencies into the genetic distances in centiMorgans.
QTL analysis were performed for eight agronomic traits (CL, PL, SPP, SF, GL, GW, GS and 100GW). QTL mapping was conducted independently for each of the two F
2 populations using QTLNetwork (version 2.1) software (
Yang et al. 2008), which is based on mapping methodology outlined in
Yang et al. (2007). QTLNetwork 2.1 implements a mixed-model based composite interval mapping (CIM) method and allows to simultaneously detect main-effect and epistatic QTLs in population. Simply, QTLNetwork analyzes the marker intervals, selects the candidate intervals and uses them as cofactors in a one-dimensional genome scan for putative QTL. The mapping procedures are conducted in the framework of a mixed linear model, and an
F-statistic based on Henderson method 3 is used for hypothesis tests. A total of 1,000 permutation tests were used to calculate the critical
F-value to control the genomewise type 1 error. An experiment-wise significance level of p=0.05 was maintained for QTL detection. For the genome scan, the testing window size, filtration window size and walk-speed were fixed as 10, 10 and 1 cM, respectively. QTL effects and QTL confidence intervals were estimated with a Bayesian method via the summary of the Gibbs samplers (Gibbs sample size=20,000). Detected main-effect QTLs were named according to
McCouch et al. (1997).
In order to identify the variation of
sd1 locus among HWC-line, Dasan and Hwacheong, the coding region of
sd1 was sequenced using designed primer sets (
Table 1). The PCR products were purified using a PCR purification kit (iNtRON Biotechnology, Korea) for TA cloning. The purified PCR products were inserted into pGEM-T Easy Vector (Promega, USA) and then transformed into the
E. coli. The plasmid DNA were extracted using DNA-spin Plasmid DNA Purification Kit (iNtRON Biotechnology, Korea) and further sequenced with an ABI 3700 DNA Sequencer (Applied Biosystems, Inc., CA, USA). The obtained sequences were compared by means of CodonCode Aligner software (version 5.0.2; Codon Code Corporation).
RESULTS
Phenotype of agronomic traits
The plant architecture and grain shape of three parents, HWC-line, Dasan, and Hwacheong, are shown in
Fig. 1. HWC-line showed tall culm length and long slender grain shape. The phenotypic data for nine agronomic traits of three parents and eight agronomic traits of two F
2 populations in 2010 are presented in
Table 2. The three parents ex hibited notable differences in all nine traits. The extent of difference between HWC-line and Hwacheong was larger than that of between HWC-line and Dasan for seven agronomic traits except CL and 100GW.
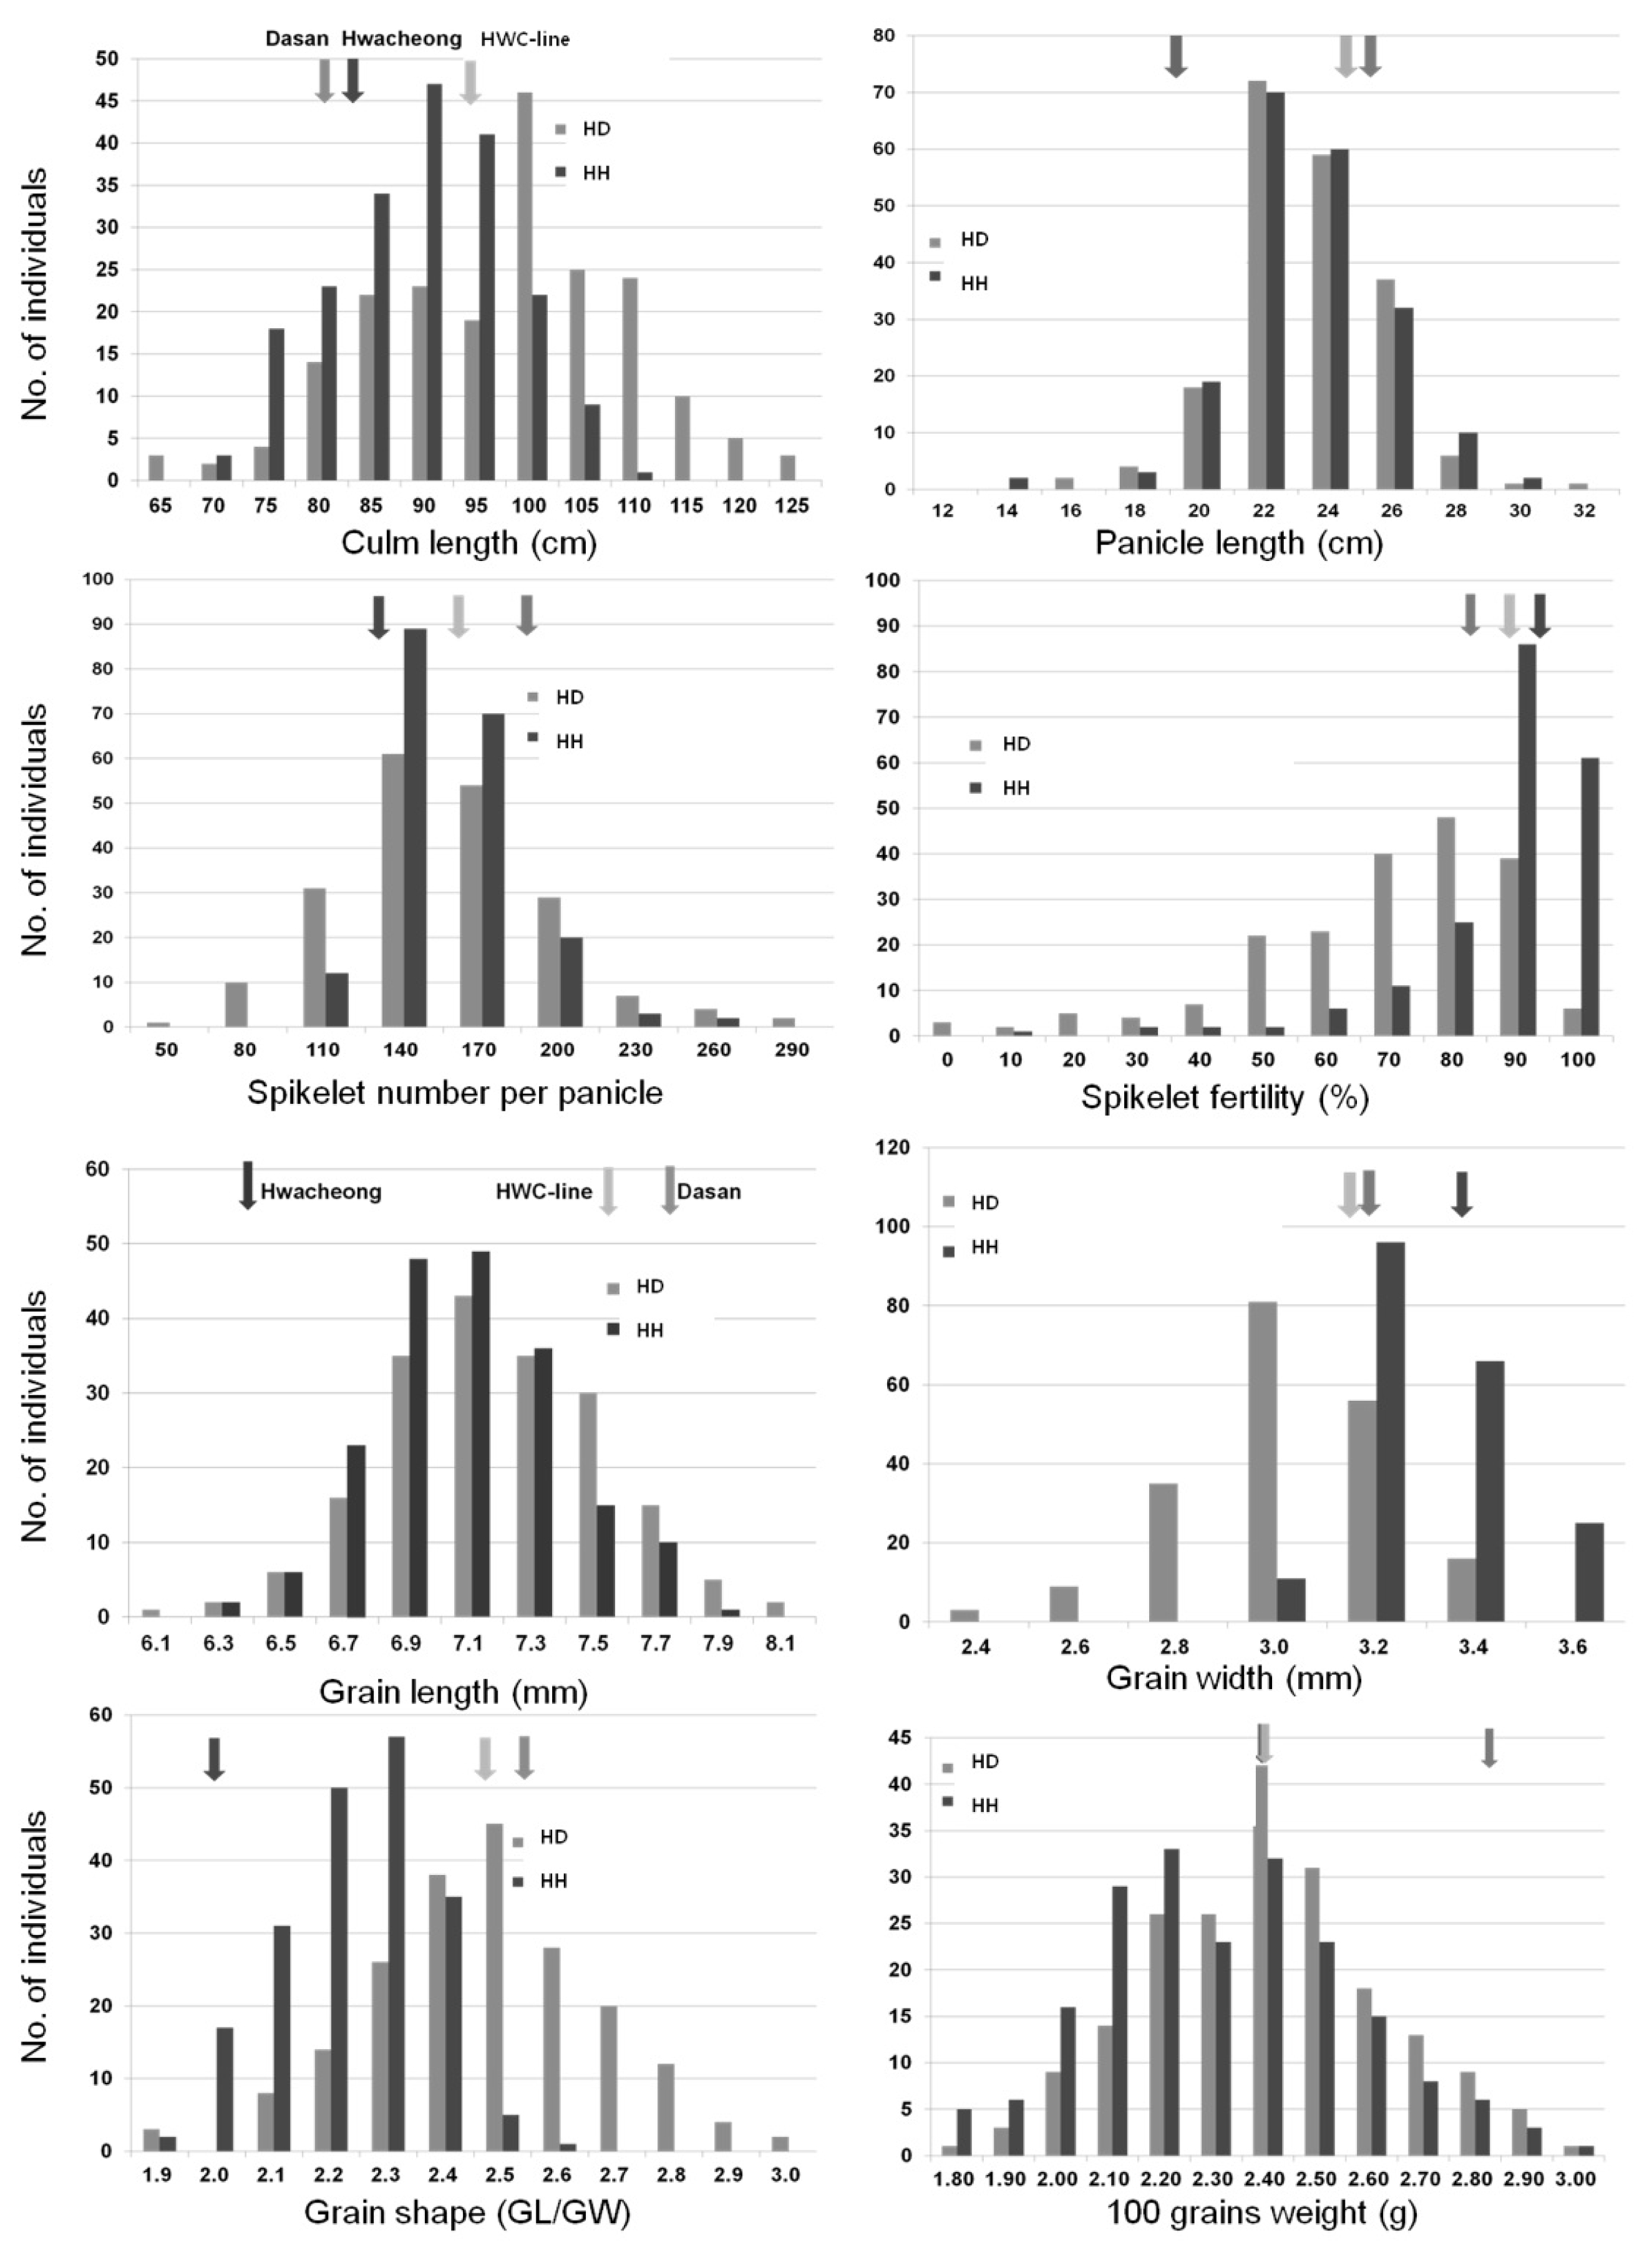
The frequency distribution of phenotype for eight agronomic traits in the two F
2 populations derived from crosses between HWC-line and Dasan (HD), HWC-line and Hwacheong (HH) are shown in
Fig. 2. In the F
2 populations, all traits varied widely with continuous distribution and showed transgressive segregation. The amount of variation was higher in HD population than HH population for CL, SPP, SF, GL, GW and GS. A large amount of overlapping proportions was observed in the two F
2 populations except SF, GW and GS. For spikelet fertility, the distribution was skewed toward high fertility in HH population. For GW and GS, the distributions were skewed towards each paternal parent in two F
2 populations.
Correlation coefficients among eight agronomic traits are presented in
Table 3. Significant positive correlations were detected between CL with PL, GL and GW, between PL with SPP, GL and GS in both HD and HH population. In HD population, significant positive correlations were found between CL with 100GW and between GL with GW. SPP negatively correlated with 100GW in HD population with significance. In HH population, significant positive and negative correlations were identified between 100GW with PL and SF, and between SF with GL and GW, respectively. The directions (+ or −) and degree of correlation for most correlations were similar to those observed in previous study (
Rahman et al. 2007;
Thomson et al. 2003;
Yoon et al. 2006).
A total of 723 molecular markers (293 STS, 55 SS-STS, 374 SSR and 1 FNP) dispersed throughout the rice genome were used to survey polymorphism among three parents, HWC-line, Dasan and Hwacheong. Of these, 560 (77.5%) markers showed polymorphism between HWC-line and Dasan, 118 (16.3%) markers presented polymorphism between HWC-line and Hwacheong (
Table 4).
Two F
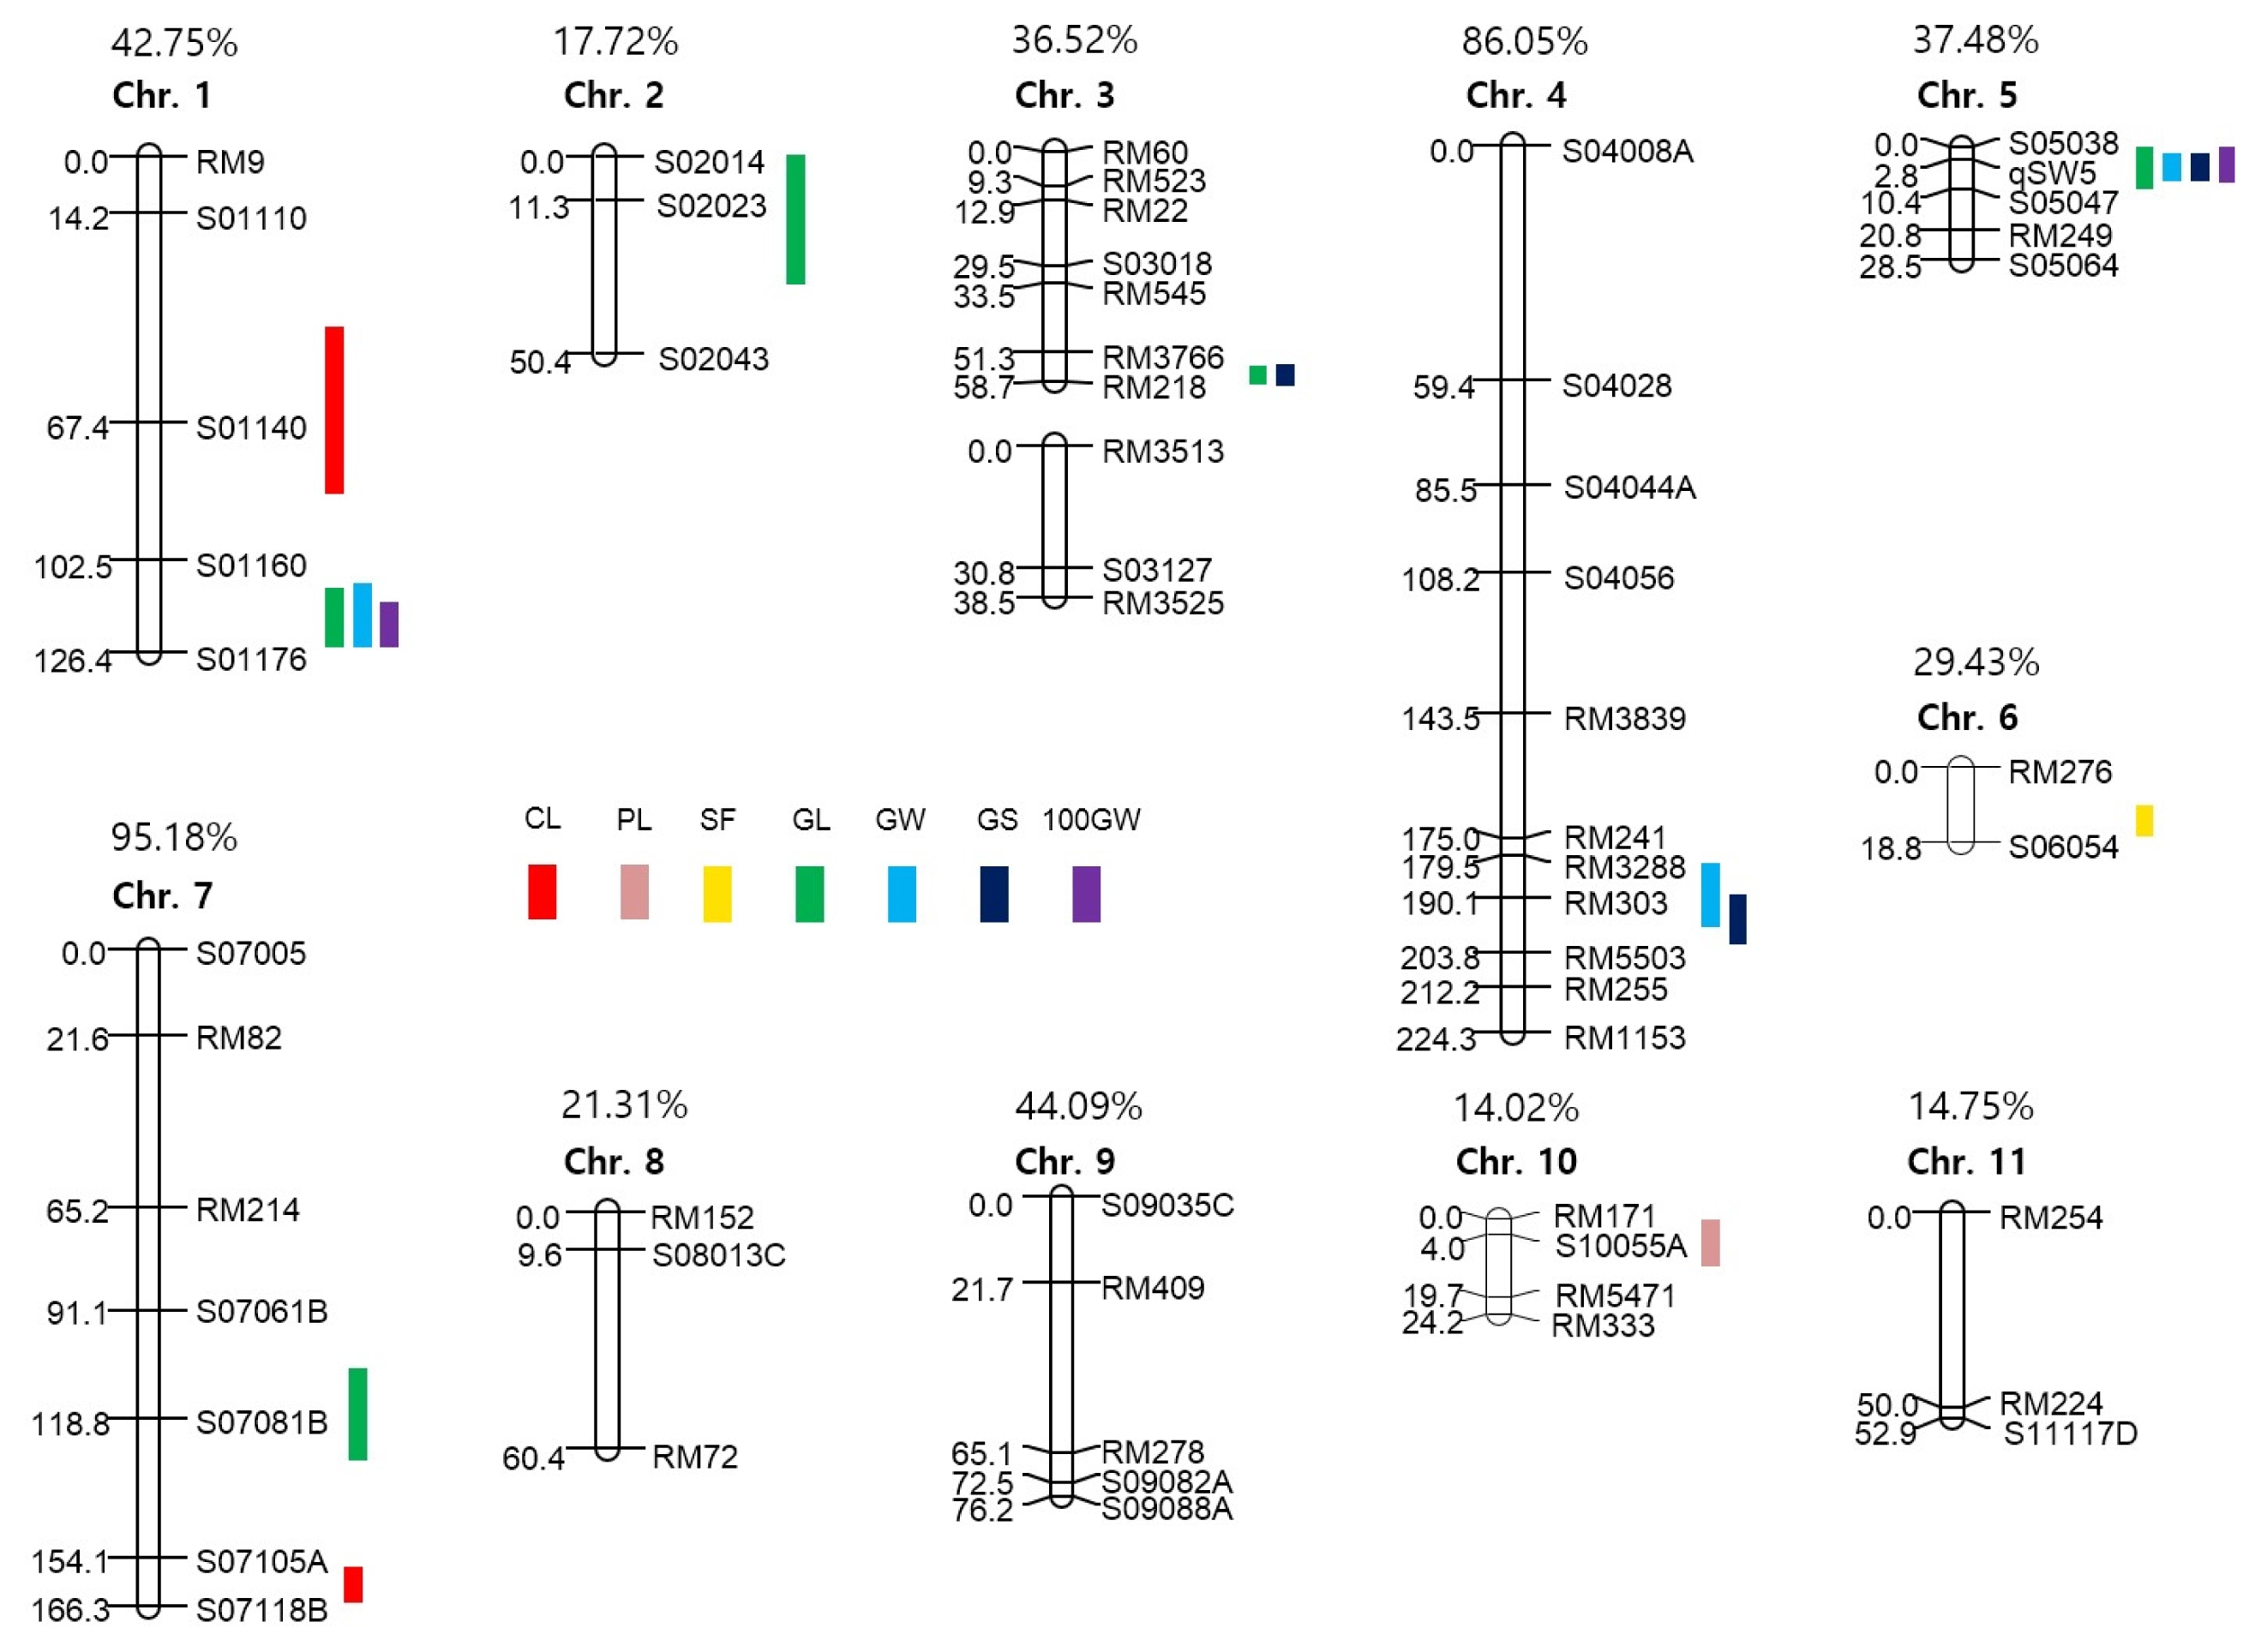
2 populations obtained from each cross of HWC-line/Dasan and HWC-line/Hwacheong, were used for constructing two genetic linkage maps to identify the QTLs governing eight agronomic traits (
Fig. 3 and
4). The total length of all the linkage group in HD was longer than that of the HH population, except chromosome 4 and 7. In HD population, of the total 560 polymorphic markers used to construct a linkage map, 106 markers consisting of 93 STS and 13 SSR were mapped on 12 chromosomes. Whereas in HH population, 58 out of 118 polymorphic markers consisting of 28 STS, 29 SSR and 1 FNP were mapped on 11 chromosomes with no markers on chromosome 12. The total linkage map length constructed in the HD population was 1942.6 cM with an average distance between two adjacent markers of 18.33 cM, and that in HH population has a total length of 925.53 cM with an average distance of 15.96 cM between adjacent markers. The linkage map coverage of whole genome in HD and HH population were 94.89% and 37.77%, respectively (
Fig. 3 and
4).
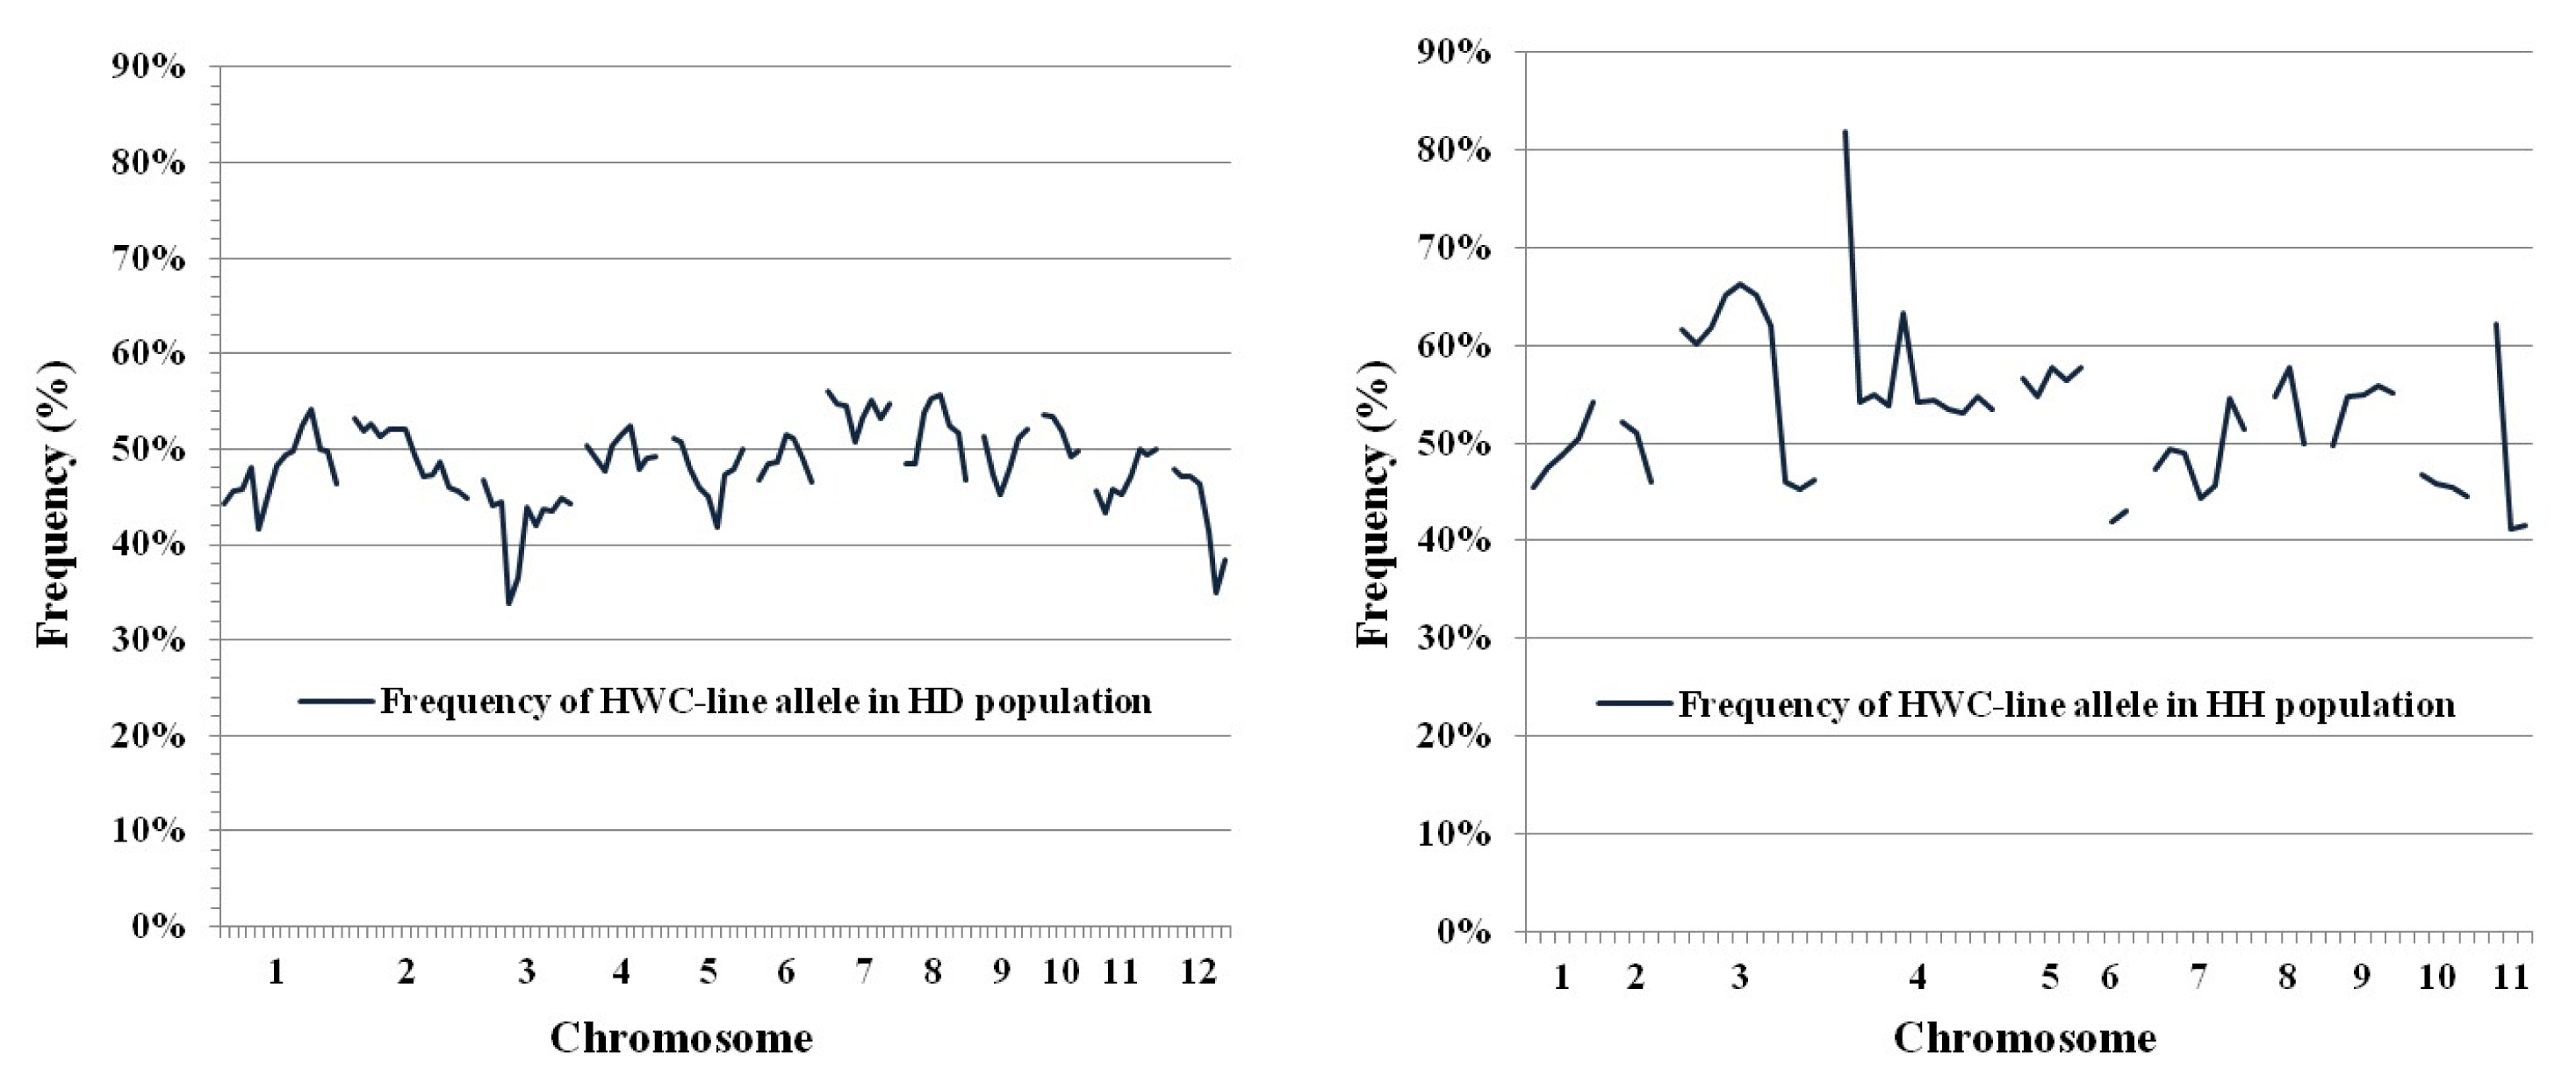
Significant marker segregation distortion, based on the Chi-square test at
P < 0.05, was identified in the two F
2 populations, as shown by deviations from the expected 1:2:1 (HWC-line homozygotes:heterozygotes:DS or HC homozygotes) ratio. In the HD population, 20 marker loci (18.9%) of 106 markers used, showed segregation distortion with 16 loci in favor of the DS allele and one marker favoring the HWC-line allele. In the HH population, 21 marker loci (36.2% of the total) displayed distorted segregation, with 17 loci favoring the HWC-line and 4 markers favoring the HC allele. The distorted markers were allocated along nine chromosomes except chromosomes 7, 9 and 10. These markers made clusters of at least three neighboring loci on chromosomes 3 and 12 in the HD population and chromosomes 3, 5 and 11 in the HH population. As shown in the frequency of HWC-line alleles in the HD and HH population (
Fig. 5), theoretically, markers in F
2 population should show 50% of each allele from parents, but distorted loci exhibited frequency of HWC-line allele far deviated from 50%.
A total of 34 main-effect QTLs (M-QTLs) were detected for eight agronomic traits in the two F
2 populations. These M-QTLs were mapped on all 12 chromosomes except chromosomes 8, 11 and 12 (
Fig. 3,
4, and
Table 5). Of the 34 M-QTLs, four (
qcl1.1, qgw5, q100gw1 and
q100gw5) were identified in both populations. Three digenic epistatic QTLs (E-QTLs) for culm length and grain shape were identified in HD population, locations of which were found to be on chromosomes 3, 5 and 11 (
Table 6).
For culm length (CL), two major M-QTLs, qcl1.1 and qcl1.2 located on chromosome 1 and one E-QTLs located on chromosomes 5 and 11 were identified in HD population. The expressed phenotypic variations by each M-QTL were 37.2% and 39.1%, respectively. In the HH population, qcl1.1 and qcl7, which were located on chromosomes 1 and 7, showed 25.6% and 7.8% of Phenotype Variation Explained (PVE), respectively. The HWC-line allele caused an increase in CL in all M-QTL.
For panicle length (PL), only one M-QTL, qpl10 on chromosome 10 in the HH population, was detected with 1.0% PVE. The allele of HWC-line decreased PL at this locus. For spikelet per panicle (SPP), one M-QTL, qspp4, was mapped on chromosomes 4 in the HD population, and PVE of this QTL was 11.4%. The HWC-line allele increased SPP at this locus. For spikelet fertility (SF), two M-QTLs, qsf6 and qsf9, were individually identified on chromosome 6 in the HD population and 9 in HH, and PVEs of each locus were 11.6% and 7.8%, respectively. The HWC-line allele had a positive effect on spikelet fertility at these loci.
For grain length (GL), four M-QTLs (qgl1.1, qgl1.2, qgl2.2 and qgl6) were detected on chromosomes 1, 2 and 6 in the HD population. The PVEs of each locus were 11.7%, 12.7%, 7.9% and 11.6%, respectively. In the HH population, five M-QTLs (qgl1.3, qgl2.1, qgl3, qgl5 and qgl7) were identified on chromosomes 1, 2, 3, 5 and 7 for GL. The PVEs of each locus were 10.8%, 5.5%, 14.2%, 6.7% and 6.5%, respectively. HWC-line allele increased GL at 7 M-QTLs except qgl2.1 and qgl2.2, located on chromosome 2 in each population.
For grain width (GW), five M-QTLs (qgw2, qgw3.1, qgw3.2, qgw5 and qgw9) were detected on chromosomes 2, 3, 5 and 9 in the HD population. The PVEs of each locus were 8.6%, 5.5%, 5.4%, 34.0% and 3.0%, respectively. In the HH population, three M-QTLs for GW, qgw1, qgw4 and qgw5 were mapped on chromosomes 1, 4 and 5, and each PVE was 2.8%, 4.2% and 47.0%, respectively. The HWC-line allele increased GW at qgw1, qgw2, qgw3.1, qgw3.2 and qgw9 loci but decreased GW at qgw4 and qgw5.
For grain shape (GS: grain length to width ratio), five M-QTLs (qgs2, qgs3.1, qgs5.2, qgs5.3 and qgs6) and two E-QTLs, on chromosomes 3, 5 and 6, were identified in the HD population. The PVEs of each M-QTL ranged from 6.5% to 29.1%, explaining 76.3% of the total phenotypic variation of GS. The two E-QTLs for GS were detected to have interactions with three M-QTLs, qgs3.1, qgs5.2 and qgs5.3. In the HH population, three M-QTLs, qgs3.2, qgs4 and qgs5.1 located on chromosomes 3, 4 and 5, were detected and PVEs of each locus were 4.0%, 7.8% and 48.1%, respectively. Accordingly, the HWC-line alleles on qgs3.2, qgs4, qgs5.1, qgs5.2, qgs5.3 and qgs6 loci were detected to make the grains slender and those on qgs2 and qgs3.1 loci rounder.
For 100 grains weight (100GW), three M-QTLs, q100gw1, q100gw5 and q100gw9 were mapped on chromosomes 1, 5 and 9 in the HD population, and the PVEs of each locus were 13.8%, 16.9% and 8.2%, respectively. In the HH population, q100gw1 and q100gw5 were located on chromosomes 1 and 5 for 100GW, and the PVEs of each locus were 15.2% and 11.4%. The HWC-line allele increased 100GW at two loci, q100gw1 and q100gw9, but decreased at q100gw5.
Sequence variation of sd1 locus
The
qcl1.2 contains
sd1 locus cloned by
Sasaki et al. (2002) (
Fig. 6A). We sequenced the coding region of
sd1 among HWC-line, Dasan and Hwacheong (
Fig. 6B). Dasan represented 383 bp deletion and 1 bp insertion from exon 1 to exon 2. Furthermore, Dasan showed 1 bp substitution in exon 3 and 11 bp insertion in 3′-UTR. However, HWC-line and Hwacheong had identical sequence in
sd1 coding region.
DISCUSSION
The HWC-line had relatively taller culm length than Dasan or Hwacheong, with long slender shape of grain similar to that of Dasan (
Fig. 1 and
Table 2). F
1 hybrids derived from crosses between the HWC-line and
indica or
japonica cultivars showed moderate fertility. We have previously identified
S5 locus of HWC-line with
S5-n allele. In this study, our data showed that the peak of continuous distribution of spikelet fertility was around 80% in HWC-line/Dasan F
2 population, while, it skewed toward 90–100% in the HWC-line and Hwacheong F
2 population (
Fig. 2). Moreover, we detected two QTLs for spikelet fertility,
qsf9 and
qsf6, in the HD population and the HH population, respectively. In the HD population, HWC-line allele of
qsf9 decreased spikelet fertility, while HWC-line allele of
qsf6 increased spikelet fertility in HH population (
Table 5). These results imply that HWC-line is more compatible with
japonica than
indica, and there are other loci aside from
S5, such as
qsf9 and
qsf6, that control hybrid fertility.
A total of 723 molecular markers were screened to detect polymorphism among three parents, HWC-line, Dasan, and Hwacheong. Of the total markers screened, 560 (77.5%) markers in the HD population and 118 (16.3%) in HH were identified as polymorphic between each parent (
Table 4). In particular, only two (3.6%, S01140 and S05064) of 55 subspecies-specific STS markers tested exhibited polymorphism in HH population. On the other hand, 53 (96.4%) markers of the 55 subspecies-specific STS markers, except S01140 and S05064, were polymorphic in HD population. The S01140 was tightly linked with
qcl1.1, which possesses large additive effect of HWC-line allele and high PVE for CL in HH population. The S05064 was found to be located on chromosome 5, which had cluster of grain-related QTLs (
qgl5,
qgw5.2,
qgs5 and
q100gw5.2) making long and slender grain. Thus, S01140 and S05064 alleles of HWC-line are expected to be identical with those of Dasan. These molecular marker screening data, together with the distribution of spikelet fertility in the two F
2 populations, indicate that the genome architecture and genetic composition of HWC-line is similar to
japonica cultivar. However, three traits related with grain morphology, GL, GW and GS of HWC-line, were almost the same with Dasan, of which genetic make-up is similar to
indica.
The total length and physical coverage of the molecular linkage map for the HD population were 1942.6 cM and 94.89%, while in the HH population those were estimated as 925.53 cM and 37.77%. Although the linkage map of HD population covered all 12 chromosomes over the almost entire region, that for the HH population generated incomplete linkage map partially covering 11 chromosomes, leaving out chromosome 12 (
Fig. 3 and
4). As the lack of adequate polymorphic molecular markers between the parents, HWC-line and Hwacheong, is mainly attributable to this incomplete linkage map of HH population, newly developed SNP marker systems and recently available high-throughput genotyping technologies (
Chen et al. 2014;
Huang et al. 2009;
Thomson et al. 2012) are expected to provide more extensive polymorphic molecular markers and new genotyping platform to complete the linkage map of HH population.
Some markers used in this study displayed significant segregation distortion and clustered on chromosomes 3, 5, 11 and 12. The chromosomal location of these distorted marker clusters matched to what have been previously reported (
Chin et al. 2011;
Harushima et al. 2001;
2002;
Xu et al. 1997). In the HD population, 19 of the distorted 20 markers, with the exception of one on chromosome 8, were skewed in favor of the Dasan (
indica) alleles, a phenomenon consistent to those observed in previous studies (
Chin et al. 2011;
Harushima et al. 2002;
Xu et al. 1997). Of distorted 21 markers in the HH population, 17 were distorted towards the HWC-line alleles, with remaining four markers favoring the Hwacheong alleles. Thus, the result of segregation distortion in HH population suggests that HWC-line may contain some chromosomal regions that render the line to closely resemble
indica cultivar.
We identified QTLs underlying eight agronomic traits of HWC-line using two F
2 populations derived from HWC-line with Dasan and Hwacheong. A total of 34 M-QTLs with significant additive effects (
Table 5) and 3 E-QTLs (
Table 6) with epistatic effects were detected in this study. In order to examine if these QTLs are whether novel or previously reported, physical position of these detected QTLs were compared with existing QTLs using Gramene (
www.gramene.org) and Q-TARO (
Yonemaru et al. 2010) database. A total of nine novel QTLs were identified as a result. In the HD population, 21 M-QTLs and 3 E-QTLs were detected for CL, SPP, SF, GL GW, GS and 100GW. Of these M-QTLs, 2 for CL and 2 for GS were newly identified in this study. 17 M-QTLs were detected for CL, PL, SF, GL GW, GS and 100GW in the HH population. Of these, 6 M-QTLs for CL, GL, GW and GS were newly identified. Notably, one novel M-QTL for CL overlapped in both HD and HH populations.
Furthermore, two M-QTLs for CL,
qcl11.1 and
qcl7 loci were newly identified, and one pair of E-QTLs detected for CL in HD population, by contrast, had a low PVE, suggesting that M-QTLs are stronger in determining CL in this population. All HWC-line alleles for CL showed positive additive effect and provided tall culm length to HWC-line. Of these QTLs for CL,
qcl1.1 showed large additive effect and high PVE, and are considered to be the same locus in both HD and HH populations. We compared the physical position of markers with QTLs for CL on chromosome 1 (
Fig. 6A). The physical interval of
qcl1.1 in HH population includes those of
qcl1.1 and
qcl1.2 in HD population. The
qcl1.2 contains
sd1 locus cloned by
Sasaki et al. (2002). We identified
sd1 sequence variation among HWC-line, Dasan and Hwacheong (
Fig. 6B). Dasan showed some variation, but HWC-line and Hwacheong had identical sequence in
sd1 coding region. The
sd1 is candidate gene of
qcl1.2, but not
qcl.1. These marker physical positions and
sd1 sequence variation imply
qcl1.1 is putative novel QTL for CL. Fine mapping of
qcl1.1 is in progress. Also, a total of nine QTLs were detected for GL. Of these, two QTLs,
qgl1.3 and
qgl3, have not been identified in previous QTL studies, indicating putative novel QTLs for GL. It is notable that seven QTLs for GL, except
qgl2.1 and
qgl2.2, increased GL with maternal allele. This indicates that these HWC-line alleles made long grain shape of HWC-line. For GW, a total of seven QTLs were identified and four QTLs,
qgw3.1,
qgw3.2,
qgw4 and
qgw9, were newly identified. For GS, one (
qgs3.2) of the eight total QTLs were newly detected, and two E-QTLs for GS detected in the HD population, showed interaction with three M-QTLs. Of these E-QTLs, the interaction of
qgs5.2 and
qgs5.3 had large effect but low PVE. This result suggests that M-QTLs may contribute most phenotypic variation to GS in the HD population.
Several QTLs controlling different traits were identified in similar chromosomal position, which suggests a pleiotropic genetic effect of a single QTL. In this study, a total of eight clusters of QTLs controlling different traits were detected closely at a distance of less than 7 cM and their confidence intervals overlapped (
Table 5,
Fig. 3 and
4). Two loci for CL and GL,
qcl1.1 and
qgl1.2, were located at the same site of chromosome 1, and those affected in the same direction. This might contribute to significant positive correlation observed between CL and GL in the HD population. Seven clusters of QTLs controlling grain related traits, GL, GW, GS and 100GW, and the direction of their effects were highly correlated with one another (
Table 3). Especially,
qgw5 and
q100gw5 in the HD population and
qgl5,
qgw5,
qgs5.1 and
q100gw5 in the HH population were considered to have strong pleiotropic genetic effect for grain-related traits by
qSW5/GW5 locus.
Taken together, all these data obtained by the present study suggest that HWC-line genome is similar to japonica cultivar even though HWC-line contains chromosomal portion resembling indica cultivar. In particular, the grain shape related traits, GL, GW, and GS of HWC-line were almost identical to those of Dasan, which is similar to indica cultivar, and the QTLs for GL, GW and GS identified in this study explained this phenomenon, confirming that the HWC-line alleles contributed to long and slender grain shape.
In conclusion, the QTLs identified in this study will be able to provide basic information on putative functional genes related to some agronomic traits and facilitate breeding new rice cultivar by MAS. Furthermore, the HWC-line could be utilized for inter-subspecies crosses heading toward hybrid breeding.
ACKNOWLEDGMENTS
This work was supported by a grant from the Next-Generation BioGreen 21 Program (Plant Molecular Breeding Center No. PJ008125), Rural Development Administration, Republic of Korea.
Fig. 1The plant architecture and grain shape of Hwacheong, HWC-line and Dasan.
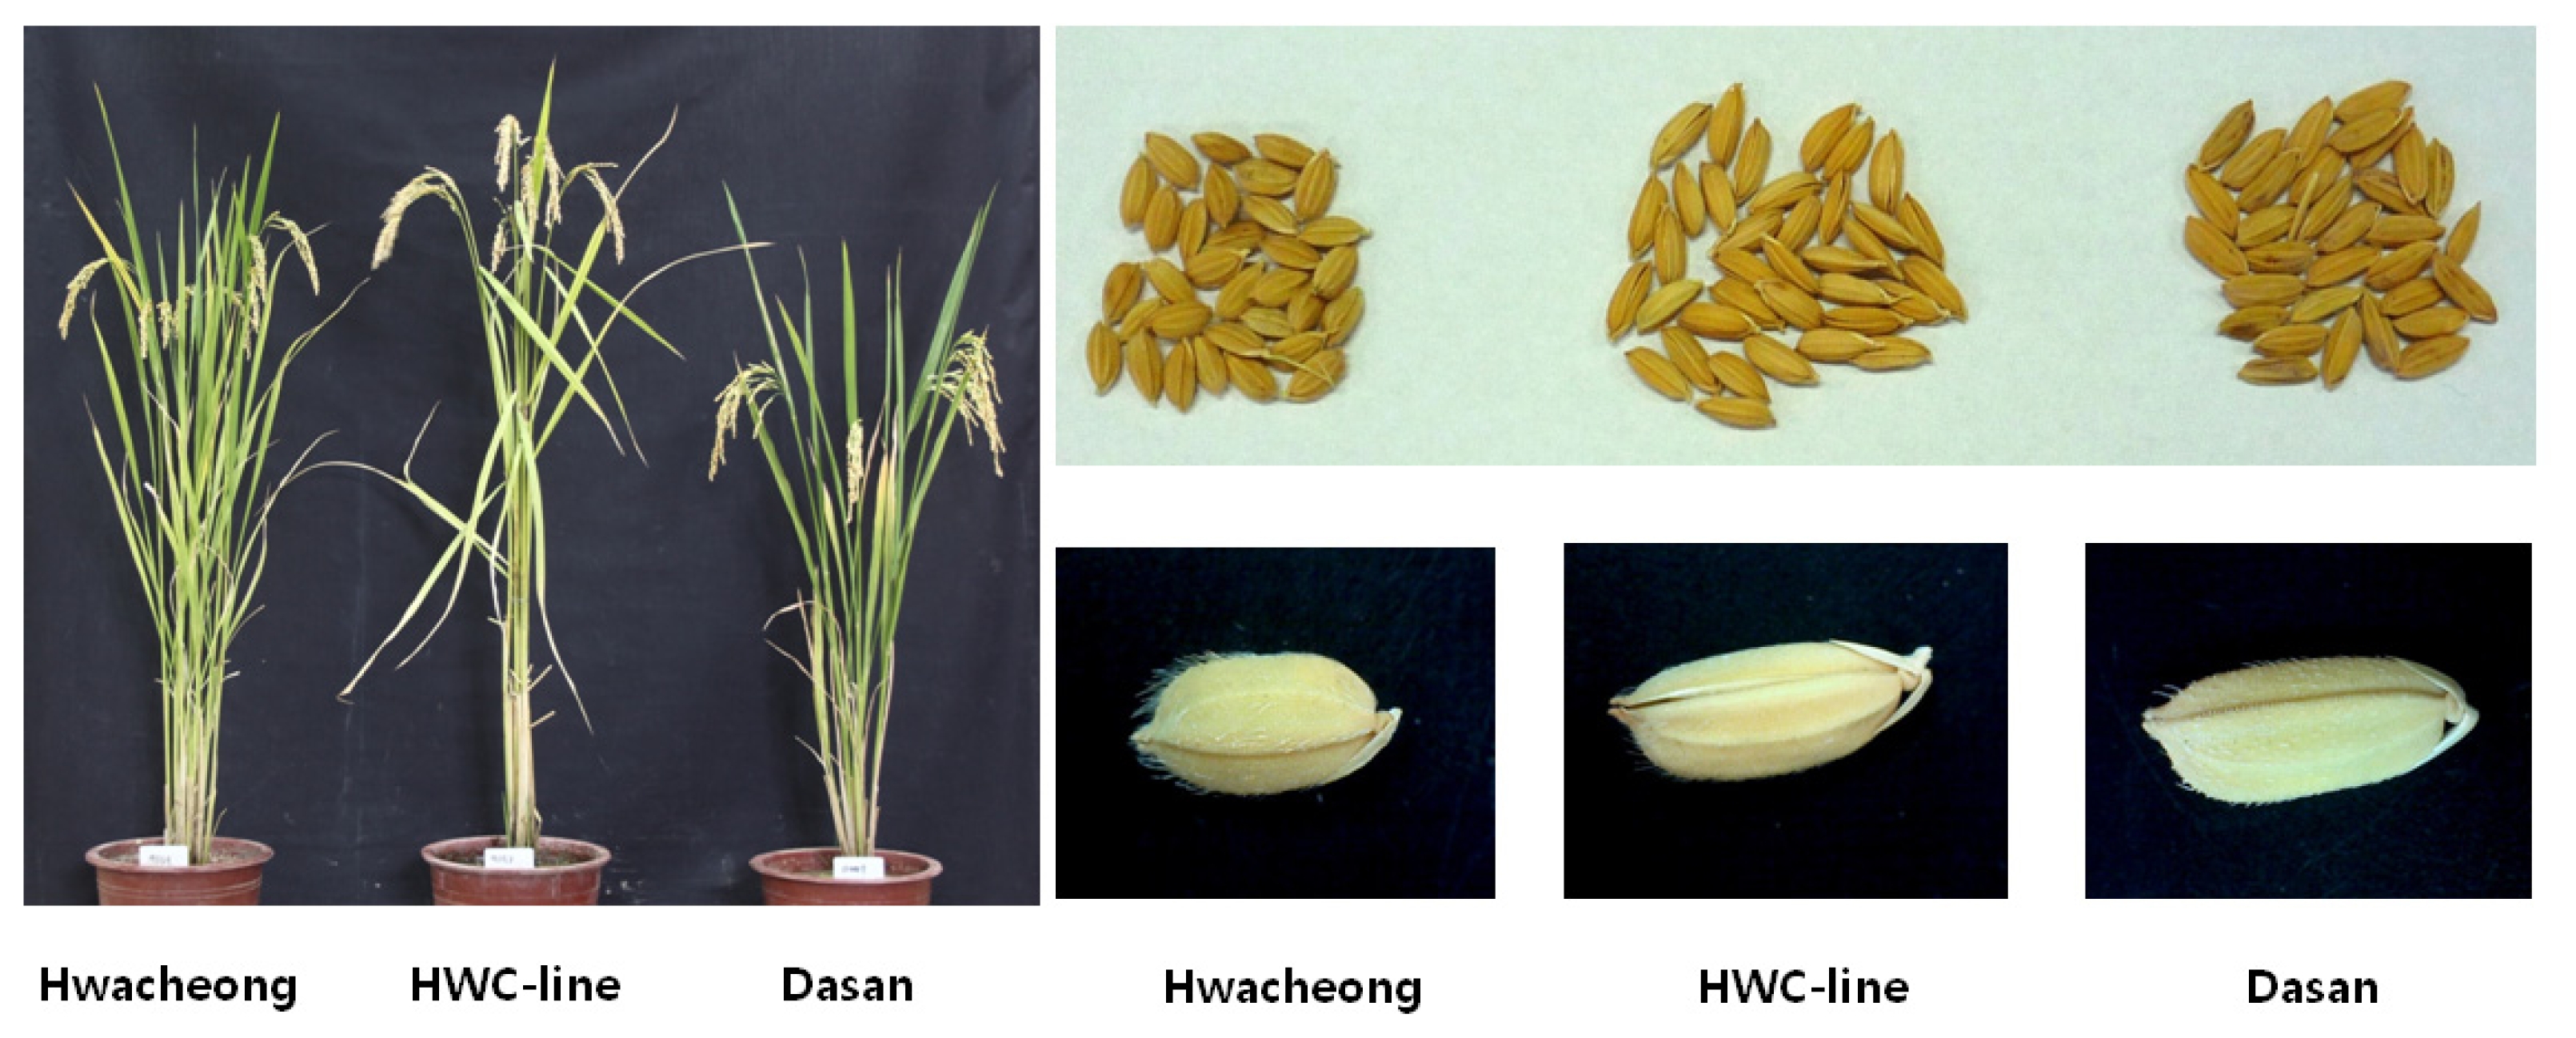
Fig. 2Frequency distribution of culm length, panicle length, spikelet number per panicle, spikelet fertility, grain length, grain width, grain shape and 100 grains weight in two F2 populations.

Fig. 3Chromosomal locations of QTLs for seven agronomic traits in the HD population. The number above each chromosome indicates linkage map coverage based on physical position of markers.
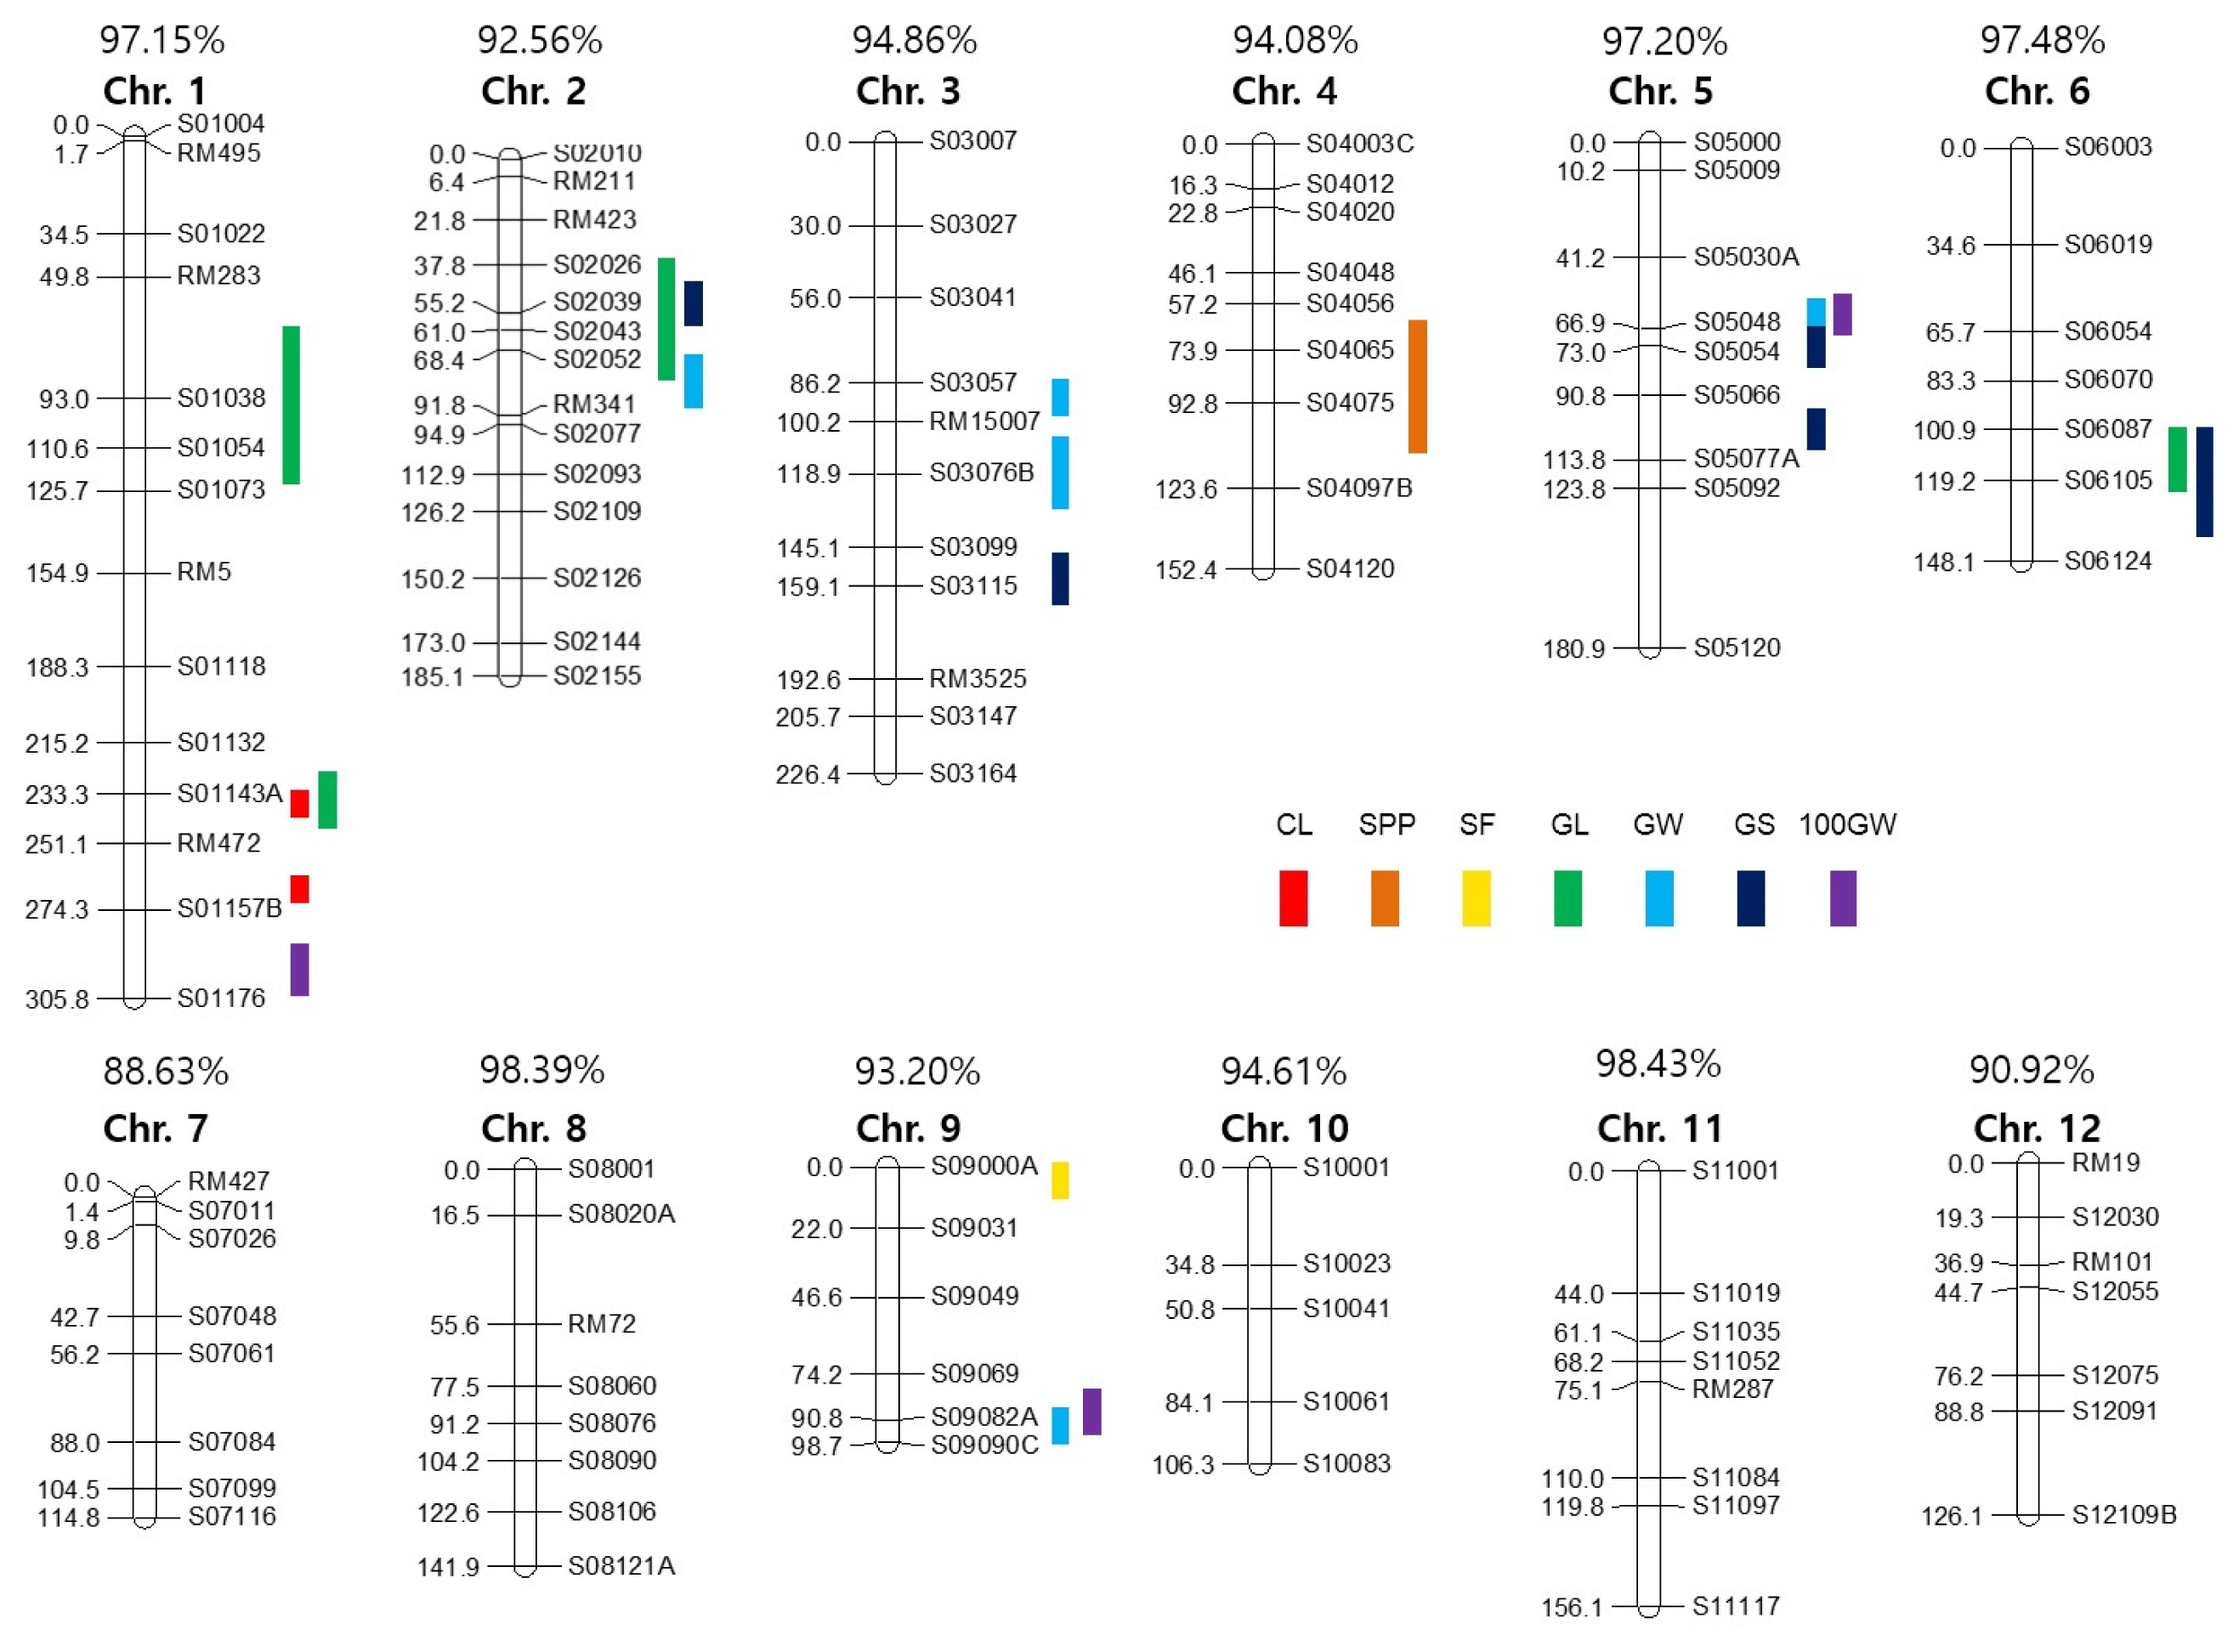
Fig. 4Chromosomal locations of QTLs for seven agronomic traits in the HH population. The number above each chromosome indicates linkage map coverage based on physical position of markers.

Fig. 5Frequency of HWC-line allele in HD (left) and HH (right) populations. Chromosome numbers are shown on the x-axis while the frequency of HWC-line allele is shown on y-axis.

Fig. 6Physical position of markers spanning qcl1.1 (A) and sd1 sequence variation among HWC-line, Dasan and Hwacheong (B). Black arrows and box regions represent exons. Green arrows indicate primers used in sequencing.
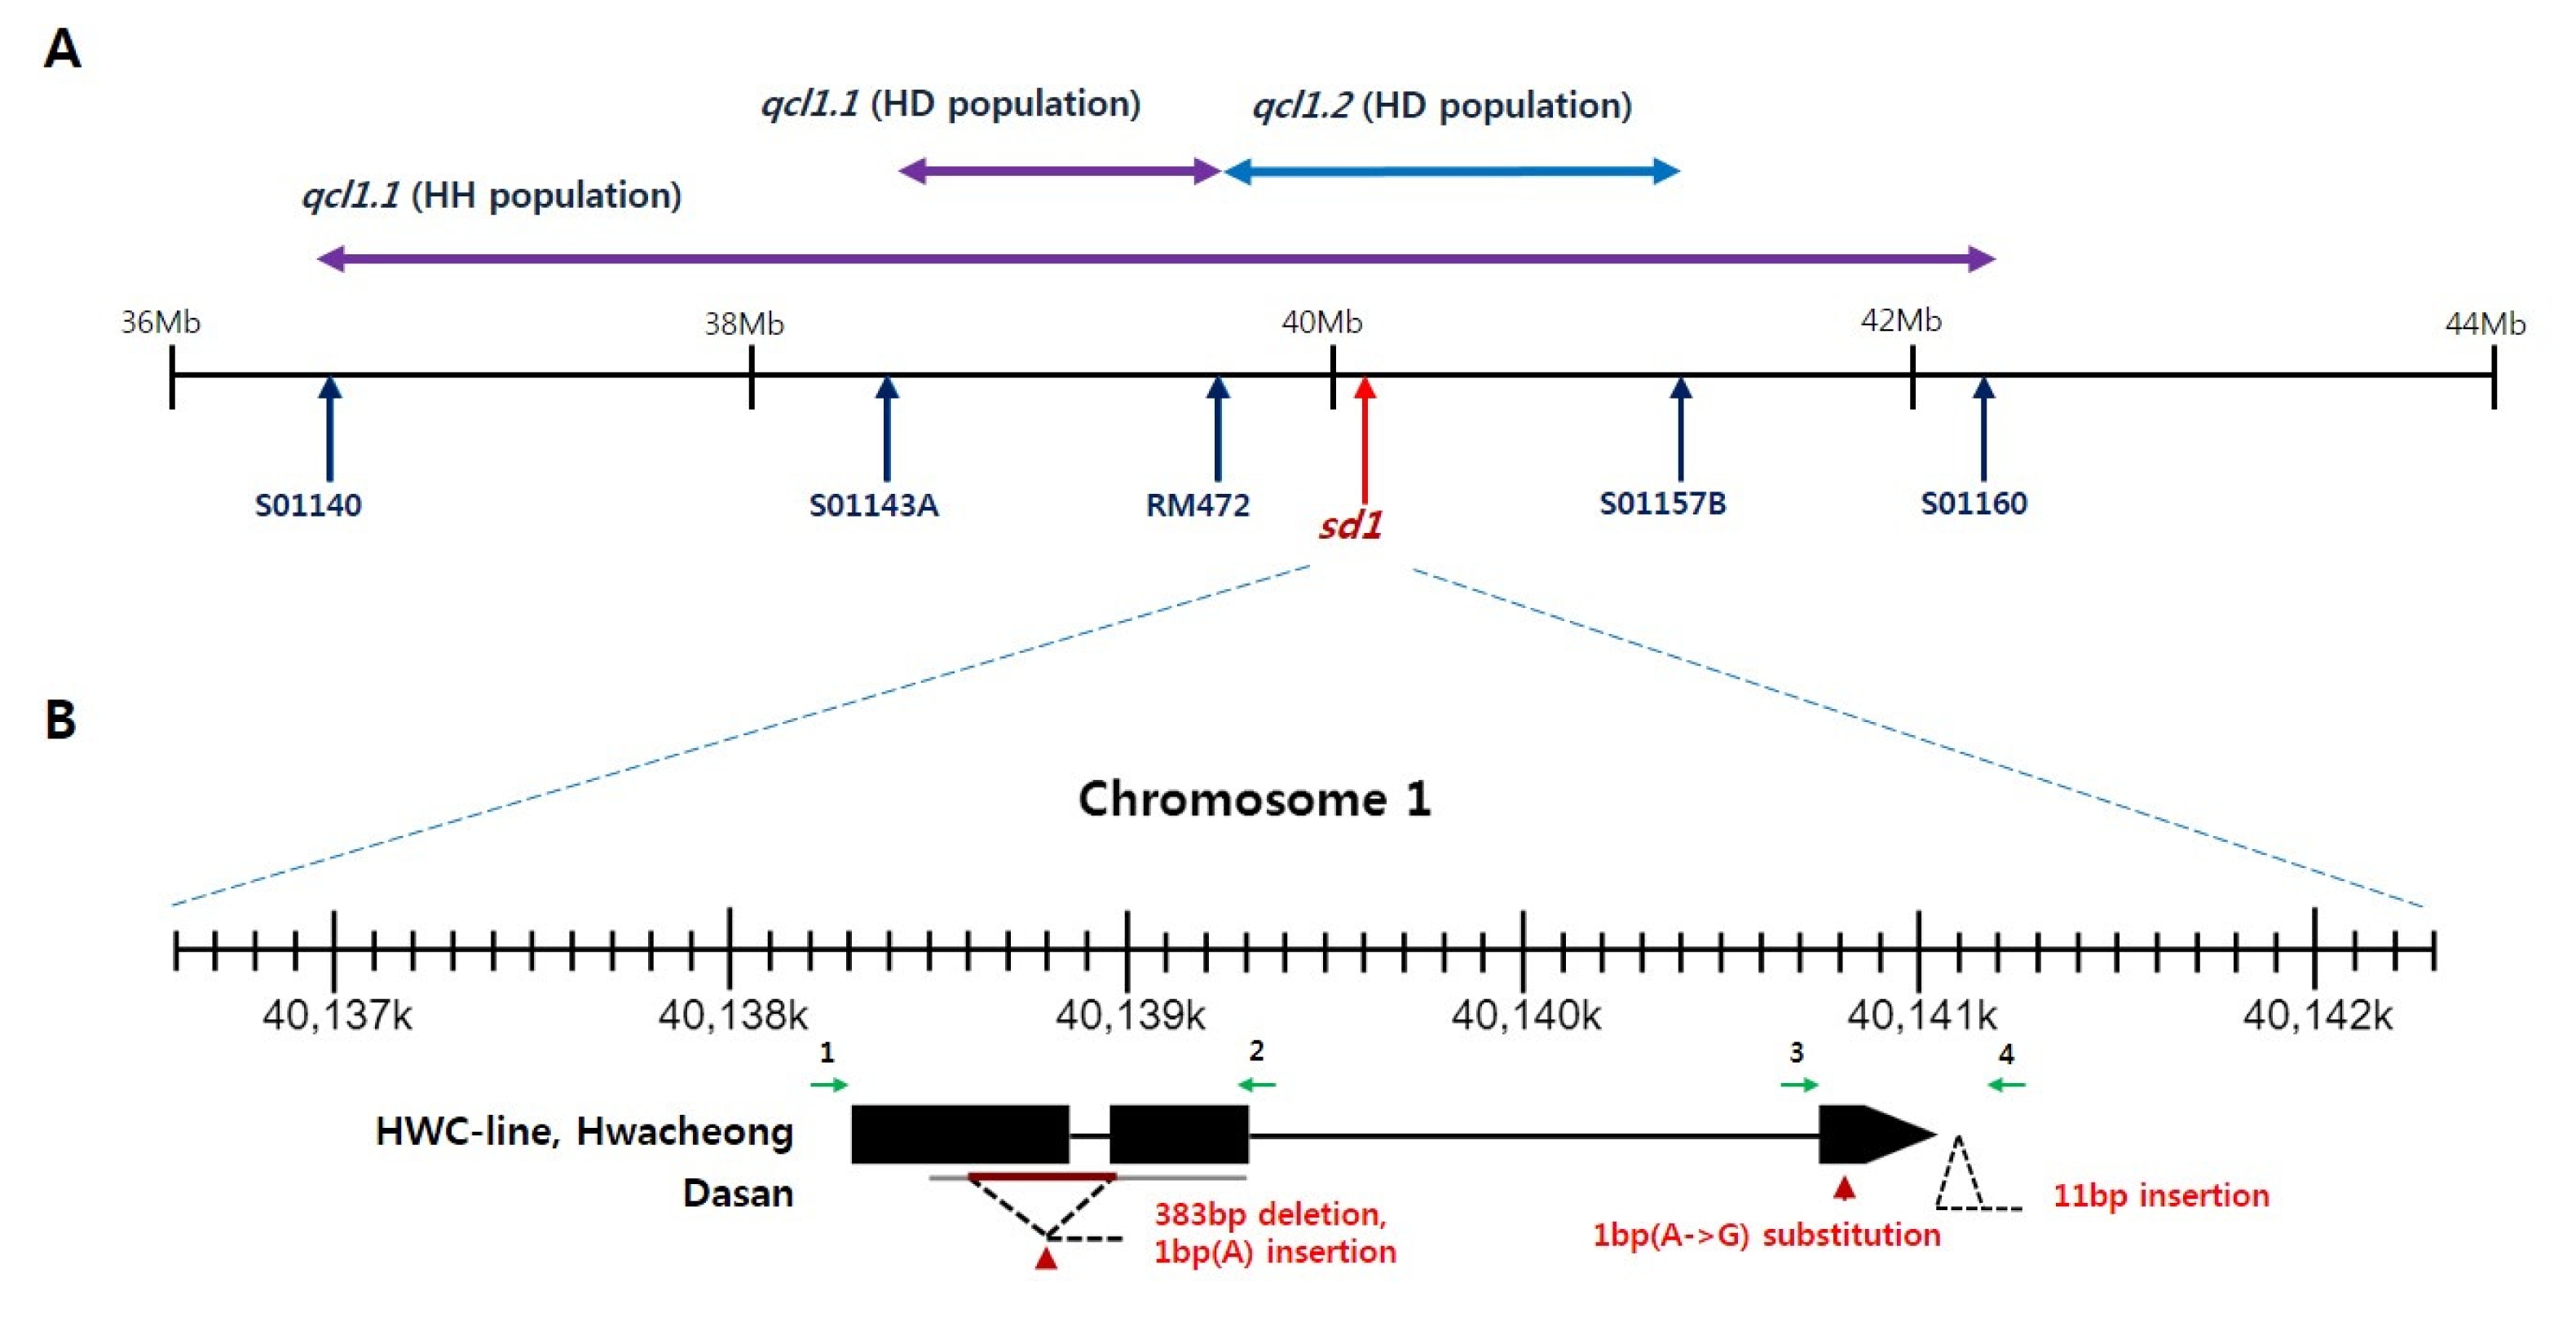
Table 1The designed primers used in sequencing of sd1 coding region.
Table 1
|
No. |
Primer name |
Sequence (5′→3′) |
Amplicon size (HWC-line and Hwacheong/Dasan) |
Amplifying region |
|
1 |
SD1-2F |
CAACACAGCGCTCACTTCTC |
1023/641bp |
exon1, intron1 and exon2 |
|
2 |
SD1ex1-2R |
TGGTTTACCATGAAGGTGTCG |
|
3 |
SD1ex3F |
GGGAATTGTTGTGTGTGCAG |
468/479bp |
exon3 |
|
4 |
SD1ex3R |
GTACAGCGGTAGGGTCCAAA |
Table 2Agronomic traits of three parents and two F2 populations established in the field in 2010.
Table 2
|
Character |
Parents |
F2 populations |
|
|
|
Hwacheong |
HWC-line |
Dasan |
HWC/DS |
HWC/HC |
|
|
|
|
|
Mean |
SDz)
|
Mean |
SD |
Mean |
SD |
Mean |
SD |
Miny)
|
Maxx)
|
Mean |
SD |
Min |
Max |
|
Heading date |
Aug. 20 |
Aug. 12 |
Aug. 14 |
|
|
|
|
|
|
|
|
|
Culm length (cm) |
81.2 |
3.6 |
93.9 |
4.12 |
78.8 |
2.1 |
95.9 |
12.2 |
60.5 |
125.0 |
87.2 |
8.3 |
69.0 |
106.0 |
|
Panicle length (cm) |
18.7 |
3.4 |
23.6 |
2.2 |
24.2 |
1.3 |
22.6 |
2.2 |
15.5 |
30.5 |
22.4 |
2.3 |
13.2 |
29.0 |
|
Spikelet per panicle |
113.8 |
14.6 |
146.2 |
17.4 |
173.5 |
39.3 |
140.9 |
38.7 |
49.0 |
262.0 |
143.0 |
25.2 |
89.7 |
251.3 |
|
Spikelet fertility (%) |
93.8 |
2.8 |
91.6 |
1.2 |
84.8 |
11.5 |
65.5 |
18.8 |
2.7 |
96.1 |
82.6 |
13.8 |
8.1 |
97.6 |
|
Grain length (mm) |
6.31 |
0.24 |
7.47 |
0.23 |
7.72 |
0.25 |
7.08 |
0.34 |
6.06 |
8.10 |
6.98 |
0.29 |
6.29 |
7.76 |
|
Grain width (mm) |
3.31 |
0.14 |
3.1 |
0.13 |
3.11 |
0.12 |
2.94 |
0.18 |
2.49 |
3.39 |
3.20 |
0.15 |
2.82 |
3.58 |
|
Grain shape (GL/GW) |
1.91 |
0.09 |
2.41 |
0.1 |
2.49 |
0.14 |
2.43 |
0.19 |
2.00 |
2.98 |
2.19 |
0.14 |
1.82 |
2.57 |
|
100 grains weight (g) |
2.4 |
0.12 |
2.4 |
0.09 |
2.83 |
0.07 |
2.27 |
0.24 |
1.70 |
3.10 |
2.35 |
0.23 |
1.61 |
2.92 |
Table 3Correlation coefficients among eight agronomic traits of HD population (Lower) and HH population (Upper).
Table 3
|
Culm length |
Panicle length |
Spikelet per panicle |
Spikelet fertility |
Grain length |
Grain width |
Grain shape |
100 grains weight |
|
Culm length |
|
0.28**
|
0.17*
|
−0.01 |
0.22**
|
0.18*
|
0.01 |
0.14 |
|
Panicle length |
0.39**
|
|
0.35**
|
0.03 |
0.33**
|
0.02 |
0.20**
|
0.23**
|
|
Spikelet per panicle |
0.12 |
0.34**
|
|
0.03 |
0.05 |
0.06 |
−0.03 |
0.05 |
|
Spikelet fertility |
0.12 |
−0.14*
|
−0.07 |
|
−0.15*
|
−0.22**
|
0.07 |
0.31**
|
|
Grain length |
0.25**
|
0.34**
|
0.00 |
−0.11 |
|
0.00 |
0.65**
|
0.30**
|
|
Grain width |
0.18*
|
−0.12 |
−0.08 |
0.11 |
0.18*
|
|
−0.75**
|
0.45**
|
|
Grain shape |
0.01 |
0.34**
|
0.05 |
−0.13 |
0.40**
|
−0.78**
|
|
−0.16*
|
|
100 grains weight |
0.33**
|
0.12 |
−0.19**
|
−0.03 |
0.51**
|
0.65**
|
−0.23**
|
|
Table 4Number of polymorphic markers in two F2 populations.
Table 4
|
Total |
HWC vs. DS |
HWC vs. HC |
|
STS marker |
293 |
213 (72.7%) |
51 (17.4%) |
|
SS-STS marker |
55 |
53 (96.4%) |
2 (3.6%) |
|
SSR marker |
374 |
293 (78.3%) |
64 (17.1%) |
|
FNP marker |
1 |
1 (100%) |
1 (100%) |
|
Total |
723 |
560 (77.5%) |
118 (16.3%) |
Table 5Main-effect QTLs underlying eight agronomic traits in two F2 populations.
Table 5
|
Trait |
Chr. |
QTL |
Marker interval |
HWC/DS |
HWC/HC |
Remarks |
|
|
|
positionz)
|
F y)
|
Ax)
|
PVE(%)w)
|
position |
F
|
A
|
PVE(%) |
|
CL |
1 |
qcl1.1v)
|
S01140–S01160 |
|
|
|
|
76.4 |
33.6 |
6.59 |
25.6 |
novel QTL |
|
1 |
qcl1.1v)
|
S01143A–RM472 |
238.7 |
54.0 |
5.76 |
37.2 |
|
|
|
|
novel QTL |
|
1 |
qcl1.2
|
RM472–S01157B |
269.3 |
60.4 |
6.93 |
39.1 |
|
|
|
|
sd1 (Sasaki et al. 2002) |
|
7 |
qcl7
|
S07105A–S07118B |
|
|
|
|
166.1 |
8.2 |
2.96 |
7.8 |
novel QTL |
|
PL |
10 |
qpl10
|
S10055A–RM5471 |
|
|
|
|
5.0 |
7.4 |
−0.47 |
1.0 |
qPL10-1 (Cui et al. 2002) |
|
SPP |
4 |
qspp4
|
S04065–S04075 |
81.9 |
12.1 |
19.4 |
11.4 |
|
|
|
|
qSPN-4b (Teng et al. 2002) |
|
SF |
6 |
qsf6
|
RM276–S06054 |
|
|
|
|
17.0 |
15.9 |
6.18 |
11.6 |
qSF6.2 (Reflinur et al. 2012) |
|
9 |
qsf9
|
S09000A–S09031 |
0.0 |
10.5 |
−7.24 |
7.8 |
|
|
|
|
qSF9.1 (Reflinur et al. 2012) |
|
GL |
1 |
qgl1.1
|
S01038–S01054 |
103.4 |
12.2 |
0.17 |
11.7 |
|
|
|
|
qGL-1 (Wan et al. 2005) |
|
1 |
qgl1.2
|
S01143A–RM472 |
238.7 |
12.6 |
0.15 |
12.7 |
|
|
|
|
- (Huang et al. 1997) |
|
1 |
qgl1.3
|
S01160–S01176 |
|
|
|
|
119.5 |
11.3 |
0.14 |
10.8 |
novel QTL |
|
2 |
qgl2.1
|
S02014–S02023 |
|
|
|
|
8.0 |
7.6 |
−0.08 |
5.5 |
qGL-2b (Li et al. 2003) |
|
2 |
qgl2.2
|
S02026–S02039 |
48.8 |
8.6 |
−0.14 |
7.9 |
|
|
|
|
GW2 (Song et al. 2007) |
|
3 |
qgl3
|
RM3766–RM218 |
|
|
|
|
58.3 |
17.6 |
0.14 |
14.2 |
gl3a (Xing et al. 2001) |
|
5 |
qgl5
|
qSW5–S05047 |
|
|
|
|
4.8 |
14.6 |
0.11 |
6.7 |
novel QTL |
|
6 |
qgl6
|
S06087–S06105 |
109.9 |
14.0 |
0.18 |
11.6 |
|
|
|
|
gl6 (Aluko et al. 2004), qGL-6 (Li et al. 2003
|
|
7 |
qgl7
|
S07081B–S07105A |
|
|
|
|
118.8 |
15.4 |
0.12 |
6.5 |
- (Redona et al. 1998) |
|
GW |
1 |
qgw1
|
S01160–S01176 |
|
|
|
|
121.5 |
7.5 |
0.06 |
2.8 |
qGW-1 (Wan et al. 2005), kw1.1 (Li et al. 2004), gw1.1 (Septiningsih et al. 2003) |
|
2 |
qgw2
|
S02052–RM341 |
80.4 |
13.6 |
0.10 |
8.6 |
|
|
|
|
- (Cai et al. 2002) |
|
3 |
qgw3.1
|
S03057–RM15007 |
89.2 |
11.9 |
0.06 |
5.5 |
|
|
|
|
novel QTL |
|
3 |
qgw3.2
|
RM15007–S03076B |
113.2 |
13.3 |
0.04 |
5.4 |
|
|
|
|
novel QTL |
|
4 |
qgw4
|
RM303–RM5503 |
|
|
|
|
192.1 |
7.5 |
−0.05 |
4.2 |
novel QTL |
|
5 |
qgw5
|
S05030A–S05048 |
59.2 |
55.3 |
−0.17 |
34.0 |
|
|
|
|
qSW5 (Shomura et al. 2008), GW5 (Weng et al. 2008) |
|
5 |
qgw5
|
qSW5–S05047 |
|
|
|
|
5.8 |
90.5 |
−0.16 |
47.0 |
qSW5 (Shomura et al. 2008), GW5 (Weng et al. 2008) |
|
9 |
qgw9
|
S09082A–S09090C |
93.8 |
6.7 |
0.05 |
3.0 |
|
|
|
|
novel QTL |
|
GS |
2 |
qgs2
|
S02026–S02039 |
54.8 |
15.1 |
−0.10 |
11.4 |
|
|
|
|
GW2 (Song et al. 2007) |
|
3 |
qgs3.1
|
S03099–S03115 |
153.1 |
19.2 |
−0.09 |
7.4 |
|
|
|
|
qLWR-3 (Li et al. 2003) |
|
3 |
qgs3.2
|
RM3766–RM218 |
|
|
|
|
58.3 |
7.9 |
0.04 |
4.0 |
novel QTL |
|
4 |
qgs4
|
RM303–RM5503 |
|
|
|
|
193.1 |
13.1 |
0.05 |
7.8 |
lwr4.1 (Li et al. 2004) |
|
5 |
qgs5.1
|
qSW5–S05047 |
|
|
|
|
4.8 |
74.9 |
0.14 |
48.1 |
qSW5 (Shomura et al. 2008), GW5 (Weng et al. 2008) |
|
5 |
qgs5.2
|
S05048–S05054 |
69.9 |
37.5 |
0.08 |
29.1 |
|
|
|
|
- (Tan et al. 2000) |
|
5 |
qgs5.3
|
S05066–S05077A |
102.8 |
21.5 |
0.08 |
21.9 |
|
|
|
|
qLWR-5b (Li et al. 2003) |
|
6 |
qgs6
|
S06105–S06124 |
125.2 |
8.7 |
0.06 |
6.5 |
|
|
|
|
- (Hagiwara et al. 2006) |
|
100GW |
1 |
q100gw1
|
S01157B–S01176 |
299.1 |
17.4 |
0.16 |
13.8 |
|
|
|
|
gw1.1 (Thomson et al. 2003), qTGW1-3 (Hittalmani et al. 2003), gw1.1 (Septiningsih et al. 2003), qTGW-1 (Hittalmani et al. 2002) |
|
1 |
q100gw1
|
S01160–S01176 |
|
|
|
|
121.5 |
21.5 |
0.16 |
15.2 |
gw1.1 (Thomson et al. 2003), qTGW1-3 (Hittalmani et al. 2003), gw1.1 (Septiningsih et al. 2003), qTGW-1 (Hittalmani et al. 2002) |
|
5 |
q100gw5
|
S05030A–S05048 |
65.2 |
21.4 |
−0.15 |
16.9 |
|
|
|
|
qSW5 (Shomura et al. 2008), GW5 (Weng et al. 2008) |
|
5 |
q100gw5
|
S05038–qSW5 |
|
|
|
|
2.0 |
16.2 |
−0.12 |
11.4 |
qSW5 (Shomura et al. 2008), GW5 (Weng et al. 2008) |
|
9 |
q100gw9
|
S09069–S09082A |
87.2 |
16.3 |
0.10 |
8.2 |
|
|
|
|
gw9.1 (Thomson et al. 2003), qGW-9 (Suh et al. 2005) |
Table 6Digenic epistatic QTLs for culm length and grain shape in the HD population.
Table 6
|
Trait |
Chr. |
Marker Interval i |
Chr. |
Marker Interval j |
AAz)
|
PVE (%)y)
|
ADx)
|
PVE (%) |
DAw)
|
PVE (%) |
DDv)
|
PVE (%) |
|
CL |
5 |
S05066–S05077A |
11 |
S11052–RM287 |
5.2**
|
2.8 |
−8.7**
|
0.1 |
−1.4 |
5.2 |
3.1 |
0.3 |
|
GS |
3 |
S03099–S03115 (qgs3.1) |
5 |
S05048–S05054 (qgs5.2) |
−0.02 |
0.2 |
0.10**
|
1.7 |
−0.10**
|
2.1 |
0.066 |
0.5 |
|
5 |
S05048–S05054 (qgs5.2) |
5 |
S05066–S05077A (qgs5.3) |
0.18**
|
1.7 |
0.03 |
0.0 |
−0.06 |
0.0 |
−0.15*
|
0.6 |
References
- Aluko G, Martinez C, Tohme J, Castano C, Bergman C, Oard JH. 2004. QTL mapping of grain quality traits from the interspecific cross Oryza sativa × O. glaberrima. Theor Appl Genet. 109: 630-639.
- Antonio BA, Inoue T, Kajiya H, Nagamura Y, Kurata N, Minobe Y, Yano M, Nakagahra M, Sasaki T. 1996. Comparison of genetic distance and order of DNA markers in five populations of rice. Genome. 39: 946-956.
- Cai H, Morishima H. 2002. QTL clusters reflect character associations in wild and cultivated rice. Theor Appl Genet. 104: 1217-1228.
- Chen H, Xie W, He H, Yu H, Chen W, Li J, Yu R, Yao Y, Zhang W, He Y, Tang X, Zhou F, Deng XW, Zhang Q. 2014. A high-density SNP genotyping array for rice biology and molecular breeding. Mol Plant. 7: 541-53.
- Chen J, Ding J, Ouyang Y, Du H, Yang J, Cheng K, Zhao J, Qiu S, Zhang X, Yao J, Liu K, Wang L, Xu C, Li X, Xue Y, Xia M, Ji Q, Lu J, Xu M, Zhang Q. 2008. A triallelic system of S5 is a major regulator of the reproductive barrier and compatibility of indica-japonica hybrids in rice. Proc Natl Acad Sci USA. 105: 11436-11441.
- Chin JH, Kim JH, Jiang W, Chu SH, Woo MO, Han L, Brar D, Koh HJ. 2007. Identification of Subspecies-specific STS Markers and Their Associat. ion with Segregation Distortion in Rice (Oryza sativa L.). J Crop Sci Biotechnol. 10: 175-184.
- Chin J, Chu SH, Jiang W, Cho YI, Basyirin R, Brar D, Koh HJ. 2011. Identification of QTLs for hybrid fertility in inter-subspecific crosses of rice (Oryza sativa L.). Genes Genom. 33: 39-48.
- Cui K, Peng S, Xing Y, Yu S, Xu C. 2002. Genetic analysis of the panicle traits related to yield sink size of rice. Acta Genet Sin. 29: 144-152.
- Hagiwara W, Onishi K, Takamure I, Sano Y. 2006. Transgressive segregation due to linked QTLs for grain characteristics of rice. Euphytica. 150: 27-35.
- Harushima Y, Nakagahra M, Yano M, Sasaki T, Kurata N. 2001. A Genome-Wide Survey of Reproductive Barriers in an Intraspecific Hybrid. Genetics. 159: 883-892.
- Harushima Y, Nakagahra M, Yano M, Sasaki T, Kurata N. 2002. Diverse Variation of Reproductive Barriers in Three Intraspecific Rice Crosses. Genetics. 160: 313-322.
- He P, Li JZ, Zheng XW, Shen LS, Lu CF, Chen Y, Zhu LH. 2001. Comparison of molecular linkage maps and agronomic trait loci between DH and RIL populations derived from the same rice cross. Crop Sci. 41: 1240-1246.
- Hittalmani S, Huang N, Courtois B, Venuprasad R, Shashidhar HE, Zhuang JY, Zheng KL, Liu GF, Wang GC, Sidhu JS, Srivantaneeyakul S, Singh VP, Bagali PG, Prasanna HC, McLaren G, Khush GS. 2003. Identification of QTL for growth- and grain yield-related traits in rice across nine locations of Asia. Theor Appl Genet. 107: 679-690.
- Hittalmani S, Shashidhar HE, Bagali P, Huang N, Sidhu JS, Singh VP, Khush GS. 2002. Molecular mapping of quantitative trait loci for plant growth, yield and yield related traits across three diverse locations in a doubled haploid rice population. Euphytica. 125: 207-214.
- Huang N, Parco A, Mew T, Magpantay G, McCouch S, Guderdoni E, Xu J, Subudhi P, Angeles E, Khush G. 1997. RFLP mapping of isozymes, RAPD and QTLs for grain shape, brown planthopper resistance in a doubled haploid rice population. Mol Breed. 3: 105-113.
- Huang X, Feng Q, Qian Q, Zhao Q, Wang L, Wang A, Guan J, Fan D, Weng Q, Huang T, Dong G, Sang T, Han B. 2009. High-throughput genotyping by whole-genome resequencing. Genome Res. 19: 1068-1076.
- Ikehashi H, Araki H. 1986. Genetics of F1 sterility in remote crosses of rice. IRRI.Rice Genetics. P.O. Box 933, Manila, Philippines: pp. 119-130.
- Kim S. 1999. Agronomic Characteristics of a New Wide-compatible Line and Relationship between Cross Affinity and Genetic Similarity in Rice Varieties. MS Thesis Seoul National University. Korea.
- Kosambi DD. 1944. The estimate of map distances from recombination values. Ann Eugen. 12: 172-175.
- Kurata N, Nagamura Y, Yamamoto K, Harushima Y, Sue N, Wu J, Antonio BA, Shomura A, Shimizu T, Lin SY, Inoue T, Fukuda A, Shimano T, Kuboki Y, Toyama T, Miyamoto Y, Kirihara T, Hayasaka K, Miyao A, Monna L, Zhong HS, Tamura Y, Wang ZX, Momma T, Umehara Y, Yano M, Sasaki T, Minobe Y. 1994. A 300 kilobase interval genetic map of rice including 883 expressed sequences. Nature Genet. 8: 365-372.
- Li J, Xiao J, Grandillo S, Jiang L, Wan Y, Deng Q, Yuan L, McCouch S. 2004. QTL detection for rice grain quality traits using an interspecific backcross population derived from cultivated Asian (O. sativa L.) and African (O. glaberrima S.) rice. Genome. 47: 697-704.
- Li Z, Wan J, Xia J, Zhai H. 2003. Mapping quantitative trait loci underlying appearance quality of rice grains (Oryza sativa L.). Acta Genet Sin. 30: 251-259.
- Liang Y, Zhan X, Gao Z, Lin Z, Yang Z, Zhang Y, Shen X, Cao L, Cheng S. 2011. Mapping of QTLs associated with important agronomic traits using three populations derived from a super hybrid rice Xieyou9308. Euphytica. 184: 1-13.
- McCouch S, Cho Y, Yano M, Paul E, Kinoshita T. 1997. Report on QTL nomenclature. Rice Genet Newslett. 14: 11-13.
- McCouch SR, Teytelman L, Xu Y, Lobos KB, Clare K, Walton M, Fu B, Maghirang R, Li Z, Xing Y, Zhang Q, Kono I, Yano M, Fjellstrom R, DeClerck G, Schneider D, Cartinhour S, Ware D, Stein L. 2002. Development and Mapping of 2240 New SSR Markers for Rice. DNA Res. 9: 199-207.
- Murray MG, Thompson WF. 1980. Rapid isolation of high molecular weight plant DNA. Nucl Acids Res. 8: 4321-4326.
- Oka HI. 1988. Origin of cultivated rice. Japan Scientific Societies Press. Tokyo, Japan.
- Peng S, Laza R, Visperas R, Sanico A, Cassman K, Khush G. 2000. Grain yield of rice cultivars and lines developed in the Philippines since 1966. Crop Sci. 40: 307-314.
- Qiao Y, Jiang W, Rahman ML, Chu S-H, Piao R, Han L, Koh H-J. 2008. Comparison of molecular linkage maps and QTLs for morphological traits in two reciprocal backcross populations of rice. Mol Cells. 25: 417-427.
- Rahman ML, Chu SH, Choi MS, Qiao YL, Jiang W, Piao R, Khanam S, Cho YI, Jeung JU, Jena K, Koh HJ. 2007. Identification of QTLs for some agronomic traits in rice using an introgression line from Oryza minuta. Mol Cells. 24: 16-26.
- Redoña ED, Mackill DJ. 1998. Quantitative trait locus analysis for rice panicle and grain characteristics. Theor Appl Genet. 96: 957-963.
- Reflinur Chin J, Jang S, Kim B, Lee J, Koh HJ. 2012. QTLs for hybrid fertility and their association with female and male sterility in rice. Genes Genom. 34: 355-365.
- SAS Institute Inc.2004. SAS OnlineDoc 9.1.3. Cary, NC, USA.
- Sasaki A, Ashikari M, Ueguchi-Tanaka M, Itoh H, Nishimura A, Swapan D, Ishiyama K, Saito T, Kobayashi M, Khush GS, Kitano H, Matsuoka M. 2002. A mutant gibberellin-synthesis gene in rice. Nature. 416: 701-702.
- Septiningsih EM, Prasetiyono J, Lubis E, Tai TH, Tjubaryat T, Moeljopawiro S, McCouch SR. 2003. Identification of quantitative trait loci for yield and yield components in an advanced backcross population derived from the Oryza sativa variety IR64 and the wild relative O. rufipogon. Theor Appl Genet. 107: 1419-1432.
- Shomura A, Izawa T, Ebana K, Ebitani T, Kanegae H, Konishi S, Yano M. 2008. Deletion in a gene associated with grain size increased yields during rice domestication. Nature Genet. 40: 1023-1028.
- Song XJ, Huang W, Shi M, Zhu MZ, Lin HX. 2007. . for rice grain width and weight encodes a previously unknown RING-type E3 ubiquitin ligase. Nature Genet. 39: 623-30.
- Suh JP, Ahn SN, Cho YC, Kang KH, Choi IS, Kim YG, Suh HS, Hwang HG. 2005. Mapping of QTLs for Yield Traits Using an Advanced Backcross Population from a Cross between Oryza sativa and O. glaberrima. Korean J Breed. 37: 214-220.
- Tan YF, Xing YZ, Li JX, Yu SB, Xu CG, Zhang Q. 2000. Genetic bases of appearance quality of rice grains in Shanyou 63, an elite rice hybrid. Theor Appl Genet. 101: 823-829.
- Tanksley SD. 1993. Mapping Polygenes. Ann Rev Genet. 27: 205-233.
- Temnykh S, Park WD, Ayres N, Cartinhour S, Hauck N, Lipovich L, Cho YG, Ishii T, McCouch SR. 2000. Mapping and genome organization of microsatellite sequences in rice. Theor Appl Genet. 100: 697-712.
- Teng S, Qian Q, Zeng D, Kunihiro Y, Huang D, Zhu L. 2002. QTL analysis of rice peduncle vascular bundle system and panicle traits. Acta Bot Sin. 2002. 301-306.
- Thomson MJ, Zhao K, Wright M, McNally KL, Rey J, Tung C-W, Reynolds A, Scheffler B, Eizenga G, McClung A, Kim H, Ismail AM, Ocampo M, Mojica C, Reveche MY, Dilla-Ermita CJ, Mauleon R, Leung H, Bustamante C, McCouch SR. 2012. High-throughput single nucleotide polymorphism genotyping for breeding applications in rice using the BeadXpress platform. Mol Breed. 29: 875-886.
- Thomson M, Tai T, McClung A, Lai X, Hinga M, Lobos K, Xu Y, Martinez C, McCouch S. 2003. Mapping quantitative trait loci for yield, yield components and morphological traits in an advanced backcross population between Oryza rufipogon and the Oryza sativa cultivar Jefferson. Theor Appl Genet. 107: 479-493.
- van Ooijen J. 2006. JoinMap 4.0, Software for the calculation of genetic linkage maps in experimental populations. Kyazma BV: Wageningen.
- Wan XY, Wan JM, Weng JF, Jiang L, Bi JC, Wang CM, Zhai HQ. 2005. Stability of QTLs for rice grain dimension and endosperm chalkiness characteristics across eight environments. Theor Appl Genet. 110: 1334-1346.
- Wang L, Wang A, Huang X, Zhao Q, Dong G, Qian Q, Sang T, Han B. 2010. Mapping 49 quantitative trait loci at high resolution through sequencing-based genotyping of rice recombinant inbred lines. Theor Appl Genet. 122: 327-340.
- Weng J, Gu S, Wan X, Gao H, Guo T, Su N, Lei C, Zhang X, Cheng Z, Guo X, Wang J, Jiang L, Zhai H, Wan J. 2008. Isolation and initial characterization of GW5, a major QTL associated with rice grain width and weight. Cell Res. 18: 1199-1209.
- Xing Y, Tan Y, Xu C, Hua J, Sun X. 2001. Mapping quantitative trait loci for grain appearance traits of rice using a recombinant inbred line population. Acta Bot Sin. 43: 721-726.
- Xu Y, Zhu L, Xiao J, Huang N, McCouch SR. 1997. Chromosomal regions associated with segregation distortion of molecular markers in F2, backcross, doubled haploid, and recombinant inbred populations in rice (Oryza sativa L.). Mol Gen Genet. 253: 535-545.
- Yang J, Hu C, Hu H, Yu R, Xia Z, Ye X, Zhu J. 2008. QTLNetwork: mapping and visualizing genetic architecture of complex traits in experimental populations. Bioinformatics. 24: 721-723.
- Yang J, Zhao X, Cheng K, Du H, Ouyang Y, Chen J, Qiu S, Huang J, Jiang Y, Jiang L, Ding J, Wang J, Xu C, Li X, Zhang Q. 2012. A Killer-Protector System Regulates Both Hybrid Sterility and Segregation Distortion in Rice. Science. 337: 1336-1340.
- Yang J, Zhu J, Williams RW. 2007. Mapping the genetic architecture of complex traits in experimental populations. Bioinformatics. 23: 1527-1536.
- Yonemaru J, Yamamoto T, Fukuoka S, Uga Y, Hori K, Yano M. 2010. Q-TARO: QTL Annotation Rice Online Database. Rice. 3: 194-203.
- Yoon DB, Kang KH, Kim HJ, Ju HG, Kwon SJ, Suh JP, Jeong OY, Ahn SN. 2006. Mapping quantitative trait loci for yield components and morphological traits in an advanced backcross population between Oryza grandiglumis and the O. sativa japonica cultivar Hwaseongbyeo. Theor Appl Genet. 112: 1052-1062.
- Zeng ZB. 1994. Precision Mapping of Quantitative Trait Loci. Genetics. 136: 1457-1468.