Abstract
A recombinant inbred line (RIL) population derived from the cross between Ilpumbyeo (a Japonica of high eating quality) and Moroberekan (a tropical Japonica type of low eating quality) was used for mapping QTLs associated with grain physicochemical properties and eating quality traits in rice. A total of 182 recombinant inbred lines were evaluated for two physicochemical traits, alkali digestive value and amylose content, and five traits associated with eating quality including glossiness of cooked rice determined by Toyo-taste meter, and glossiness, stickiness, hardness and overall evaluation for taste evaluation by panels. A total of 30 QTLs associated with seven traits in 10 loci on chromosomes 1, 3, 5, 6, 10, and 12 were identified. The most critical regions for eating quality were on chromosomes 3, 5 and 6 by Ilpumbyeo alleles, whereas Moroberekan contributed a total of 6 loci on chromosomes 1, 10 and 12. The QTL region on chromosome 5 contains the novel alleles for eating quality from Ilpumbyeo. MAS using DNA markers tightly linked with those QTLs will be useful for breeding Japonica cultivars with high eating quality.
-
Key words: Rice, Japonica, Eating quality, Palatability test, QTL
INTRODUCTION
High eating quality is the most important objective in
Japonica rice breeding program in Korea. The Korean rice market would internationally be opening under the Free Trade Agreement (FTA) in 2015. To enhance marketable competitiveness of Korean
Japonica rice for export eating quality and grain appearance need to be improved. The
Japonica rice breeding program has improved over the past several decades for yield, resistance from biotic stresses and grain quality. However, more improvements in eating quality are needed to meet the demand of consumers. Eating quality has usually been evaluated using sensory tests of cooked rice (
Matsue 1992;
Yamamoto et al. 1996) in which appearance (glossiness), taste, stickiness, and hardness are tested and scored to provide an overall grade of eating quality. However, a sensory test requires several hundred grams of polished rice and considerable labor to polish, cook, and evaluate each of many samples that can be derived in the F
3- to F
5-generation breeding materials. Also, the sensory test requires a panel of well-trained specialists. The efficient selection of cultivars with high eating quality is difficult in early generations because the eating quality of rice is under complex genetic control (
Yamamoto and Ogawa 1992).
Recently, several studies have been carried out to identify QTLs related to eating quality of cooked rice. Five stable QTLs and 21 additional QTLs associated with eating quality were previously identified by using chromosome segment substitution lines (CSSLs) derived from a cross of Asominori (
Japonica) and IR24 (
Indica) (
Wan et al. 2004), and by using backcross inbred lines (BILs) derived from a cross of Koshihikari/Kasalath (
Indica)//Koshihikari and CSSLs (
Ebitani et al. 2005). A few studies have also identified QTLs for eating quality in doubled haploid (DH) lines or RILs derived from crosses between different
Japonica strains (
Kobayashi and Tomita 2008;
Kwon et al. 2011;
Takeuchi et al. 2008;
Tanaka et al. 2006;
Wada et al. 2008). DNA markers closely linked to these QTLs have made it possible to more efficiently develop rice cultivars with a higher eating quality (
Lestari et al. 2009). In Korea,
Kwon et al. (2011) analyzed QTLs related to eating quality using RIL population of a cross between Chucheongbyeo (Akibare, a Japanese
japonica variety), a leading variety for 40 years as
Japonica high quality and Suweon 365, a
Japonica low eating quality. Twenty-one QTLs were identified on chromosomes 1, 4, 6, 7, 8, and 11 and QTLs on chromosomes 6, 7, and 8 were detected for three traits, the glossiness of cooked rice (GCR) using a Toyo-taste meter, the stickiness (ST) and overall evaluation (OE) of cooked rice using a sensory test related to eating quality. Twenty-eight QTLs were identified on chromosomes 1, 3, 4, 5, 6, 7, 8, 9, and 10 for ADV, AC, GCR, and six paste viscosity properties, peak viscosity (PV), hot-paste viscosity (HPV), cool-paste viscosity (CPV), breakdown (BD), setback (SB), and consistency viscosity (CSV) in RIL population from a cross between Ilpumbyeo and Moroberekan (
Cho et al. 2013).
In this study presented, a recombinant inbred lines (RILs) population derived from a cross between temperate
Japonica and tropical
Japonica and its genetic linkage map (
Cho et al. 2013) were employed to locate the QTL locus underlying seven characteristics associated with eating quality for physicochemical properties and sensory test by panel.
MATERIALS AND METHODS
Plant materials
A RIL population which consisted of 182 lines derived from F
11–12 generation of Ilpumbyeo x Moroberekan by single seed descent method was used in this study (
Cho et al. 2013). Ilpumbyeo developed from a cross between Suweon 295-sv3 and Inabawase (
RDA 1990) is a temperate
Japonica rice cultivar of high eating quality and susceptible to blast. Moroberekan is a tropical
Japonica of low eating quality and is resistant to blast from West Africa (
Wang et al. 1994). This RIL population was used to construct a saturated genetic linkage map by SSR markers and to evaluate traits related to eating quality.
One hundred and eighty-two RILs and two parents were grown in an experimental plot at NICS, Suwon for two years, 2010 and 2011. The planting density was 22.22 m−2 (15 cm x 30 cm) and N-P2O5-K2O fertilizers were applied at the level of 90–45–57 kg/ha in each year. Parental cultivars were planted with three replications by one replication planting to every 78 RILs. Fifty-six plants for two lines were raised and 46 per RIL line were harvested at 50 days after heading. All seeds were threshed, and air- dried in a shaded greenhouse. Fully matured grains were used for evaluation of physicochemical properties and traits for eating quality.
Evaluation of physicochemical properties for grain quality
Alkali digestion values (ADV) were determined visually using the scale (1–7) of spreading method described in
Little et al. (1958) and by the clearing of milled rice kernel soaked in 1.4% KOH solution for 23 hours at a constant temperature of 30°C. The amylose content (AC) was determined by the relative absorbency of a starch-iodine blue color in a digested solution of 100-mesh rice flour. For these measurements, Rapid Flow Autoanalyzer was used following the method in
Juliano (1971). The protein content (PC) was measured using the Micro-Kjeldahl method (FOSS: 2300 Kjeltec Analyzer, Sweden). The glossiness of cooked rice (GCR) was determined with two replications using the Toyo-taste meter (model: MA-90A and 90B) in accordance with the operation manual (TRCM Co., Japan).
Rice grains were polished and cooked, as described in the manual ‘A guide to rice breeding’(
Choi, 2006). The grains were polished to a yield of appropriately 90% using a rice miller. The polished rice was transferred to insert bowls and washed five times with water. After washing, the rice was soaked in water for 30 min and then cooked in the rice cooker at a 1.3 (w/w) ratio of water to polished rice. The cooked rice for each line was evaluated by a panel of five judges who can distinguish differences in glossiness (GL), stickiness (ST), hardness (HA) and overall evaluation (OE) in evaluating palatability of cooked rice. The age of five judges ranged from 34 to 63 years old. The seven scores −3, −2, −1, 0, +1, +2, and +3 were designed corresponding to worst, worse, bad, the same, good, better, and best, for each property in comparison with the control variety, Chucheongbyeo. The average scores for taste and palatability were used for the QTL analysis.
A saturated genetic linkage map by SSR markers for a RIL population consisting of 182 lines was constructed by
Cho et al. (2013). The data of this map was used to analyze QTLs for seven characteristics of two physicochemical properties, GCR, and four palatability traits. The average scores of GL, ST, SF and OE which were evaluated from five panels were used for QTL analysis. The chromosomal locations of the QTLs were determined by single-point analysis (SPA) and composite interval mapping (CIM). Primary analysis using SPA was performed using the QGene program (
Nelson 1997). In SPA, a QTL was identified if the phenotype was associated with a marker locus at P<0.001 or with two adjacent marker loci at P<0.05. To identify additional QTLs and to increase the resolution of QTL locations, CIM was performed using QTL Cartographer 2.0 (
Basten et al. 1997). Significance thresholds for CIM were determined using 1,000 permutations for each trait. For CIM, the experiment-wise significance level of P<0.01 corresponded to an average LOD>3.80, whereas the level P<0.05 corresponded to a LOD>2.52. The QTLs reported in this study were detected using both methods. The proportions of observed phenotypic variations attribute to a particular QTL were estimated using the coefficient of determination (R
2). The total phenotypic variance explained was estimated by simultaneously fitting to a model including all putative QTLs for the respective trait.
RESULTS
Phenotypic variation
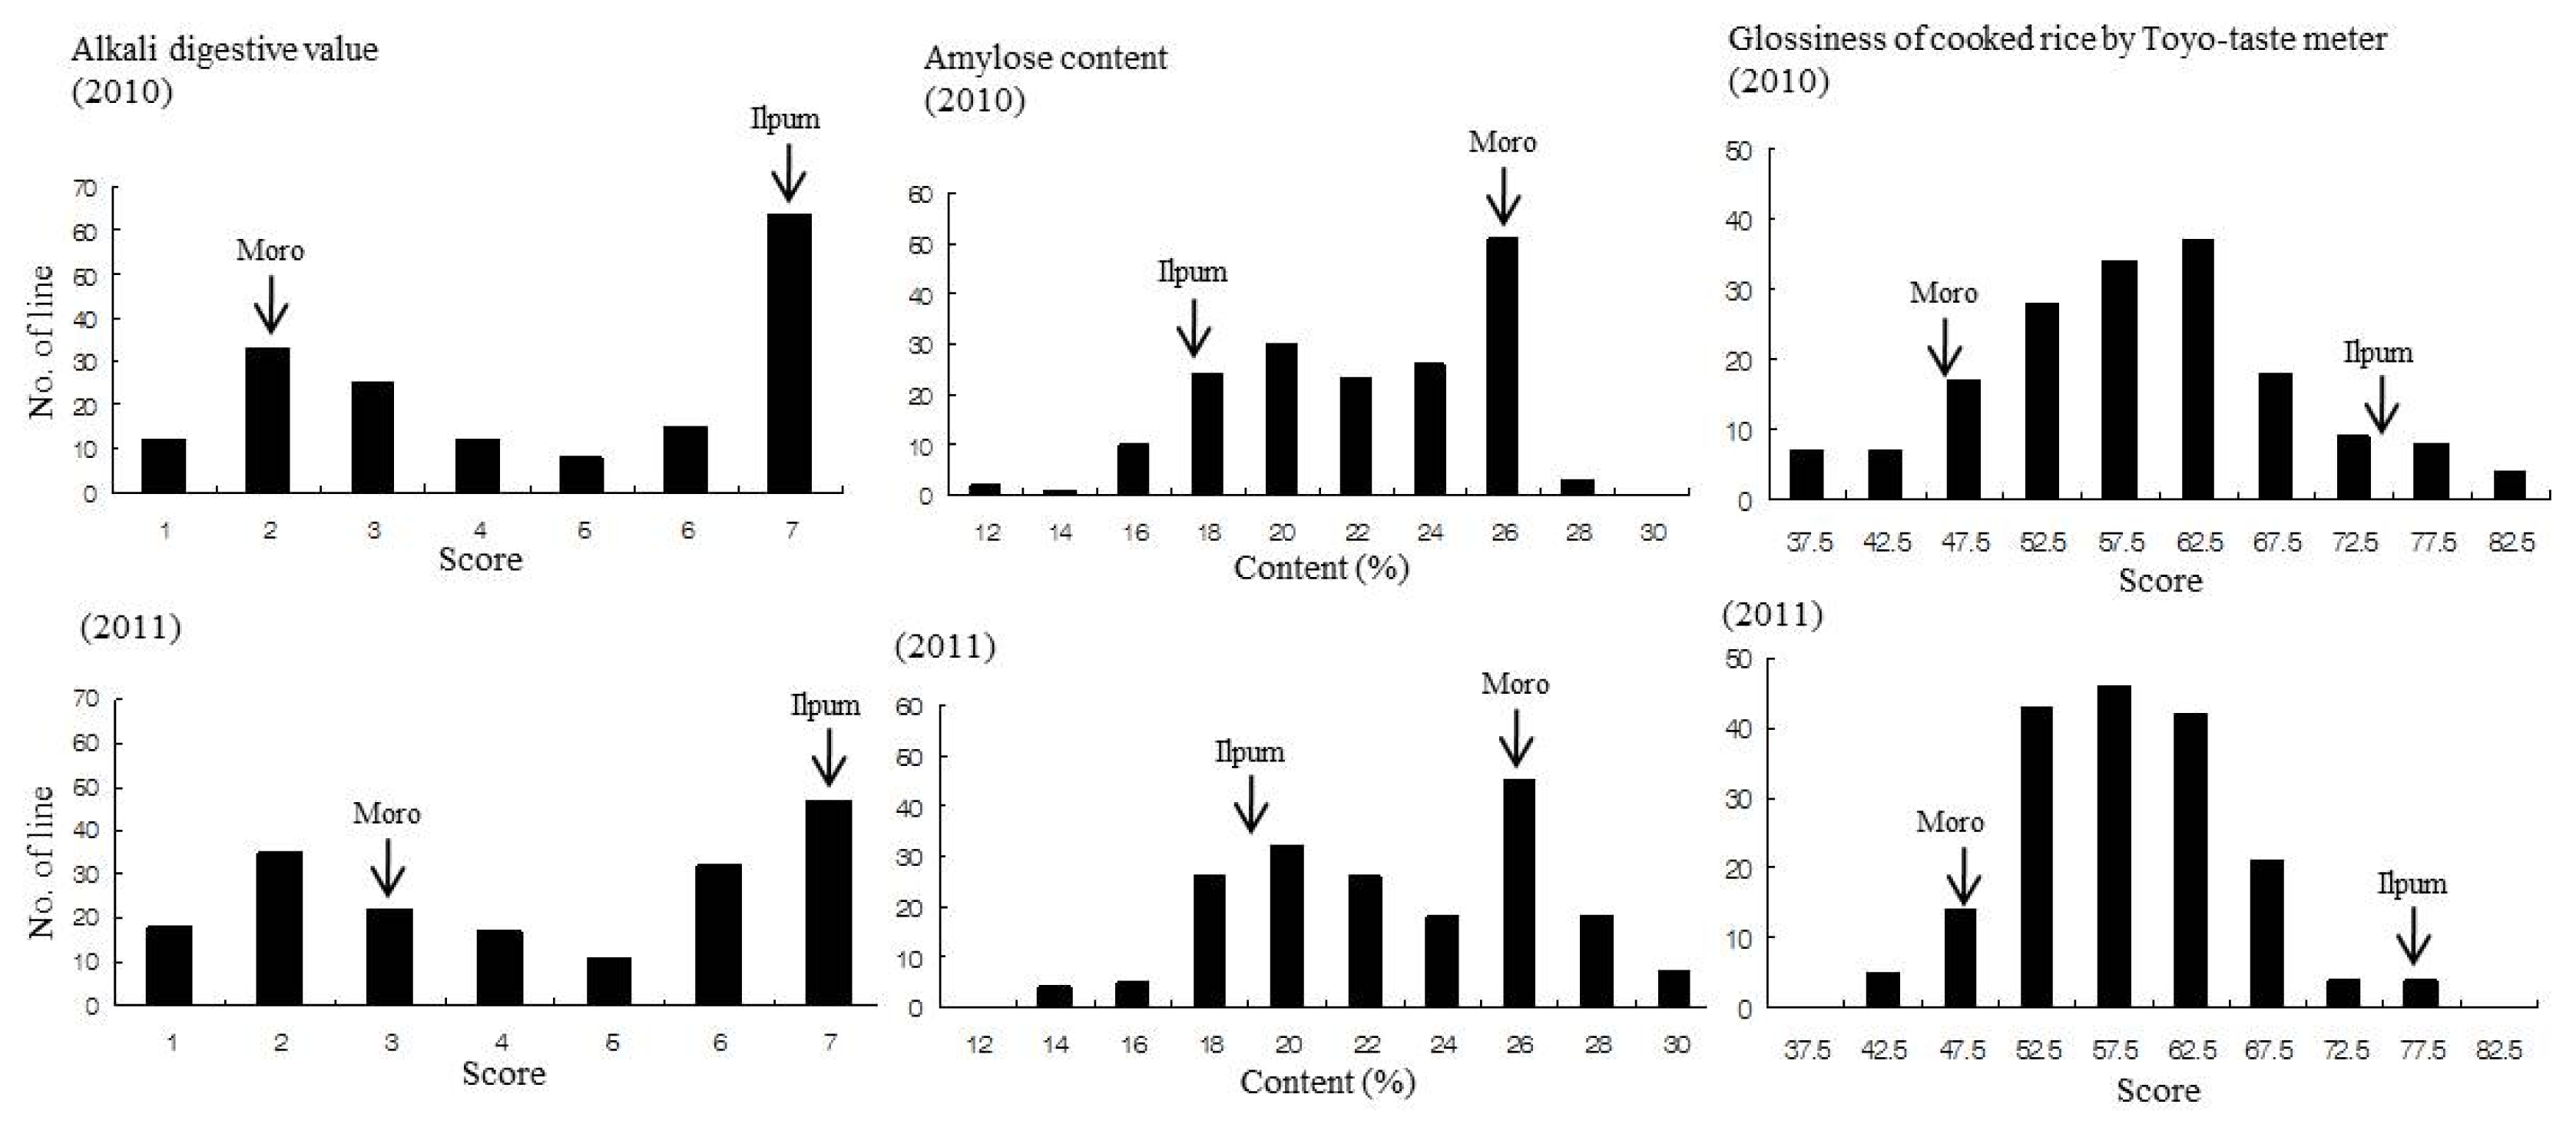
The frequency distributions of phenotypic variations for ADV, AC, GCR, and four traits of palatability for two years are shown in
Fig. 1 and
Fig. 2. ADV, AC and GCR showed continuous variation with transgressive segregations for two years. However, ADV and AC showed bimodal distributions on the axis of two parents Ilpumbyeo and Moroberekan, but GCR showed normal distributions (
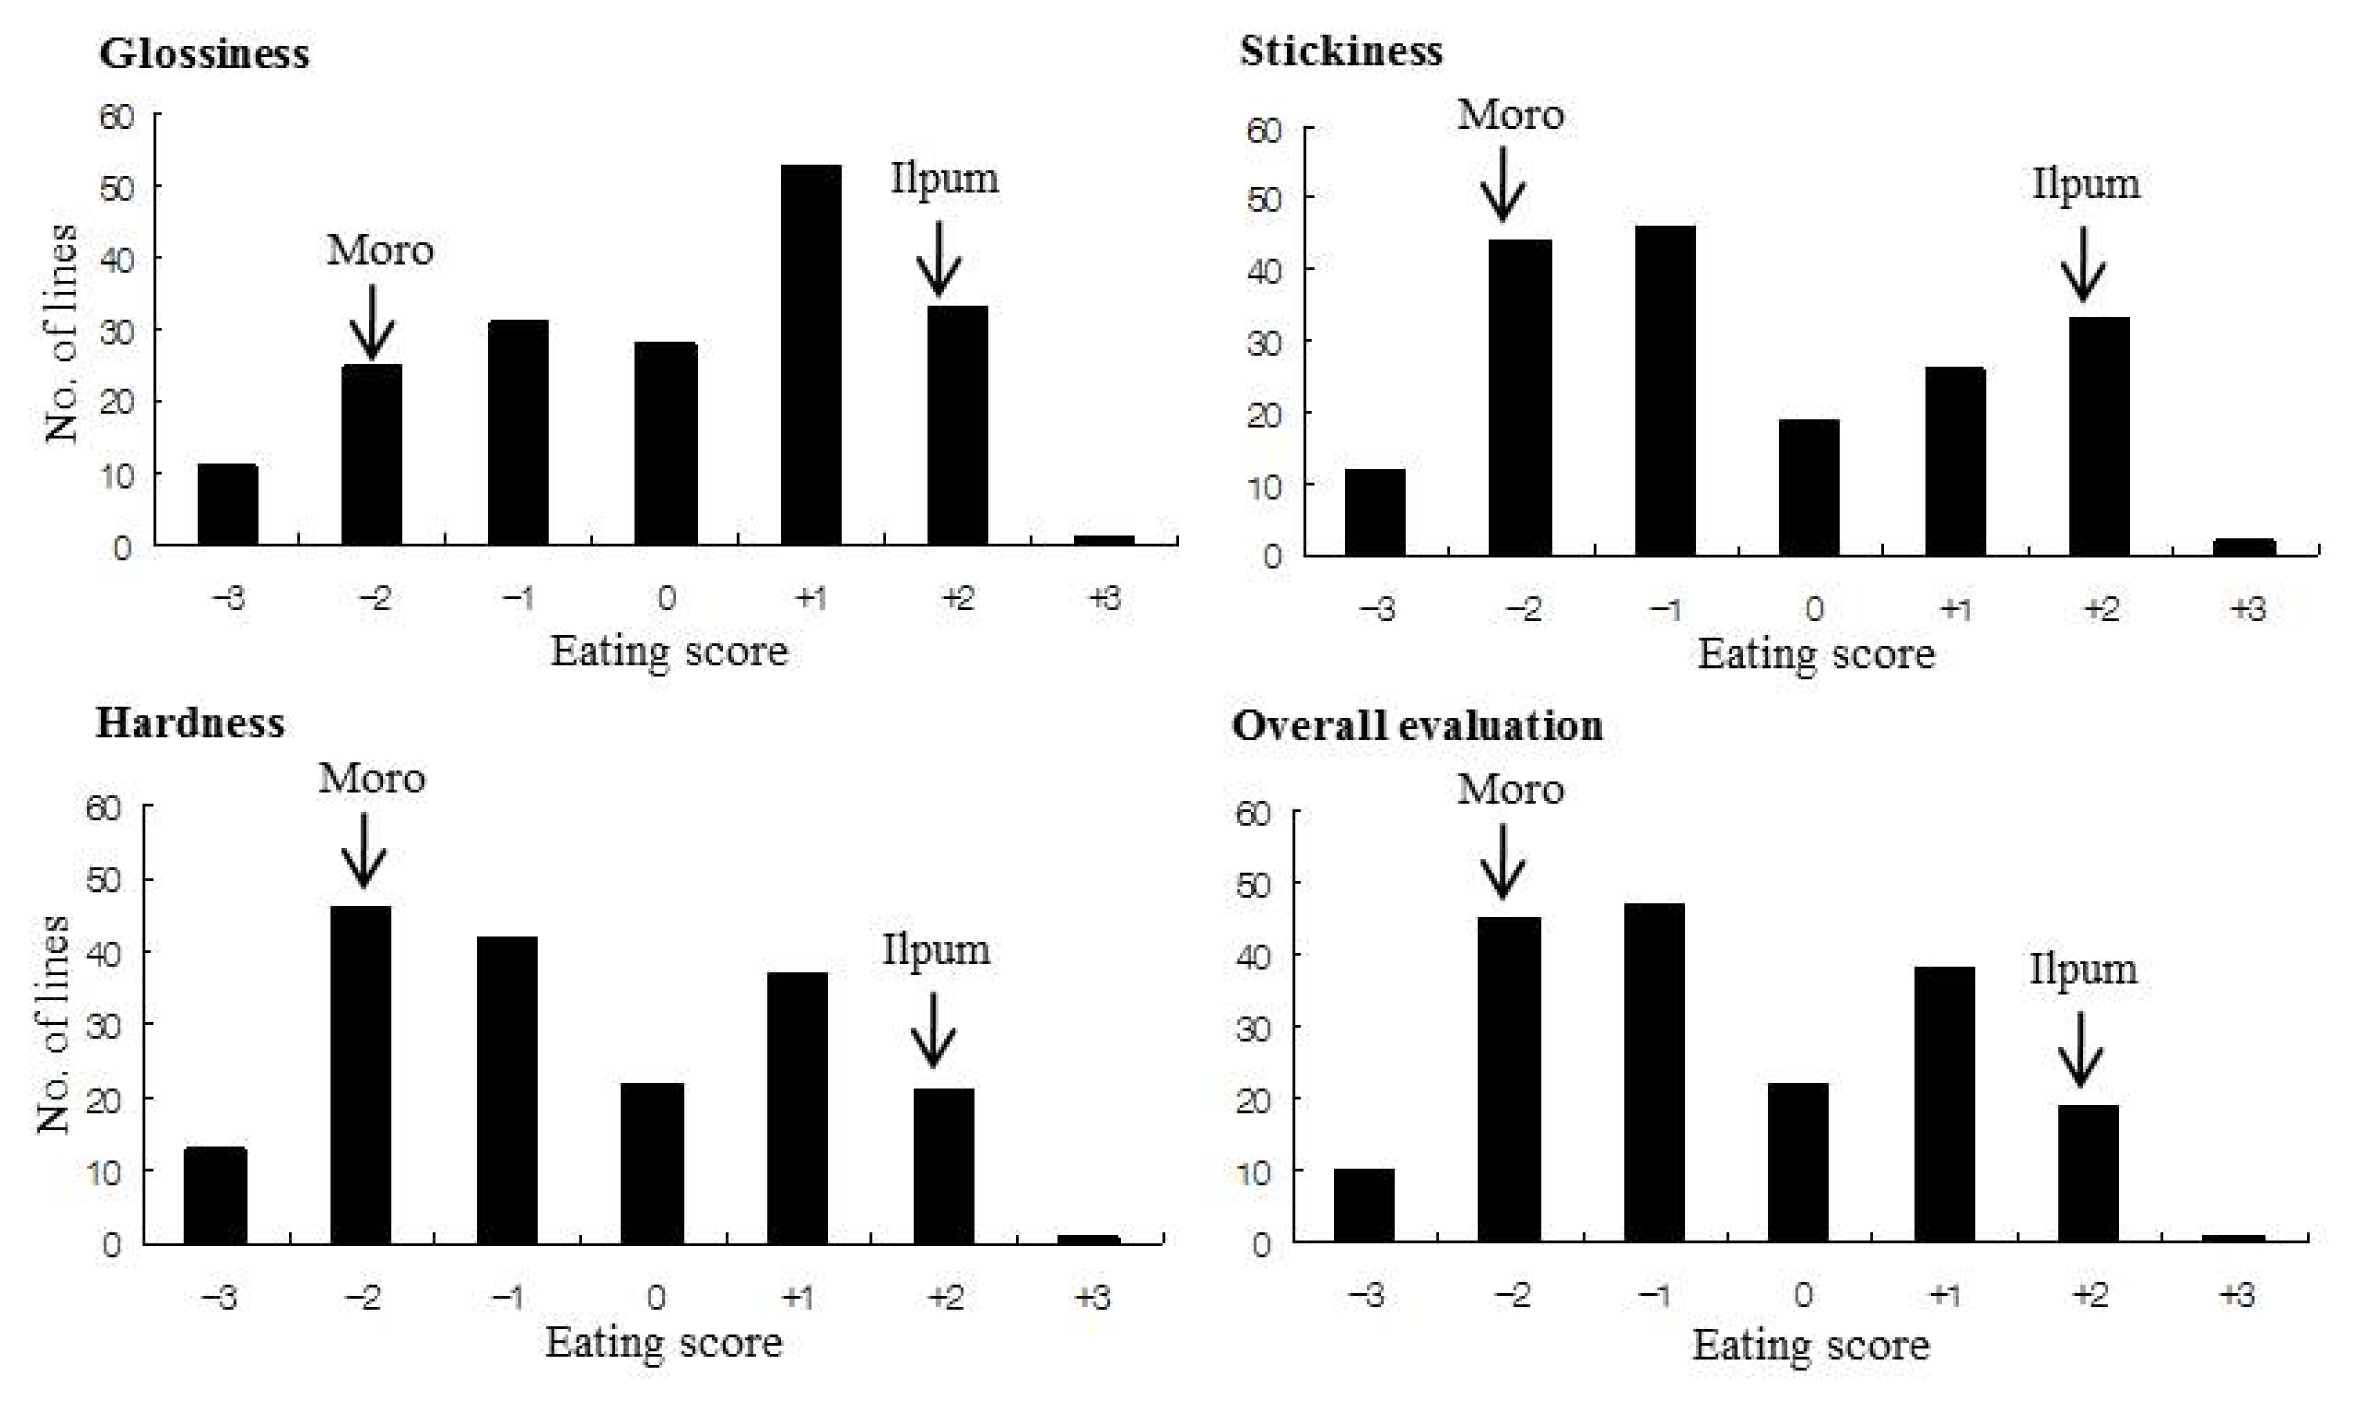
Fig. 1). In the sensory analysis, the scores of the parental cultivars Ilpumbyeo and Moroberekan were 1.9 and −2.1 in GL, 1.7 and −2.4 in ST, 2.3 and −1.8 in HA, and 2.1 and −2.3 in OE. For the RILs, the continuous variations were observed for four traits of palatability, however, the frequency distributions of these traits showed somewhat bimodal variation by less distribution of the score 0 (
Fig. 2).
Correlation coefficients among the ADV, AC, GCR, GL, ST, HA and OE are shown in
Table 1. The AC was not correlated with ADV and GCR for two years. The ADV has a highly positive correlation with five traits, GCR, GL, ST, HA and OE, but AC was highly negative correlated with four traits, GCR, ST, HA and OE except for GL in 2011. The correlation coefficients among four traits, GL, ST, HA and OE evaluated by panel were over 0.752. The correlation coefficients among three traits, ST, HA and OE were over 0.967. The GCR that estimated using Toyo-tastemeter showed the correlation coefficients over 0.469 with the traits of sensory evaluation.
A total of seven QTL loci for two physicochemical properties, ADV and AC on chromosomes 1, 3, 6 and 10, and seven QTLs for glossiness of cooked rice (GCR) for two years were detected (
Table 2 and
Fig. 3).
For alkali digestive value (ADV), four QTLs were identified on chromosomes 1, 6 and 10. Two QTLs, qADV6.1 and qADV6.1 were identified in the region of RM587- RM3370 and RM1161 and RM3498 on chromosome 6. A QTL qADV6.1 explained 32.1% and 36.6% of the total phenotypic variation and increased the ADV to 2.43 and 2.67 in both years, respectively by each Ilpumbyeo allele. Another QTL, qADV6.2, explained 11.7% and 13.6% of the total phenotypic variation and increased ADV value to 1.80 and 2.05 in both years, by two Ilpumbyeo alleles. Two QTLs, qADV1 and qADV10 were identified at RM3602- RM529 on chromosome 1 in 2011 and at RM467-RM1375 on chromosome 10 in both years. These QTLs explained the 9.9%, 10.6% and 8.8% of the total phenotypic variation by Moroberekan allele. Three QTLs for amylose content (AC) were identified on chromosomes 3, 6, and 10. Two QTLs, qAC3 and qAC6 on chromosomes 1 and 6 explained 11.8% and 8.5%, and 47.3% and 44.8% of the total phenotypic variation. These QTL loci caused a drop in AC content by 2.8% and 2.1%, and 5.1% and 4.9% from Ilpumbyeo allele, respectively. A QTL, qAC10 on chromosome 10 was identified at RM484-RM333 that decreased the AC level by 2.6% and 2.1% from Moroberekan allele and explained 9.9% and 8.7% of the total phenotypic variation in 2010 and 2011, respectively.
For glossiness of cooked rice (GCR) estimated by Toyo-taste meter, six QTLs were identified on chromosomes 3, 6, 10 and 12 (
Table 2). A QTL
qGCR3 on chromosome 3 increased GCR by 3.9 and 4.7 by Ilpumbyeo allele, and it explained 7.5% and 9.5% of total phenotypic variation in both years. Of the two QTLs on chromosomes 6,
qGCR6.1 in the region of RM589-RM217 and
qGCR6.2 in the region of RM1161-RM3498 explained 18.0~28.3% and 8.7~16.2% of the total phenotypic variation in two years, respectively. These QTL loci increased GCR by 5.9~10.3 and 6.3~9.3 from Ilpumbyeo allele in 2010 and 2011, respectively. A QTL,
qGCR10 in the region of RM467- RM1375 on chromosome 10 explained 5.4% and 6.9% of the total phenotypic variation in both years. Two QTL loci,
qGCR12.1 at RM8215-RM1302 and
qGCR12.2 at RM270- RM1300 on chromosome 12 explained 5.9~7.8% and 6.1~9.8% of the total phenotypic variation in 2010 and 2011, respectively. Three QTL loci on chromosomes 10 and 12 increased GCR by 4.3~6.4 from Moroberekan alleles.
The putative QTLs for GL, ST, SF and OE were analyzed using the average scores evaluated from five panels. Although the QTLs for ST and HA from each panel has different LOD scores, they were detected In the same chromosome region (
Fig. 4). A total of 17 QTLs were identified for four eating quality traits, GL, ST, HA and OE on chromosomes 1, 3, 5, 6 and 10 (
Table 3;
Fig. 3). Four putative QTL loci for GL, ST, HA and OE were detected in the same region on chromosomes 3, 5 and 6, respectively. A QTL locus in the terminal region of the short arm on chromosome 3 explained 15.7% for GL, 12.1% for ST, 10.9% for HA, and 12.7% for OE. A QTL locus in the region of RM5558-RM5642 on chromosome 5 explained 7.3~9% of the total phenotypic variation for four eating quality traits. Another QTL locus at RM587-RM3370 on chromosome 6 explained 34.3~38.5% of the total phenotypic variation as the major QTL for ST, HA and OE except for GL explaining 8.4%. These results showed that the Ilpumbyeo allele at all the QTLs for GL, ST, HA and OE on chromosomes 3, 5 and 6 increased the scores for eating quality traits. However, three QTL loci on chromosomes 1 and 10 were detected from Moroberekan alleles. Two putative QTLs,
qGL1.1 at RM1201-RM259 and
qGL1.2 at RM529 on chromosome 1, were detected for GL. These QTLs explained 7.2% and 6.1% for GL of the total phenotypic variation, and increased put a space 0.66 by Moroberekan allele. Another QTL locus in the region of RM484-RM333 was detected for ST, SF and OE. This QTL explained 9.4% for ST, 6.9% for HA and 7.9% for OE of the total phenotypic variation, and the scores for ST, HA and OE increased 0.73 to 0.92 by Moroberekan allele.
DISCUSSION
In the present study, we detected 17 QTLs to four traits, GL, ST, HA and OE associated with the palatability for cooked rice in six regions on chromosomes 1, 3, 5, 6 and 10 in the IM RIL population. The QTLs detected for four traits, GL, ST, HA and OE on chromosomes 3, 5 and 6 were from Ilpumbyeo alleles. Four QTLs on chromosome 3 explained 10.9% to 15.7% of the total phenotypic variation for four traits, GL, ST, HA and OE, respectively (
Table 3,
Fig. 3). Also, two QTLs for amylose content and GCR were identified in the same region on chromosome 3 for two years (
Table 2,
Fig. 3). In the previous studies for detecting QTLs related to paste viscosity characteristics using IM RIL population, a QTL for consistency viscosity and two QTLs for AC and GCR was detected in the short arm end on chromosome 3 (
Cho et al. 2013). The QTL region on chromosome 3 identified several QTLs for eating quality of cooked rice, namely glossiness, taste, stickiness, hardness, and overall evaluation based on sensory tests by a trained panel in the
japonica/
japonica population (
Kobayashi and Tomita 2008;
Takeuchi et al. 2007,
2008;
Tanaka et al. 2006;
Wada et al. 2008). Especially, this QTL region for GL, TA, ST, HA and OE was constantly identified from Koshihikari allele in RILs from Moritawase (
japonica)/Koshihikari (
Wada et al. 2008), BILs from Koshihikari/Kasalath (indica)//Koshihikari across years (
Takeuchi et al. 2007), and BILs from Nipponbare/Koshihikari//Niponbare (
Takeuchi et al. 2008). A QTL,
qST-3 for stickiness by Sakihikari allele in RIL population from Sakihikari/Nipponbare was identified throughout the three-year experiments (
Kobayashi and Tomita 2008). However, any QTL for physico-chemical properties and glossiness of cooked rice associated with eating quality was not detected in a RIL population from the cross between two
Japonicas, Suweon365/Chucheongbyeo (
Kwon et al. 2011). Also,
Tanaka et al. (2006) didn’t identify any QTL for eating quality using doubled haploid (DH) population from Koshihikari/Akihikari. A QTL for amylose content was detected using DH population from the cross between two
Indicas in the region on the short arm end of chromosome 3 (
Fan et al. 2005). Based on these studies, this QTL region on the short arm end of chromosome 3 would harbor unique QTLs for eating quality especially by two
Japonica varieties Ilpumbyeo and Koshihikari alleles for high eating quality.
A QTL region in RM5558-RM5642 on chromosome 5 harbored four QTLs for GL, ST, HA and OE, and each QTL explained 7.3% to 9% of the total phenotypic variation, respectively (
Table 3). In the previous studies, a QTL,
qCSV5 explaining 7% of the total phenotypic variation for consistency viscosity was detected in the same region on chromosome 5 (
Cho et al. 2013). However, any QTL from
Japonica and
Indica genetic background was not detected for the traits associated with eating quality near this chromosome region, suggesting that this QTL region contains the novel alleles for eating quality from Ilpumbyeo.
The major QTL region in RM589-RM3370 on the short arm end of chromosome 6 harbored three QTLs explaning 34.2~38.5% of the total phenotypic variation for ST, HA and OE, respectively, except for a QTL for GL explaining 8.4% of the total phenotypic variation. This region contained three QTLs for ADV, AC and GCR explaining 18% to 47.3% of the total phenotypic variation for two years (
Table 2). In the previous study using IM RIL population, six QTLs for paste viscosity properties were detected in the same region on chromosome 6, and they explained 6.9~26.8% of the total phenotypic variation (
Cho et al. 2013). This QTL region on chromosome 6 harbored
wx,
Wxa and
Wxb genes to determine amylose and amylopectin properties (
Ideta et al. 1993;
Sano et al. 1991). Most QTLs for eating quality were identified in the region of
wx gene on chromosome 6 in the previous studies using DH, RIL and BIL from the crosses of Capitalized the first letter in
Indica and
japonica (
Bao et al. 2000,
2002;
He et al. 2006;
Kobayashi and Tomita 2008;
Kwon et al. 2011;
Li et al. 2003;
Li et al. 2011;
Takeuchi et al. 2007,
2008;
Tanaka et al. 2006;
Tian et al. 2005;
Umemoto et al. 2002;
Wada et al. 2008;
Wan et al. 2004).
Ge et al. (2005) reported that a single QTL located near the
wx gene on chromosome 6 seemed to influence all the traits, the length, length elongation, width, width expansion, weight, and water absorption of cooked rice for the cooked rice quality. This locus on chromosome 6 containing a QTL,
Hd3 (
Lin et al. 2000) and multiple allelism of
Se-1 locus for heading date (
Yokoo & Kikuchi 1977) would have the most important effect to eating quality in rice. The relationship between heading date and eating quality should be studied in further analysis because heading date affect the chemical components like ADV, and amylose and protein content, which could affect eating quality (
Nishimura et al. 1985).
Two QTL loci for GL on chromosome 1 and a QTL locus for ST, HA and OE on chromosome 10 were identified from Moroberekan alleles (
Table 3,
Fig. 3). These QTLs explained 6.1% to 9.4% of the total phenotypic variation, respectively. In this study population, the QTL loci of
qADV1 and
qGL1.2 in RM3602-RM529 on chromosome 1 contained a QTL,
qCPV1 for cool-paste viscosity (
Cho et al. 2013). This QTL region included some QTLs for protein content (
Kwon et al. 2011;
Aluko et al. 2004), gel consistency and breakdown in paste viscosity properties (
Bao et al. 2002), stickiness of palatability test and breakdown, peak viscosity and consistency in paste viscosity properties (
Kobayashi & Tomita 2008). The QTLs of
qADV10 and
qGCR10 in RM467-RM1375 and
qAC10,
qST10,
qHA10 and
qOE10in RM484-RM333 on chromosome 10 were identified from Moroberekan alleles (
Fig. 3). A QTL region in RM467-RM1375 was identified a QTL for protein content (
Takeuchi et al. 2007). A few QTLs for amylose content, and head rice in milling and chalky rice were reported in RM484-RM333 on chromosome 10 (
Yun 2014). Two QTLs explaining 5.9~9.8% of the total phenotypic variation by Moroberekan alleles for GCR for two years were identified in RM8215-RM1302 and RM270- RM1300 on chromosome 12, respectively. The QTL region in RM8215-RM1302 did not report any QTL related to physicochemical properties, paste viscosity and eating quality. In the vicinity of RM270-RM1300, a few QTLs for GL, ST and OE were identified (
Wada et al. 2008).
In breeding programs of Japonica rice cultivars of high eating quality, the palatability of eating quality is evaluated with a sensory test in the fixed generations of F6 to F8. The molecular breeding system is needed to make breeding programs more efficient because the sensory test is time- consuming and laborious, and it needs a large rice sample. In this study, the most critical regions for eating quality were on chromosomes 3, 5 and 6. MAS using DNA markers tightly linked with those QTLs will be useful for breeding Japonica cultivars with high eating quality. Also, the QTLs on chromosome 1, 10 and 12 could increase eating quality by the alleles from rice germplasm of lower eating quality. This offers the possibility of improving the eating quality of Ilpumbyeo by using other genetic sources among Japonica rice.
ACKNOWLEDGMENTS
This research was supported by the fund for Collaborative Research Project of RDA (Code no. PJ008529, 408529- 03), Republic of Korea.
Fig. 1Frequency distribution of the physicochemical properties and glossiness of cooked rice determined by Toyo-taste meter for the RIL population from a cross between Ilpumbyeo and Moroberekan in 2010 and 2011.

Fig. 2Frequency distribution of glossiness, stickiness, hardness and overall evaluation for the RIL population from a cross between Ilpumbyeo and Moroberekan in 2011.

Fig. 3The location of putative QTLs for the RIL population from a cross between Ilpumbyeo and Moroberekan in 2010 and 2011. ADV : alkali digestive value; AC : amylose content; GCR : glossiness of cooked rice by Toyo-taste meter; GL : glossiness; ST : stickiness; HA : hardness; OE : overall evaluation.
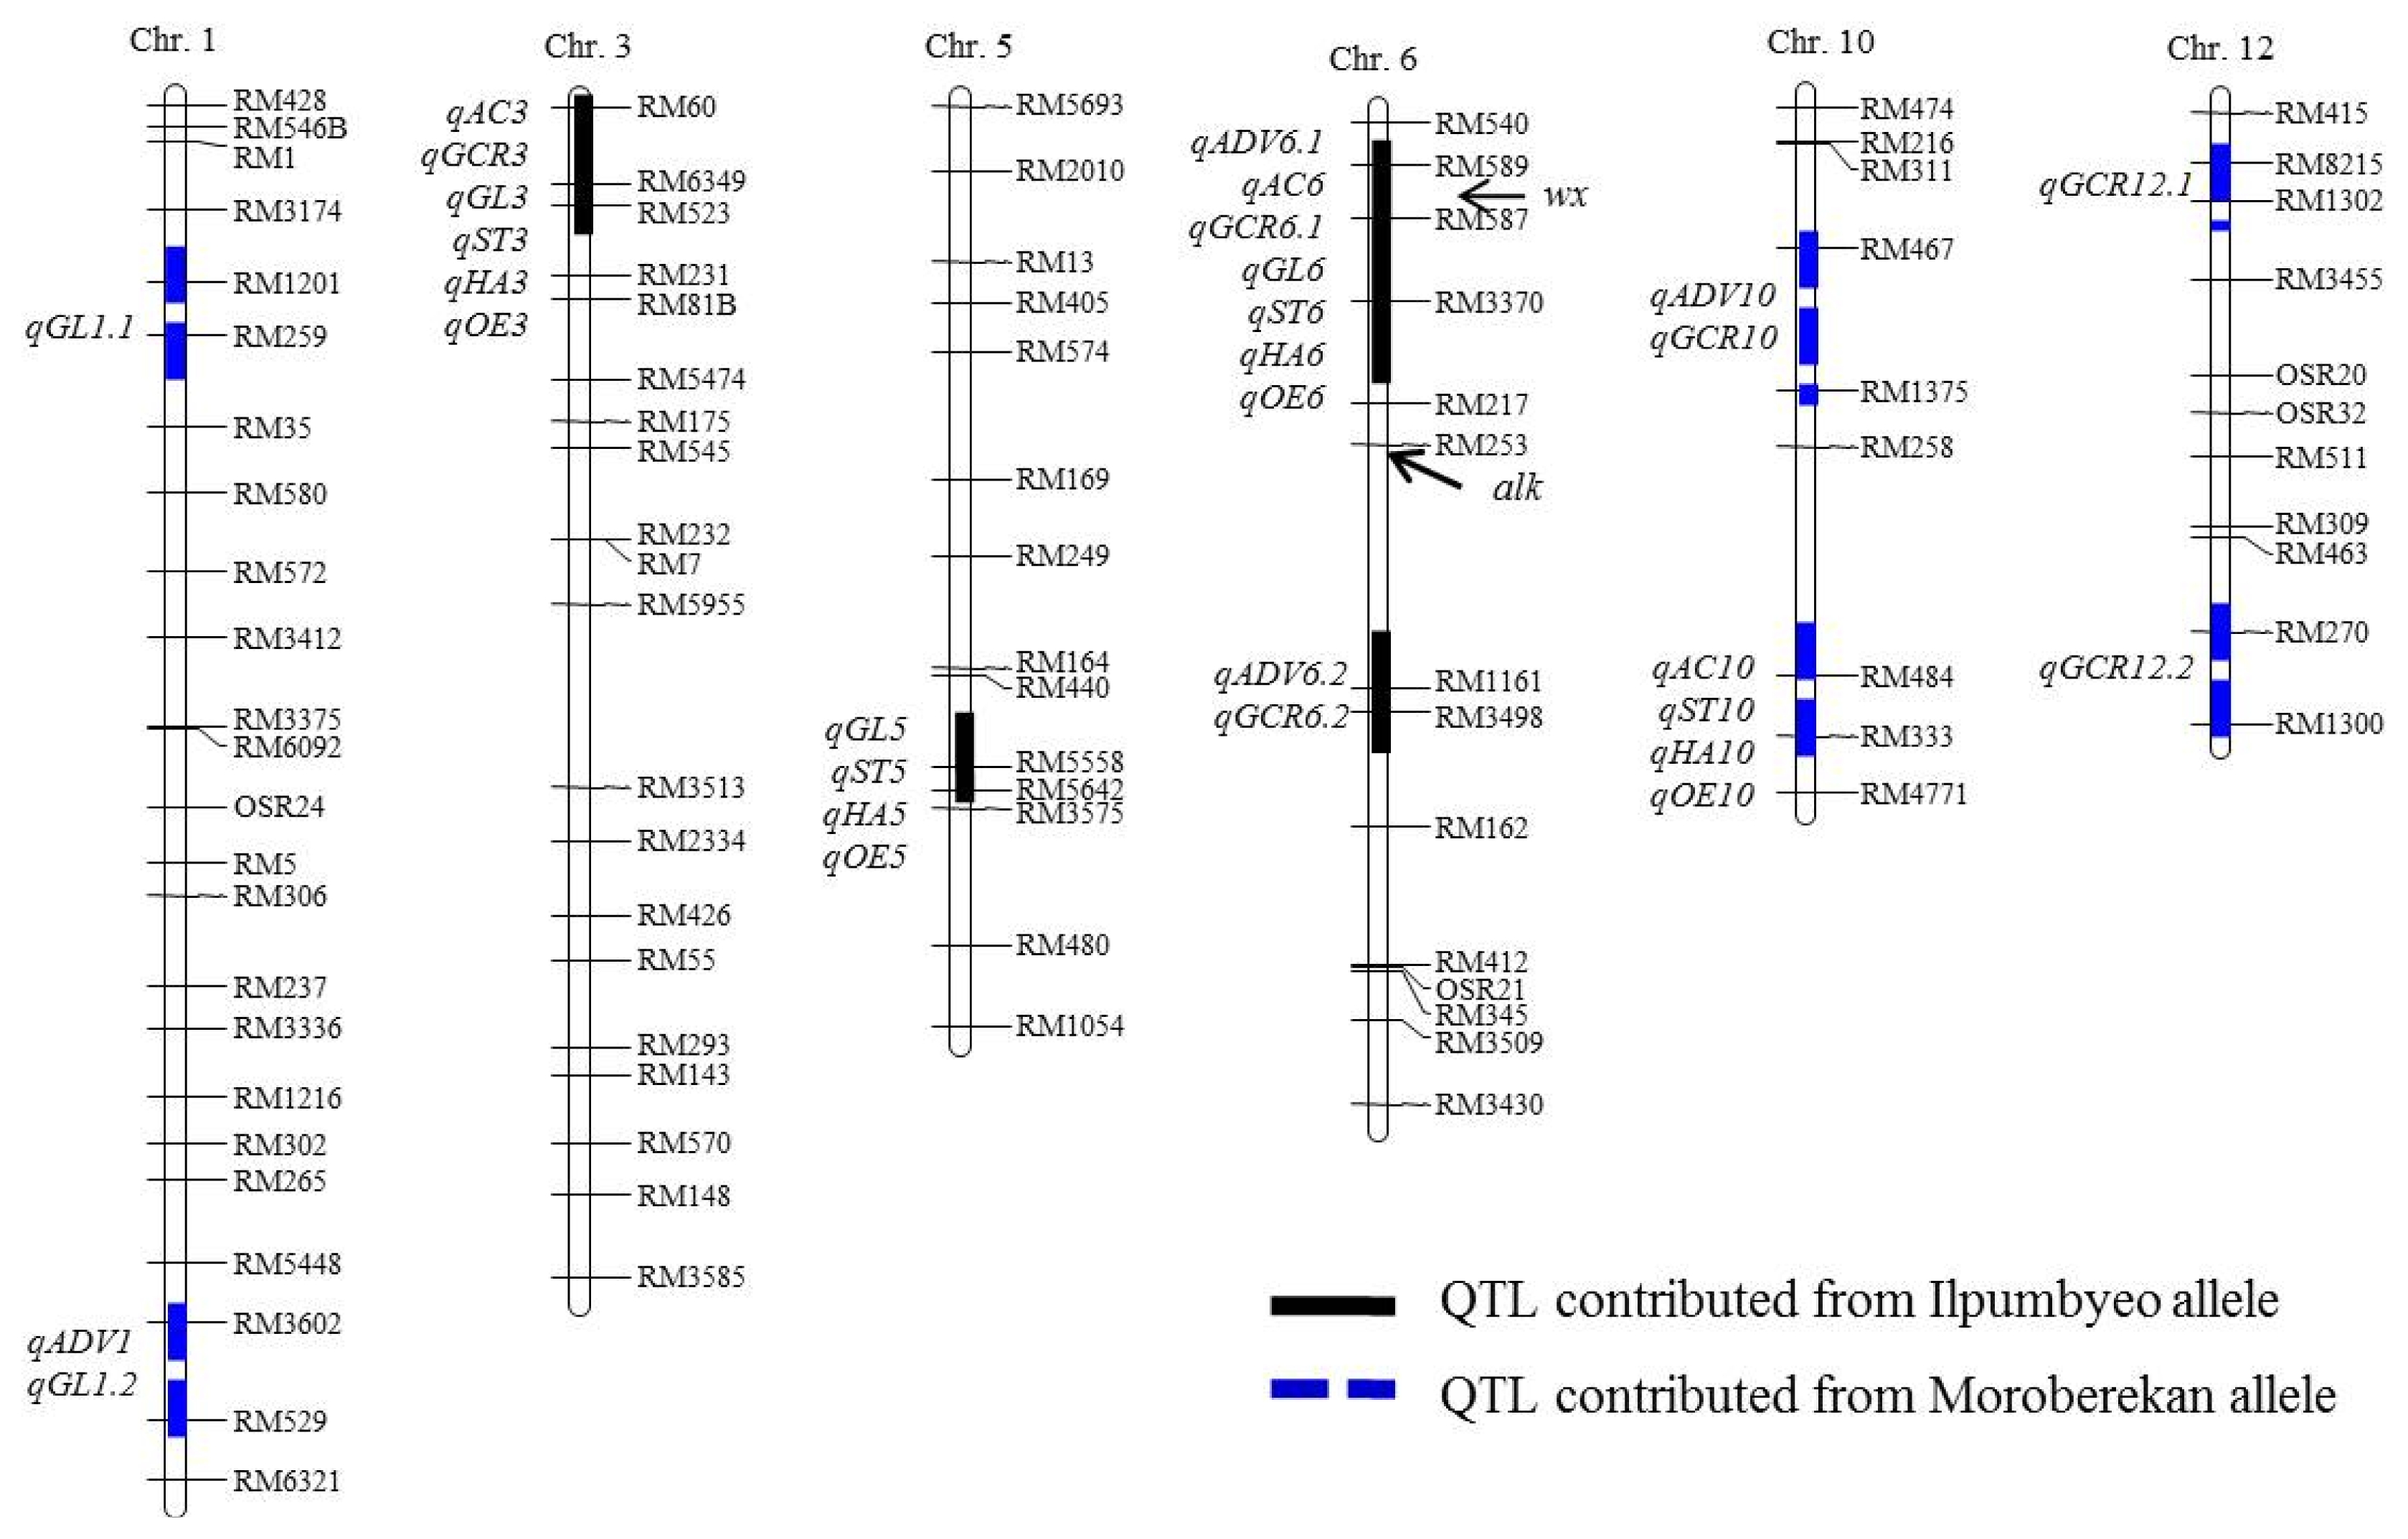
Fig. 4Putative QTLs for stickiness and hardness of palatability of cooked rice evaluated by three panels.
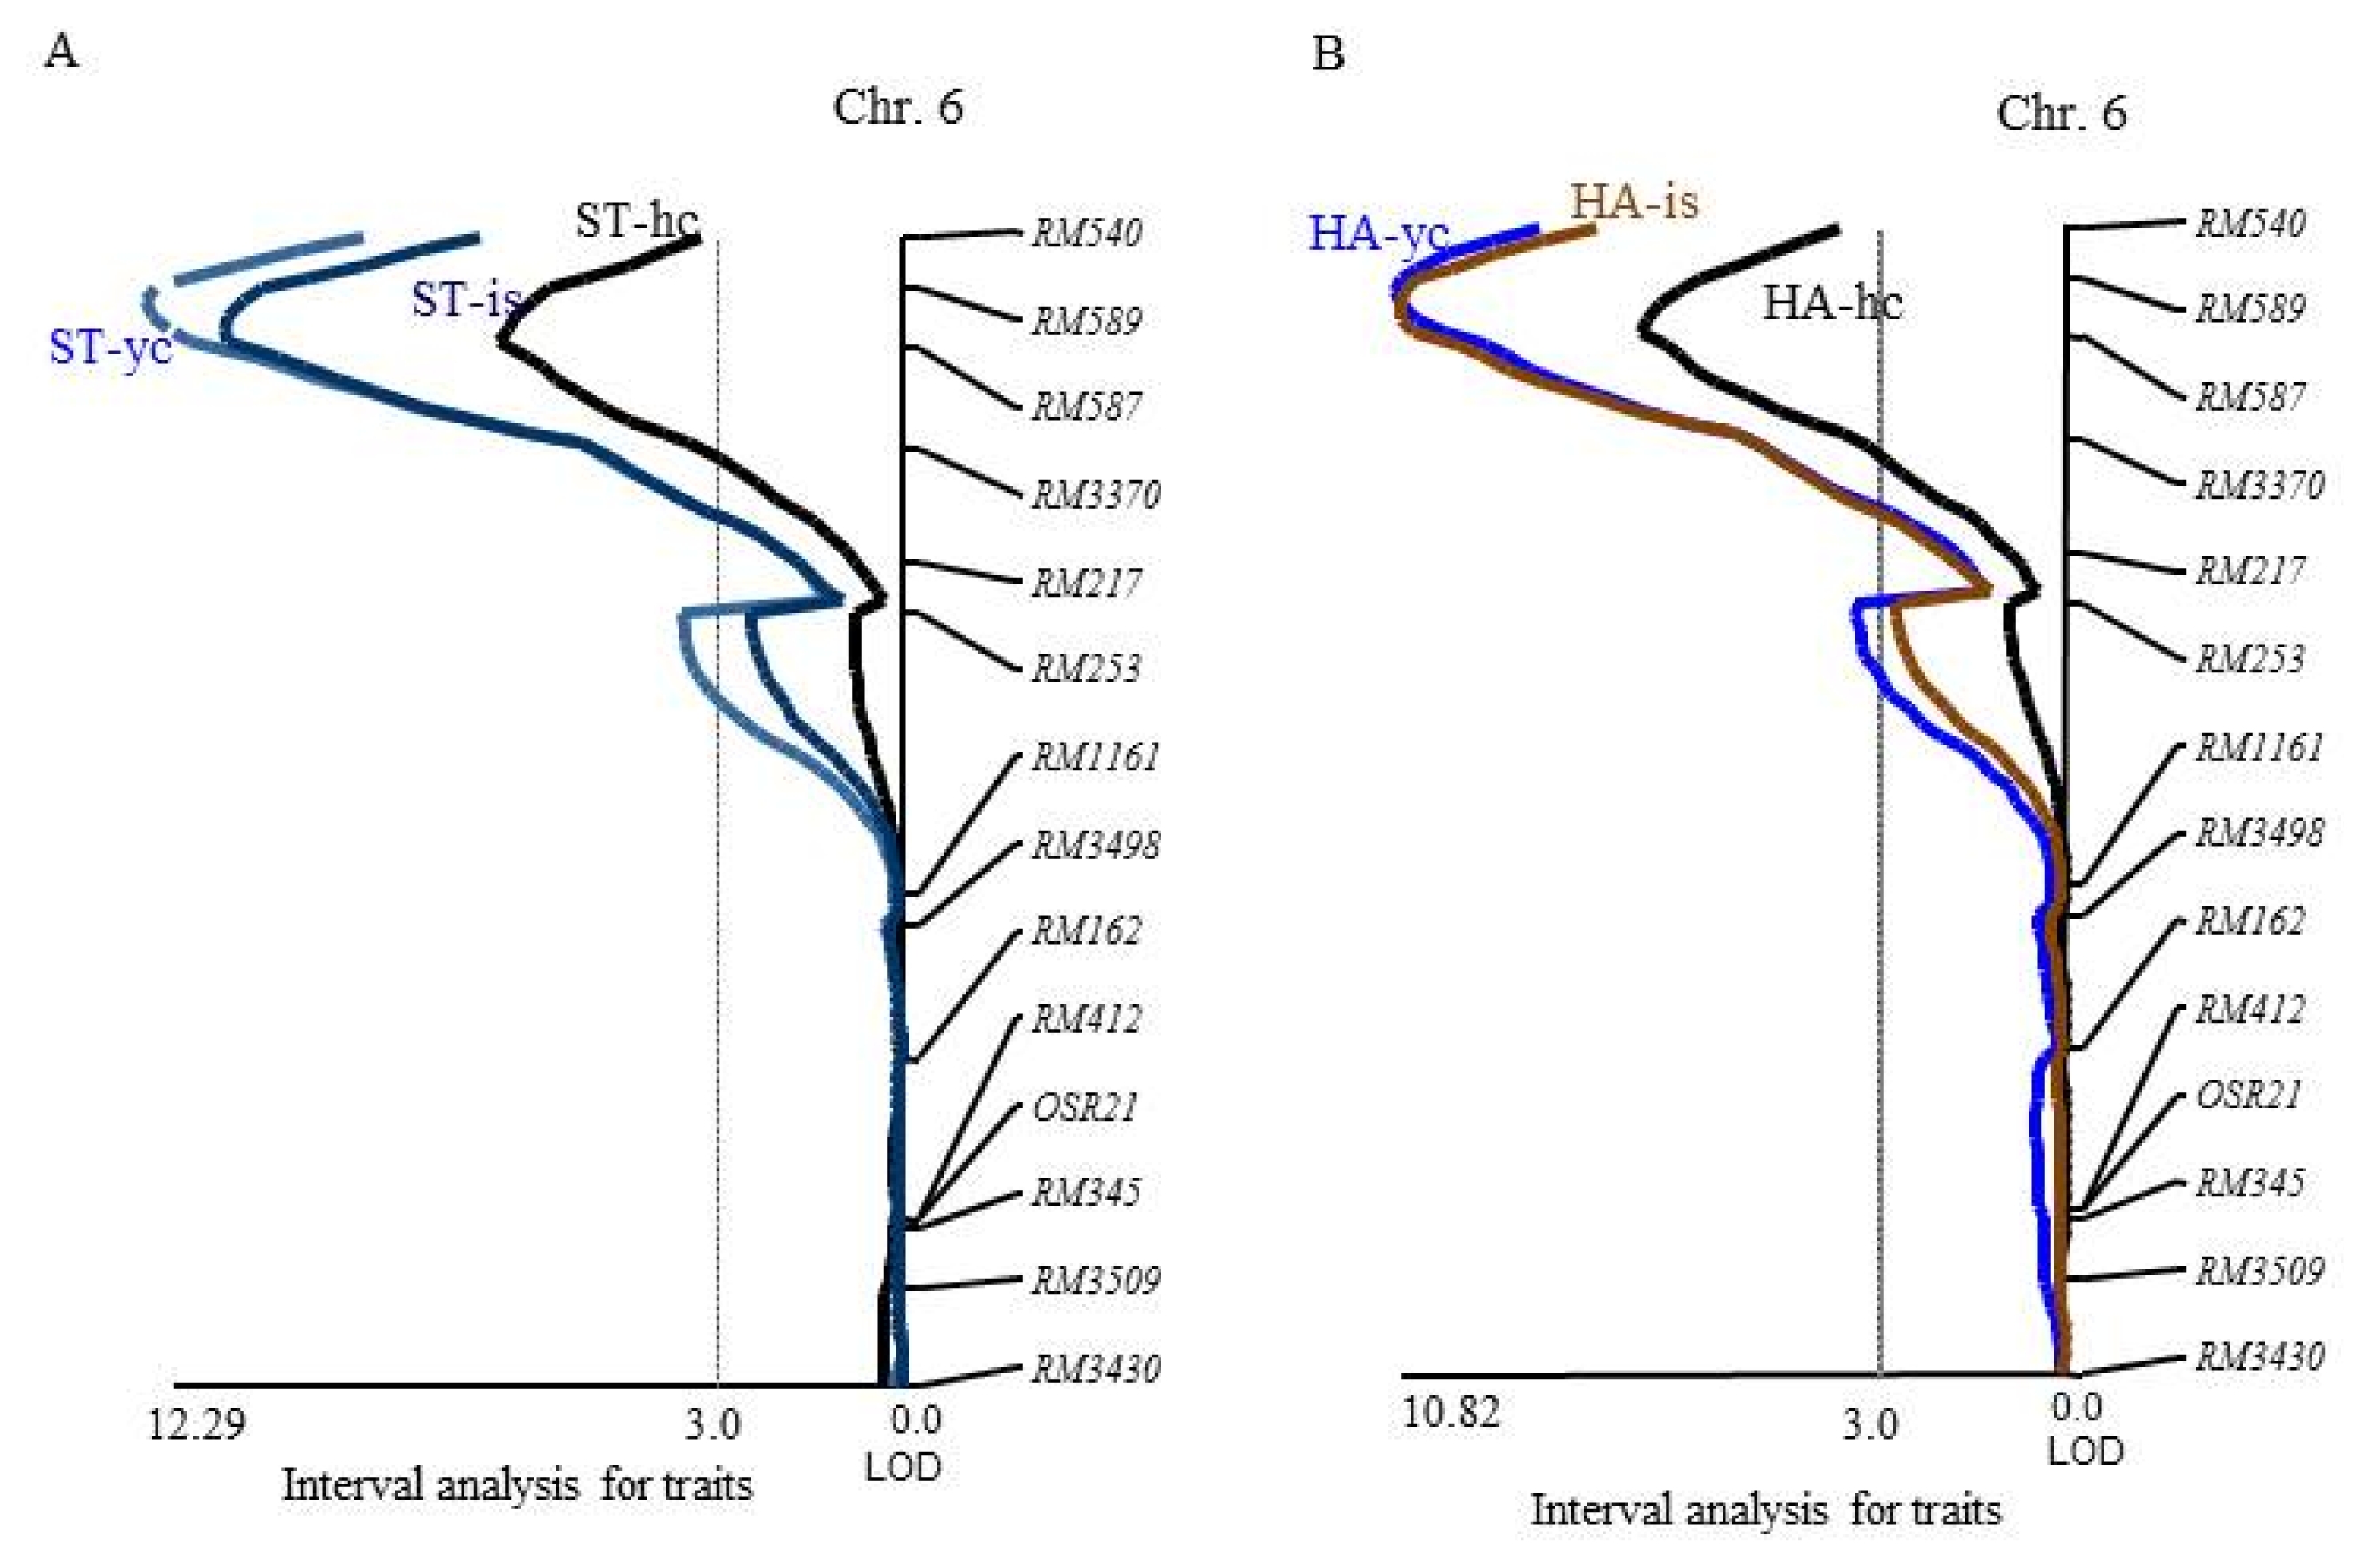
Table 1Correlation coefficients among two physico-chemical properties and five traits related to eating quality of cooked rice.
Table 1
|
(10)ADVz)
|
(11)ADV |
(10)AC |
(11)AC |
(10)GCR |
(11)GCR |
(11)GL |
(11)ST |
(11)HA |
|
(11)ADV |
0.752** |
|
|
|
|
|
|
|
|
|
(10)AC |
−0.023ns
|
0.094ns
|
|
|
|
|
|
|
|
|
(11)AC |
−0.010ns
|
0.172* |
0.836** |
|
|
|
|
|
|
|
(10)GCR |
0.536** |
0.626** |
−0.128ns
|
0.009ns
|
|
|
|
|
|
|
(11)GCR |
0.314** |
0.308** |
−0.315** |
−0.202* |
0.554** |
|
|
|
|
|
(11)GL |
- |
0.438** |
- |
−0.129ns
|
- |
0.469** |
|
|
|
|
(11)ST |
- |
0.501** |
- |
−0.543** |
- |
0.497** |
0.752** |
|
|
|
(11)HA |
- |
0.663** |
- |
−0.534** |
- |
0.494** |
0.746** |
0.967** |
|
|
(11)OE |
- |
0.538** |
- |
−0.501** |
- |
0.506** |
0.786** |
0.978** |
0.972** |
Table 2Putative QTLs detected for alkali digestive value, amylose content and glossiness of cooked rice determined by Toyo-taste meter.
Table 2
|
Trait |
QTL |
Chr. |
Year |
Linked markers |
LOD |
R2(%) |
Allele effect |
Allele typez)
|
|
ADV (Alkali digestive value) |
qADV1
|
1 |
2011 |
RM3602-RM529 |
3.69 |
9.9 |
1.38 |
MM |
|
qADV6.1
|
6 |
2010 |
RM587-RM3370 |
10.77 |
32.1 |
2.43 |
II |
|
2011 |
RM587-RM217 |
12.37 |
36.6 |
2.67 |
II |
|
qADV6.2
|
6 |
2010 |
RM1161-RM3498 |
4.12 |
11.7 |
1.80 |
II |
|
2011 |
RM1161-RM3498 |
5.15 |
13.6 |
2.05 |
II |
|
qADV10
|
10 |
2010 |
RM467-RM1375 |
4.08 |
10.6 |
1.55 |
MM |
|
2011 |
RM467-RM1375 |
3.24 |
8.8 |
1.30 |
MM |
|
|
Amylose content (%) |
qAC3
|
3 |
2010 |
RM6349-RM523 |
5.02 |
11.8 |
2.8 |
II |
|
2011 |
RM6349-RM523 |
3.23 |
8.5 |
2.1 |
II |
|
qAC6
|
6 |
2010 |
RM589-RM3370 |
22.47 |
47.3 |
5.1 |
II |
|
2011 |
RM589-RM3370 |
19.95 |
44.8 |
4.9 |
II |
|
qAC10
|
10 |
2010 |
RM484-RM333 |
3.76 |
9.9 |
2.6 |
MM |
|
2011 |
RM333 |
3.00 |
8.7 |
2.1 |
MM |
|
|
GCR (glossiness of cooked rice by Toyo-taste meter) |
qGCR3
|
3 |
2010 |
RM60-RM523 |
2.77 |
7.5 |
3.9 |
II |
|
2011 |
RM60-RM523 |
2.04 |
9.5 |
4.7 |
II |
|
qGCR6.1
|
6 |
2010 |
RM589-RM217 |
7.55 |
18.0 |
5.9 |
II |
|
2011 |
RM589-RM217 |
9.11 |
28.3 |
10.3 |
II |
|
qGCR6.2
|
6 |
2010 |
RM1161-RM3498 |
3.47 |
8.7 |
6.3 |
II |
|
2011 |
RM1161-RM3498 |
6.24 |
16.2 |
9.3 |
II |
|
qGCR10
|
10 |
2010 |
RM467-RM1375 |
2.53 |
6.9 |
5.3 |
MM |
|
2011 |
RM1375 |
2.13 |
5.4 |
4.3 |
MM |
|
qGCR12.1
|
12 |
2010 |
RM1302 |
2.02 |
5.9 |
4.7 |
MM |
|
2011 |
RM8215-RM1302 |
2.91 |
7.8 |
5.1 |
MM |
|
qGCR12.2
|
12 |
2010 |
RM270-RM1300 |
3.58 |
9.8 |
6.4 |
MM |
|
2011 |
RM270 |
2.36 |
6.1 |
4.6 |
MM |
Table 3Putative QTLs for glossiness, stickiness, hardness and overall evaluation by taste evaluation of panels
Table 3
|
Trait |
QTL |
Chr. |
Linked markers |
LOD |
R2(%) |
Allele effect |
Allele typez)
|
|
GL (Glossiness) |
qGL1.1
|
1 |
RM1201-RM259 |
2.59 |
7.2 |
0.71 |
MM |
|
qGL1.2
|
1 |
RM529 |
2.17 |
6.1 |
0.66 |
MM |
|
qGL3
|
3 |
RM60-RM523 |
5.58 |
15.7 |
1.06 |
II |
|
qGL5
|
5 |
RM5642 |
2.99 |
9 |
0.78 |
II |
|
qGL6
|
6 |
RM587-RM3370 |
3.08 |
8.4 |
0.76 |
II |
|
|
ST (Stickness) |
qST3
|
3 |
RM60-RM523 |
4.21 |
12.1 |
1.04 |
II |
|
qST5
|
5 |
RM5558-RM5642 |
2.59 |
7.6 |
0.82 |
II |
|
qST6
|
6 |
RM587-RM3370 |
15.94 |
38.5 |
1.84 |
II |
|
qST10
|
10 |
RM484-RM333 |
2.89 |
9.4 |
0.92 |
MM |
|
|
SF (Softness) |
qHA3
|
3 |
RM60-RM523 |
3.64 |
10.9 |
0.92 |
II |
|
qHA5
|
5 |
RM5558-RM5642 |
2.87 |
8.2 |
0.8 |
II |
|
qHA6
|
6 |
RM587-RM3370 |
14.64 |
37.4 |
1.74 |
II |
|
qHA10
|
10 |
RM484-RM333 |
2.1 |
6.9 |
0.73 |
MM |
|
|
OE (Overall evaluation) |
qOE3
|
3 |
RM60-RM523 |
4.19 |
12.7 |
0.97 |
II |
|
qOE5
|
5 |
RM5558-RM5642 |
2.5 |
7.3 |
0.73 |
II |
|
qOE6
|
6 |
RM587-RM3370 |
12.96 |
34.3 |
1.64 |
II |
|
qOE10
|
10 |
RM484-RM333 |
2.38 |
7.9 |
0.77 |
MM |
References
- Aluko G, Martinez C, Tohme J, Castano C, Bergman C, Oard JH. 2004. QTL mapping of grain quality traits from the interspecific cross Oryza sativa x O. glaberrima. Theor Appl Genet. 109: 630-639.
- Bao JS, Xia YW. 1999. Genetic control of paste viscosity characteristics in indica rice (Oryza sativa L.). Theor Appl Genet. 98: 1120-1124.
- Bao JS, Zheng XW, Xia YW, He P, Shu QY, Lu X, Chen Y, Zhu LH. 2000. QTL mapping for the paste viscosity characteristics in rice (Oryza sativa L.). Theor Appl Genet. 100: 280-284.
- Bao JS, Wu YR, Hu B, Wu P, Cui HR, Shu QY. 2002. QTL for rice grain quality based on a DH population derived from parents with similar apparent amylose content. Euphytica. 128: 317-324.
- Basten CJ, Weir BS, Zeng ZB. 1997. QTL Cartographer: A reference manual and tutorial for QTL mapping. Department of Statistics, North Carolina State University. Raleigh, NC, USA.
- Cho YC, Suh JP, Yoon MR, Baek MK, Won YJ, Lee JH, Park HS, Baek SH, Lee JH. 2013. QTL mapping for paste viscosity characteristics related to eating quality and QTL-NIL development in japonica rice (Oryza sativa L.). Plant Breed Biotech. 1(4): 333-346.
- Choi HC. 2006. A guide to rice breeding. Rural Development Administration (in Korean). pp. 273-299.
- Ebitani T, Takeuchi Y, Nonoue N, Yamamoto T, Takeuchi K, Yano M. 2005. Construction and evaluation of chromosome segment substitution lines carrying overlapping chromosome segments of indica rice cultivar ‘Kasalath’ in a genetic background of japonica elite cultivar ‘Koshihikari’. Breed Sci. 55: 65-73.
- Fan CC, Yu XQ, Xing YZ, Xu CG, Luo LJ, Zhang QF. 2005. The main effects, epistatic effects and environmental interactions of QTLs on the cooking and eating quality of rice in a doubled-haploid line population. Theor Appl Genet. 110: 1445-1452.
- Ge XJ, Xing YZ, Xu CG, He YQ. 2005. QTL analysis of cooked rice grain elongation, volume expansion, and water absorption using a recombinant inbred population. Plant Breeding. 124: 121-126.
- Guleria S, Sharma V, Marathi B, Anand S, Singh S, Singh NK, Mohapatra T, Gopala S, Prabhu KV, Singh AK. 2012. Molecular mapping of grain physico-chemical and cooking quality traits using recombinant inbred lines in rice (Oryza sativa L.). J Plant Biochem Biothech. 21: 1-10.
- He Y, Han YP, Jiang L, Xu CW, Lu JF, Xu ML. 2006. Functional analysis of starch-synthesis genes in determining rice eating and cooking qualities. Mol Breed. 18: 277-290.
- Ideta O, Yoshimura A, Matsumoto T, Tsunematsu H, Saito H, Iwata N. 1993. Integration of conventional and RFLP linkage maps in rice, II. Chromosome 6, 9, 10 and 11. RGN. 10: 87-89.
- Juliano BO. 1971. A simplified assay for milled rice amylose. Cereal Sci Today. 16: 334-336.
- Kobayashi A, Tomita K. 2008. QTL detection for stickiness of cooked rice using recombinant inbred lines derived from crosses between japonica rice cultivars. Breeding Sci. 58: 419-426.
- Kwon S, Cho YC, Lee JH, Suh JP, Kim JJ, Kim MK, Choi IS, Hwang HG, Koh HJ, Kim YG. 2011. Identification of quantitative trait loci associated with rice eating quality traits using a population of recombinant inbred lines derived from a cross between two temperate japonica cultivars. Mol Cells. 31: 437-445.
- Lestari P, Ham TH, Lee HH, Woo MO, Jiang W, Chu SH, Kwon SW, Ma KH, Lee JH, Cho YC, Koh HJ. 2009. PCR marker-based evaluation of the eating quality of japonica rice (Oryza sativa L.). J Agric Food Chem. 57: 2754-2762.
- Li J, Zhang W, Wu H, Gou T, Liu X, Wan X, Jin J, Hanh T, Thao N, Chen M, Liu S, Chen L, Liu X, Wang J, Zhai H, Wan J. 2011. Fine mapping of stable QTLs related to eating quality in rice (Oryza sativa L.) by CSSLs harboring small target chromosome segments. Breeding Sci. 61: 338-346. QTL.
- Li Z, Wan J, Xia J, Yano M. 2003. Mapping of quantitative trait loci controlling physico-chemical properties of rice grains (Oryza sativa L.). Breeding Sci. 53: 209-215.
- Lin HX, Yamamoto T, Sasaki T, Yano M. 2000. Characterization and detection of epistatic interactions of 3 QTLs, Hd1, Hd2, and Hd3, controlling heading date in rice using nearly isogenic lines. Theor Appl Genet. 101: 1021-1028.
- Little RR, Hilder GB, Dawson EH. 1958. Differential effect of dilute alkali on 25 varieties of milled white rice. Cereal Chem. 35: 111-126.
- Matsue Y. 1992. On a sensory test of cooked rice in which 10 cultivars were evaluated by 13 panel members. J Home Econ Jpn. 43: 1027-1032.
- Nelson JC. 1997. Qgene: software for marker-based genomic analysis and breeding. Mol Breed. 3: 239-245.
- Nishimura M, Yamauchi F, Ohuchi K, Hamamura K. 1985. Evaluation of the eating quality of recent rice varieties and lines in Hokkaido - The relation between organoleptic and physicochemical qualities of milled rice harvested in an extremely cool year and a very hot year during the summer. Res Bull Hokkaido Natl Agric Exp Stn. 144: 77-89.
- Rural Development Administration (RDA).1990. Report of New Rice Variety Deliberate Council for Local Adaptability Test in Agricultural Crops. pp. 467. (in Korean).
- Sano Y, Hirano HY, Nishimura M. 1991. Evolutionary significance of differential regulation at the wx locus of rice. Rice Genetics. II: pp. 11-20. IRRI. Manila, Philippines.
- Shu QY, Wu DX, Xia YW, Gao MW, McClung A. 1998. Relationship between RVA profile character and eating quality in Oryza sativa L. Sci Agric Sinica. 31: 25-29.
- Takeuchi Y, Nonoue Y, Ebitani T, Suzuki K, Aoki N, Sato H, Ideta O, Hirabayashi H, Hirayama M, Ohta H, et al. 2007. QTL detection for eating quality including glossiness, stickness, taste and hardness of cooked rice. Breeding Sci. 57: 231-242.
- Takeuchi Y, Hori K, Suzuki K, Nonoue Y, Takemoto-Kuno Y, Maeda H, Sato H, Hirabayashi H, Ohta H, Ishii T, et al. 2008. Major QTLs for eating quality of an elite Japanese rice cultivar, Koshihikari, on the short arm of chromosome 3. Breeding Sci. 58: 437-445.
- Tanaka I, Kobayashi A, Tomita K, Takeuchi Y, Yamagishi M, Yano M, Sasaki T, Horiuchi H. 2006. Detection of quantitative trait loci for stickiness and appearance based on eating quality test in japonica rice cultivar. Breed Res. 8: 39-47. (in Japanese with English abstract).
- Tian R, Jiang GH, Shen LH, Wang LQ, He YQ. 2005. Mapping quantitative trait loci underlying the cooking and eating quality of rice using a DH population. Mol Breed. 15: 117-124.
- Umemoto T, Yano M, Satoh H, Shomura A, Nakamura Y. 2002. Mapping of a gene responsible for the difference in amylopectin structure between japonic a-type and indica- type rice varieties. Theor Appl Genet. 104: 1-8.
- Wada T, Uchimura Y, Ogata T, Tsubone M, Matsue Y. 2006. Mapping of QTLs for physico- chemical properties in japonica rice. Breeding Sci. 56: 253-260.
- Wada T, Ogata T, Tsubone M, Uchimura Y, Matsue Y. 2008. Mapping of QTLs for eating quality and physico-chemical properties of the japonica rice ‘Koshihikari’. Breeding Sci. 58: 427-435.
- Wan XY, Wan JM, Su CC, Wang CM, Shen WB, Li JM, Wang HL, Jiang L, Liu SJ, Chen LM, Yasui H, Yoshimura A. 2004. QTL detection for eating quality of cooked rice in a population of chromosome segment substitution lines. Theor Appl Genet. 110: 71-79.
- Wang GL, Mackill DJ, Bonman JM, McCouch SR, Champoux CM, Nelson RJ. 1994. RFLP mapping of genes conferring complete and partial resistance to blast in a durably resistant rice cultivar. Genetics. 136: 421-434.
- Wang LQ, Liu WJ, Xu Y, He YQ, Luo LJ, Xing YZ, Xu CG, Zhang QF. 2007. Genetic basis of 17 traits and viscosity parameters characterizing the eating and cooking quality of rice grain. Theor Appl Genet. 115: 463-476.
- Yamamoto T, Horisue N, Ikeda R. 1996. Rice breeding manual. Yokendo Ltd.. Tokyo, Japan: pp. 74-124.
- Yamamoto Y, Ogawa T. 1992. Eating quality in Japanese rice cultivars. Jpn J Breed. 42: 177-183.
- Yokoo M, Kikuchi F. 1977. Multiple allelism of locus controlling heading time of rice detected using the close linkage with blast-resistance. Japan J Breed. 27(2): 123-130. (in Japanese with English summary).
- Yun YT. 2014. Analysis of quantitative trait loci associated with agronomic and rice quality using introgression lines carrying wild rice chromosome segments in cultivated rice background. Ph D Thesis Chungnam National University. 103. (in press).