Abstract
The genetic variability and yield stability are complex traits with large environmental components that are utilized for breeding of improved plant performance under drought conditions. In order to better understand the relationship among genotype, trait components, and environment, marker-trait associations in 20 wheat varieties using phenotypic and ISSR (Inter-Simple Sequence Repeat) markers under drought conditions were examined. The combined analysis of variance results showed that the tested traits were significantly influenced by years, irrigation treatments, and the varieties. The drought stress conditions resulted in a substantial reduction in grain yield by 33.70%. The varieties viz., Shakha-93, Sahel-1, Giza-160, Giza-168, Sids-1, Sids-4 and Nilen were relatively drought resistant (DSI, Drought Susceptibility Index values< 1) and gave high grain yield when compared with the average of all varieties under drought stress. The stability analysis revealed that the cultivar named ‘Sids-1’ showed high and stable yield (bi=1 and S2di = 0), so it could be selected to be grown under drought stress conditions. On the other hand, Shakha-92 and Bacanora-88 showed below-average stability (bi = 1.35 & 1.42), indicating that these genotypes perform well under normal conditions. The percent of polymorphism (%P) among varieties ranged from 25 to 80% with an average of 52.08%. Polymorphism information content (PIC) values varied from 0.08 to 0.28. Plant height and 1000-kernel weight showed significant regressions (23.83 and 27.54) under normal irrigation conditions, respectively. Moreover, under drought stress conditions, plant height, 1000-kernel weight and no. of spikes/m2 showed significant regressions of 40.38, 20.95 and 24.95, respectively.
-
Key words: ISSR markers, Agronomic traits, Regression, Stability, Triticum aestivum L
INTRODUCTION
Wheat (
Triticum aestivum L.) is one of the most important crops in Egypt. Increasing grain yield of wheat is the most important national goal to face the continuous increase in food demand of the Egyptian population. In the past decade, there has been marginal increase in the productivity of wheat, particularly under environments relatively favorable for growth and development of wheat (
Joshi et al. 2007). On the other hand, there is a substantial scope for improvement in the productivity under unfavorable environments that are influenced by a significant presence of abiotic stresses such as drought stress (
Aggarwal 1991;
Joshi et al. 2007).
Genetic improvement for grain yield has been demonstrated under both normal and stress conditions over a period of several decades (
Blum 1989). The moisture stress imposed at different plant growth stages e.g., vegetative growth, flowering, grain filling stages and/or all the combined growth stages together resulting in significant reduction in all vegetative, yield and yield components characters (
Kassab and El-Zeinty 2005). DSI is a measure of yield stability under drought stress conditions (
Ahmad et al. 2003). The DSI sometimes has been represented as a measure of genotypic yield potential under drought stress conditions (
Brukner and Frohberg 1987). However, DSI does not account for differences in yield potential among genotypes (
Clarke et al. 1992).
Grain yield stability is one of the most important needs of agriculture. The ideal wheat genotype should be high and stable yielding under wide range of environmental conditions. Various statistical techniques have been developed to identify systematic variation in individual genotypic responses.
Eberhart and Russell (1966) model has been widely used in studies of adaptability and stability of plant materials. Also, the coefficient of determination (r
2) used by
Pinthus (1973) measures the proportion of a genotype’s production variation that is attributable to the linear regression as an index of production stability over different environments. According to
Crossa et al. (1988), the selection of superior genotypes in a plant-breeding program is based mainly on their yield potential and stable performance over a wide range of environmental conditions.
Understanding the relationship between genotypic and phenotypic variation lies at the heart of the study of genetics and is also critically important to applications in plant breeding. Genetic diversity among crop plants is desirable for improving plant population. Determination of genetic diversity for various crop plants is one of the important tools in any plant breeding program because if more diversity occurs in crop species, chances of selection efficiency will be increase. Morphological, physiological and cytogenetic plant characters are used at present as selection criteria but they are not stable and affected greatly by the environmental conditions. However, the selection based on molecular markers is more stable than the above mentioned characters. Crop physiology and genomics have led to new insights in drought tolerance studies by providing the breeders with new knowledge and tools for plant improvement (
Tuberosa and Salvi 2006). Looking for the coincidence of loci for specific traits and loci for yield component under drought stress and in stress-free environments, it is possible to test more precisely whether a specific trait of significant importance in improving drought tolerance and yield potential.
Inter-simple sequence repeats (ISSRs) is one of the DNA-based markers that has been widely used in studies of cultivar evolution and molecular ecology (
Karaca and Izbriak 2008). The ISSR markers could be efficiently used to evaluate genetic variation in the wheat genotypes (
Sofalian et al. 2008;
Najaphy et al. 2011). Different molecular markers are currently available for genome mapping and tagging of different traits that is useful for marker assisted breeding techniques of wheat improvement under stress conditions (
Ashraf 2010). The objectives of this work are to assess genetic diversity and marker-trait associations in 20 bread wheat varieties using phenotypic and ISSR markers under normal and drought stress conditions.
MATERIALS AND METHODS
Plant materials
Twenty bread wheat (
Triticum aestivum L.) varieties (
Table 1) were planted at Experimental Farm of Faculty of Agriculture, Sohag University, Egypt, during 2011/2012 and 2012/2013 winter seasons.
Two experiments were conducted in two successive seasons of 2011/2012 and 2012/2013. The two irrigation treatments were; I1 (normal “N”): Ten irrigations through all growth stages in wheat crop were supplied and I2 (drought stress “D”): four irrigations only were applied at the planting, the tillering, the booting and the heading stages, respectively. The experimental design was a randomized complete block with a split-plot arrangement of treatments, with four replications. The irrigation treatments were allocated to the main plots and wheat varieties to the subplots. Each plot consisted of 15 rows (20 cm spacing) of 3.5 meter length, i.e., 10.5 m2 (1/400 feddan) and then converted to hectare (feddan= 0.42 hectare). Planting date was 20th and 22th November in 2011/2012 and 2012/2013 seasons, respectively. The experimental field soil was sandy-clay in texture. The normal agronomic practices of growing wheat except irrigation were carried out until harvest time.
Data recorded
Plant height (cm), number of spikes/m2, spike length (cm) and 1000-kernel weight (g, grams) were measured. Grain and biological yields (ton/hectares) were determined per plot and then converted to yield per hectare. Thus, harvest index (grain yield / total biological yield) was determined.
Statistical analysis
The combined analysis of the two season’s data was conducted according to
Gomez and Gomez (1984). The means of varieties were compared using the Revised Least Significant Difference (RLSD) method at 5% and 1% of probability. Statistical analysis was performed using “MSTATC” microcomputer program (
MSTATC 1990).
Stability analysis of grain yield of the tested genotypes was done for the four environmental conditions (2-irrigation treatments and 2-years). Stability was defined as a function of slope and deviation from the regression of cultivar yield on an environmental index. Yield stability and stability parameters were analyzed similar to that suggested by
Eberhart and Russell (1966). Coefficient of Variance (CV%) was estimated according to
Francis and Kannenbert (1978). The coefficient of determination (r
2) was proposed to use by
Pinthus (1973). Relative Yield Reduction (RYR%) = (1-yield under drought / yield under normal)*100. DSI was calculated according to the method of
Fischer and Maurer (1978).
Fresh young leaves from wheat plantlets were harvested and immediately ground in extraction buffer using cetyltrimethylammonium bromide (CTAB) protocol as described by
Poresbski et al. (1997). A total of 20 varied ISSR primers (Metabion International AG, Germany), were scanned across genotypes. Genomic DNA amplification was carried out in a DNA Thermal Cycler (Primus 25, Germany) according to the methods described by
Williams (1990). The ISSRs assays were performed in a 25μl volume containing 12.5 μl of Go Taq® Green Master Mix (Promega, Madison, USA), 3.5 μl of primer 8 pmol, 7 μl of free nuclease water and 2 μl of 100 ng genomic DNA templates. PCR amplification was programmed for conditions with preliminary initial denaturation cycle at 94°C for five minutes. The following 35 cycles were composed of: denaturation step at 94°C for 30 sec, annealing step for 1 min at 50 to 60°C (annealing step, optimized for each primer), and elongation step at 72°C for 2 min 30 sec. The final cycle of polymerization was performed at 72°C for 5 min. The PCR products were separated on a 1% agarose gel electrophoresis. The amplified fragments were visualized and photographed using UVP Bio Doc-It imaging system (USA).
The DNA banding patterns generated by ISSR markers were analyzed by Gene Profiler software (version 4.03). The presence (1) or absence (0) of each band was recorded for each line for all the tested primers. To measure the informativeness of the ISSR markers in differentiating among 20 wheat varieties, polymorphism information content (PIC) was calculated according to the formula of
Ghislain et al. (1999) as PIC= 1- [(p)
2 + (q)
2] where
p is the frequency of allele band present and
q is frequency of allele band absent across wheat varieties. The marker index (MI) was also calculated for each ISSRs primer as MI = PIC x
ηβ, where PIC is the mean PIC value,
η the number of bands, and
β is the proportion of polymorphism (
Powell et al. 1996). Analysis of variance (ANOVA) was conducted using the 1–0 data. The association analysis was conducted using simple linear regression. Data on individual phenotypic trait were regressed on whole 1–0 binary marker data for each individual marker using MS Excel program. The coefficient of determination (
R2) was calculated as
R2 = 1 – (SSE / SST), where SSE and SST are the sum of squares of error and the total sum of squares, respectively.
RESULTS
Phenotypic evaluation
Mean performance and variation
The combined analysis of variance (
Table 2) revealed highly significant differences between genotypes, irrigation treatments, and years for all the studied traits except harvest index was unaffected by years. Furthermore, mean squares due to irrigation x varieties (I x V) interaction were highly significant for all studied traits.
Results in
Table 3 showed that plant height, grain yield and yield components traits were significantly affected by drought stress in both growing seasons. Local cultivar ‘Giza-168’ exhibited the tallest plants (105.00 and 95.53 cm) while the shortest plants were for the cultivar ‘Sakha-93’ (86.95 and 72.23 cm) under normal irrigation and drought stress respectively. The variety Sids-4 had the longest spikes (14.74 and 12.16 cm) and the highest 1000-kernel weight (44.39 and 34.98 g) while the highest value for number of spikes/m
2 was for the cultivar ‘Sids-1’ (369.25 and 307.50/m
2) under normal and drought stress respectively. Also, the cultivar
viz. Nilen gave the highest harvest index (35.18%) under normal treatment and the cultivar Sakha-93 gave the highest harvest index (28.02%) under drought stress. The grain yield differed among wheat varieties (
Table 3). Cultivars Sids-1 and Nilen produced the highest grain yield (5.26 and 3.66 ton/hec.) and (5.30 and 3.59 ton/hec.) under normal irrigation and drought stress respectively. While, local cultivar ‘Gemmeza-9’ produced the lowest grain yield under normal conditions (4.01 ton/hec.), and the cultivar ‘Bacanora-88’ produced the lowest yield under drought stress conditions (2.58 ton/hec.) in the two years.
Regarding the interaction between irrigation treatments and wheat varieties on grain yield, drought stress conditions resulted in a substantial reduction in grain yield by 33.70%, while the varieties under normal irrigation conditions performed well for grain yield (
Table 5). The lowest percent of the reduction in grain yield were 22.27, 25.02, 29.40 and 29.78% (average of the two seasons) for the cultivars
viz. Gammeza-10, Sids-4, Giza-164 and Canada-515, respectively. The cultivar ‘Nilen’ produced the highest grain yield by 5.30 ton/hectare when compared with the other varieties under the normal irrigation conditions, mean while the cultivar, ‘Sids-1’ gave the highest yield by 3.66 ton/hectare under drought stress conditions.
The combined analysis of variance (
Table 4) revealed highly significant differences among environments (E), genotypes (G), and genotype by environment (G×E) interaction for all the studied traits except for harvest index that was not significant.
The stability parameters b
i, S
2d
i and r
2 were used as selection criteria of the stability in grain yield associated with high mean (
Table 5). In the analysis of environments (2-years × 2-irrigation treatments), the cultivar ‘Sids-1’ was stable over all the tested environments (b
i=1 and S
2d
i = 0) with high coefficient of determination (r
2) and gave high mean yields by 4.46 ton/hectare. The cultivars Sakha-93, Sahel-1, Giza-168, Canada-462 and Nilen gave high mean yields by 4.04, 4.24, 4.32, 3.95 and 4.44 ton/hectare, respectively compared with the grand mean (3.91 ton/hec.). Also, they gave high r
2, insignificant b
i and S
2d
i. On the other hand, the cultivars ‘Shakha-92’ and ‘Bacanora-88’ showed below-average stability (b
i = 1.35 & 1.42), respectively.
Drought susceptibility index values (
Table 5) ranged from 0.67 for ‘Gemmeza-10’ to 1.24 for ‘Bacanora-88’. The varieties
viz., ‘Sakha-93, Sahel-1, Giza-160, Giza-168, Sids-1, Sids-4 and Nilen’ were relatively drought resistant (DSI values < 1) and produced high grain yield by 3.25, 3.45, 3.34, 3.57, 3.66, 3.25 and 3.59 ton/hec., respectively under drought stress when compared with the average of all the tested varieties. The cultivars
viz., ‘Shakha-92, Sonora-64, Canada-462 and Bacanora-88’ were relatively drought susceptible (DSI > 1).
In this work, nine out of 20 primers revealed different degrees of polymorphism (%P) among 20 bread wheat varieties. Out of 48 amplified products, 25 were scored polymorphic. The %P ranged from 25% (UBC-880) to 80% (UBC-834) with an average of 52.08% (
Table 6). The PIC values for the nine ISSR primers were varied from 0.08 to 0.28 (
Table 6). The MI values ranged from 0.08 to 1.25 for the primers UBC-880 and UBC-811 respectively.
This investigation involved 20 varieties, which exhibit moderate to high genetic variability. Using simple linear regression method, a total of 25 ISSR polymorphic molecular markers were identified: five of which showed significant and highly significant association with the tested traits. Results showed that two markers (UBC-811
775bp and UBC-840
1530bp) were identified for the character
viz., 1000-kernel weight trait and two markers UBC-811
775bp and UBC-840
535bp were identified for plant height and No. of spikes/m
2 traits (
Table 7). The associated markers each explained a maximum regression from 20.95 (1000-kernel weight) to 40.38% (plant height) of the total available variation for individual associated traits (
Table 7). Under normal irrigation conditions, results in
Table 7 showed significant regressions (23.83,
p=0.03) and (27.54,
p=0.02) on plant height and 1000-kernel weight traits respectively. On the other hand, under drought stress conditions results showed significant regressions of 40.38, 20.95 and 24.95 for the characters
viz., plant height, 1000-kernel weight and No. of spikes/m
2 traits respectively.
DISCUSSION
Wheat crop production and improvement under stress conditions is an important aim for plant breeders, who are looking for genetic diversity for stress tolerance and high yield production. Large scale trait evaluations may enhance the utilization of plant genetic resources collections by increasing genetic variability for economically significant traits in wheat breeding program. Using selection based on the tolerance indices that are calculated from the yield under different conditions, we can breed for the genotypes that adapted to a wide range of drought stress conditions. The reduction of grain yield by drought stress could be attributed to grain–filling process that is harmfully affected by drought stress and kernels that is reaching to maturity stage before complete filling (
Menshawy 2007). The moisture stress imposed at the different growth stages
i.e., vegetative growth stage or flowering stage or grain filling stage and/or all growth stages together reduced significantly all vegetative, yield and yield components characters (
Kassab and El-Zeiny 2005). The results of our study showed the significant variations found among the varieties suggesting the importance of the assessment of genotypes performance under different environments in order to identify the best genetic make up for a particular environment.
Drought susceptibility index (DSI) is a measure of yield stability (
Ahmad et al. 2003). DSI actually provides a measure of yield stability based on minimization of yield loss under stressed compared to non-stressed conditions rather than on yield level under dry conditions per se (
Clarke et al. 1984). Superior varieties for drought tolerance gave the low values of drought susceptibility index and the highest grain yield under drought stress conditions. The varieties ‘Shakha-93, Sahel-1, Giza-160, Giza-168, Sids-1, Sids-4 and Nilen’ were relatively drought tolerant (DSI values < 1) and gave high grain yield by 3.25, 3.45, 3.34, 3.57, 3.66, 3.25 and 3.59 ton/hectare respectively under drought stress when compared with the average of all the tested varieties (
Table 5) and therefore these varieties reflected good drought tolerance potential. Thus, these varieties can be used as a donor parents in wheat breeding program by crossing with local varieties which having high yield potential, to combine drought tolerance with high yield traits.
The impact of genotype by environment interaction (GxE) on the relative performance and stability of a genotype across environments is so important that it forms challenging difficulty to the breeder in developing superior cultivars broadly adapted as described by
Eberhart and Russell (1966). Highly significant differences for environments (E), genotypes (G), and genotype by environment (G×E) interaction were recorded for all the studied traits except harvest Index that was unaffected by G×E interaction. These results are in line with those of
Al-Otayk (2010),
Bose et al. (2014) and
Mohamed and Said (2014).
Singh and Narayanan (1993) reported that if G×E interaction is found to be significant, the stability analysis can be carried out. According to the
Eberhart and Russell (1966) model, a stable cultivar is that one with a high mean yield and regression coefficient does not significantly differ than unity (b
i=1), and the deviation from regressions is does not significantly differ than zero (S
2d
i=0). The genotypes with b
i=1 are considered the most appropriate for farmers, since they respond satisfactorily to environmental conditions, while genotypes with b
i>1 are specially adapted to normal environment and genotypes with b
i<1 are specially adapted to unfavorable environment (
Okuyama et al. 2005). The present results (
Table 5) reported that wheat cultivar ‘Sids-1’ was more stable over all the studied environments (b
i=1 and S
2d
i = 0), with high r
2 and surpassed the other varieties in grain yield under drought stress conditions by 3.66 ton/hectare, so it could be selected to be grown under drought stress conditions (in the Egyptian dry lands) (
Table 5). On the other hand, the cultivars ‘Shakha-92 and Bacanora-88’ showed below-average stability (b
i = 1.35 & 1.42) indicating that these genotypes perform well under normal environment conditions. The grain yields of these cultivars were reduced markedly under stress conditions.
The percent of polymorphism (%P) using ISSR markers in the previous studies was varied. In this regard,
Nagaoka and Ogihara (1997) obtained similar %P (53.60%), while
Carvalho et al. (2009) documented a very high %P of 98.50%. Also,
Emel (2010) reported a %P of 76.07% among 11 triticale cultivars. In contrast,
Tok et al. (2011) showed that the highest percent of polymorphic loci was very low (17.59%) among wheat genotypes. The polymorphism information content (PIC) index has been used extensively in many genetic diversity studies (
Tatikonda et al. 2009;
Thudi et al. 2010). Moreover, the PIC value of markers indicates the usefulness of DNA markers for gene mapping, molecular breeding and germplasm evaluation (
Peng and Lapitan, 2005). PIC values obtained by
Saleh (2012) and
Marsafari et al. (2014), ranging from 0.22 to 0.31 using ISSR in date palm, and from 0.05 to 0.27 using AFLP markers in wheat respectively. The moderate values of PIC for the ISSR primers could be attributed to the diverse nature of the wheat accessions and/or highly informative ISSR markers (
Najaphy et al. 2011). Markers index values were in agreement with those obtained by
Khaled and Hamam (2015), and smaller than those, from 0.41 to 3.36, reported by
Najaphy et al. 2011.
Studies using single marker analysis by Roy
et al. (2006) showed, the associated markers each explained a maximum of 8.12 and 29.38% for tiller numbers and florets per spike traits in bread wheat genotypes. Our results were supported by the findings of
Khaled and Hamam (2015) demonstrating that five ISSRs were regarded as candidate markers linked to some agronomic traits in wheat bread genotypes.
Mohammadi et al. (2010) reported that seed number/spike trait was positively related to a 600bp RAPD (RAPD, for Random Amplified Polymorphism DNA) band under drought conditions. Recently,
Khaled et al. (2015) indicated that there was highly significant regression (34.95,
p= 0.006) on grain yield trait in bread wheat under normal conditions. Likely,
El-Rawy and Youssef (2014) used sequence-related amplified polymorphism (SRAP) markers to evaluate bread wheat genotypes under drought stress. They reported that SRAP molecular markers were able to generate some unique and specific bands for certain genotypes related to drought tolerance. Determining the genetic basis of tolerance involves correlating the incidence of molecular markers with phenotypic scores to predict DNA genomic regions that harbor a factor influencing the plant’s response (
Roy et al. 2011). Molecular markers that respond most consistently and to the greatest extent in the target environment are the prime candidates for marker-assisted selection (MAS). Therefore, ISSR markers identified during the present study need to be subjected to validation and/or functional analysis of respective traits. In addition, we believe that at least one of the markers identified would be validated and used for marker-assisted selection.
CONCLUSION
Genetic stability and diversity are two of the key factors for the improvement of many crop plants. A major challenge for plant breeders is the selection of high yielding genotype with wide adaptation to a wide range of environments. The varieties named ‘Shakha-93, Sahel-1, Giza-160, Giza-168, Sids-1, Sids-4 and Nilen’ were relatively drought resistant. Therefore, these varieties can be used as a donor plants in wheat breeding program by crossing them with local varieties that have high yield potential to combine drought tolerance with high yield traits. The stability analysis revealed that the cultivar ‘Sids-1’ showed high and stable yields, so we recommend to be grown under drought stress condition as a stable high yielding variety suitable for planting at the Egyptian dry lands. We believe that at least one of the ISSR molecular markers identified in this study will be validated and can be used for marker-assisted selection (MAS-Selection) in many wheat breeding program.
Fig. 1Amplification profile of 20 breadwheat varieties with primers (A) UBC-811 and (B) UBC-840; arrows indicate ISSR markers associated with plant height, 1000-kernel weight and No. of spike traits. M, ladder=100bp.
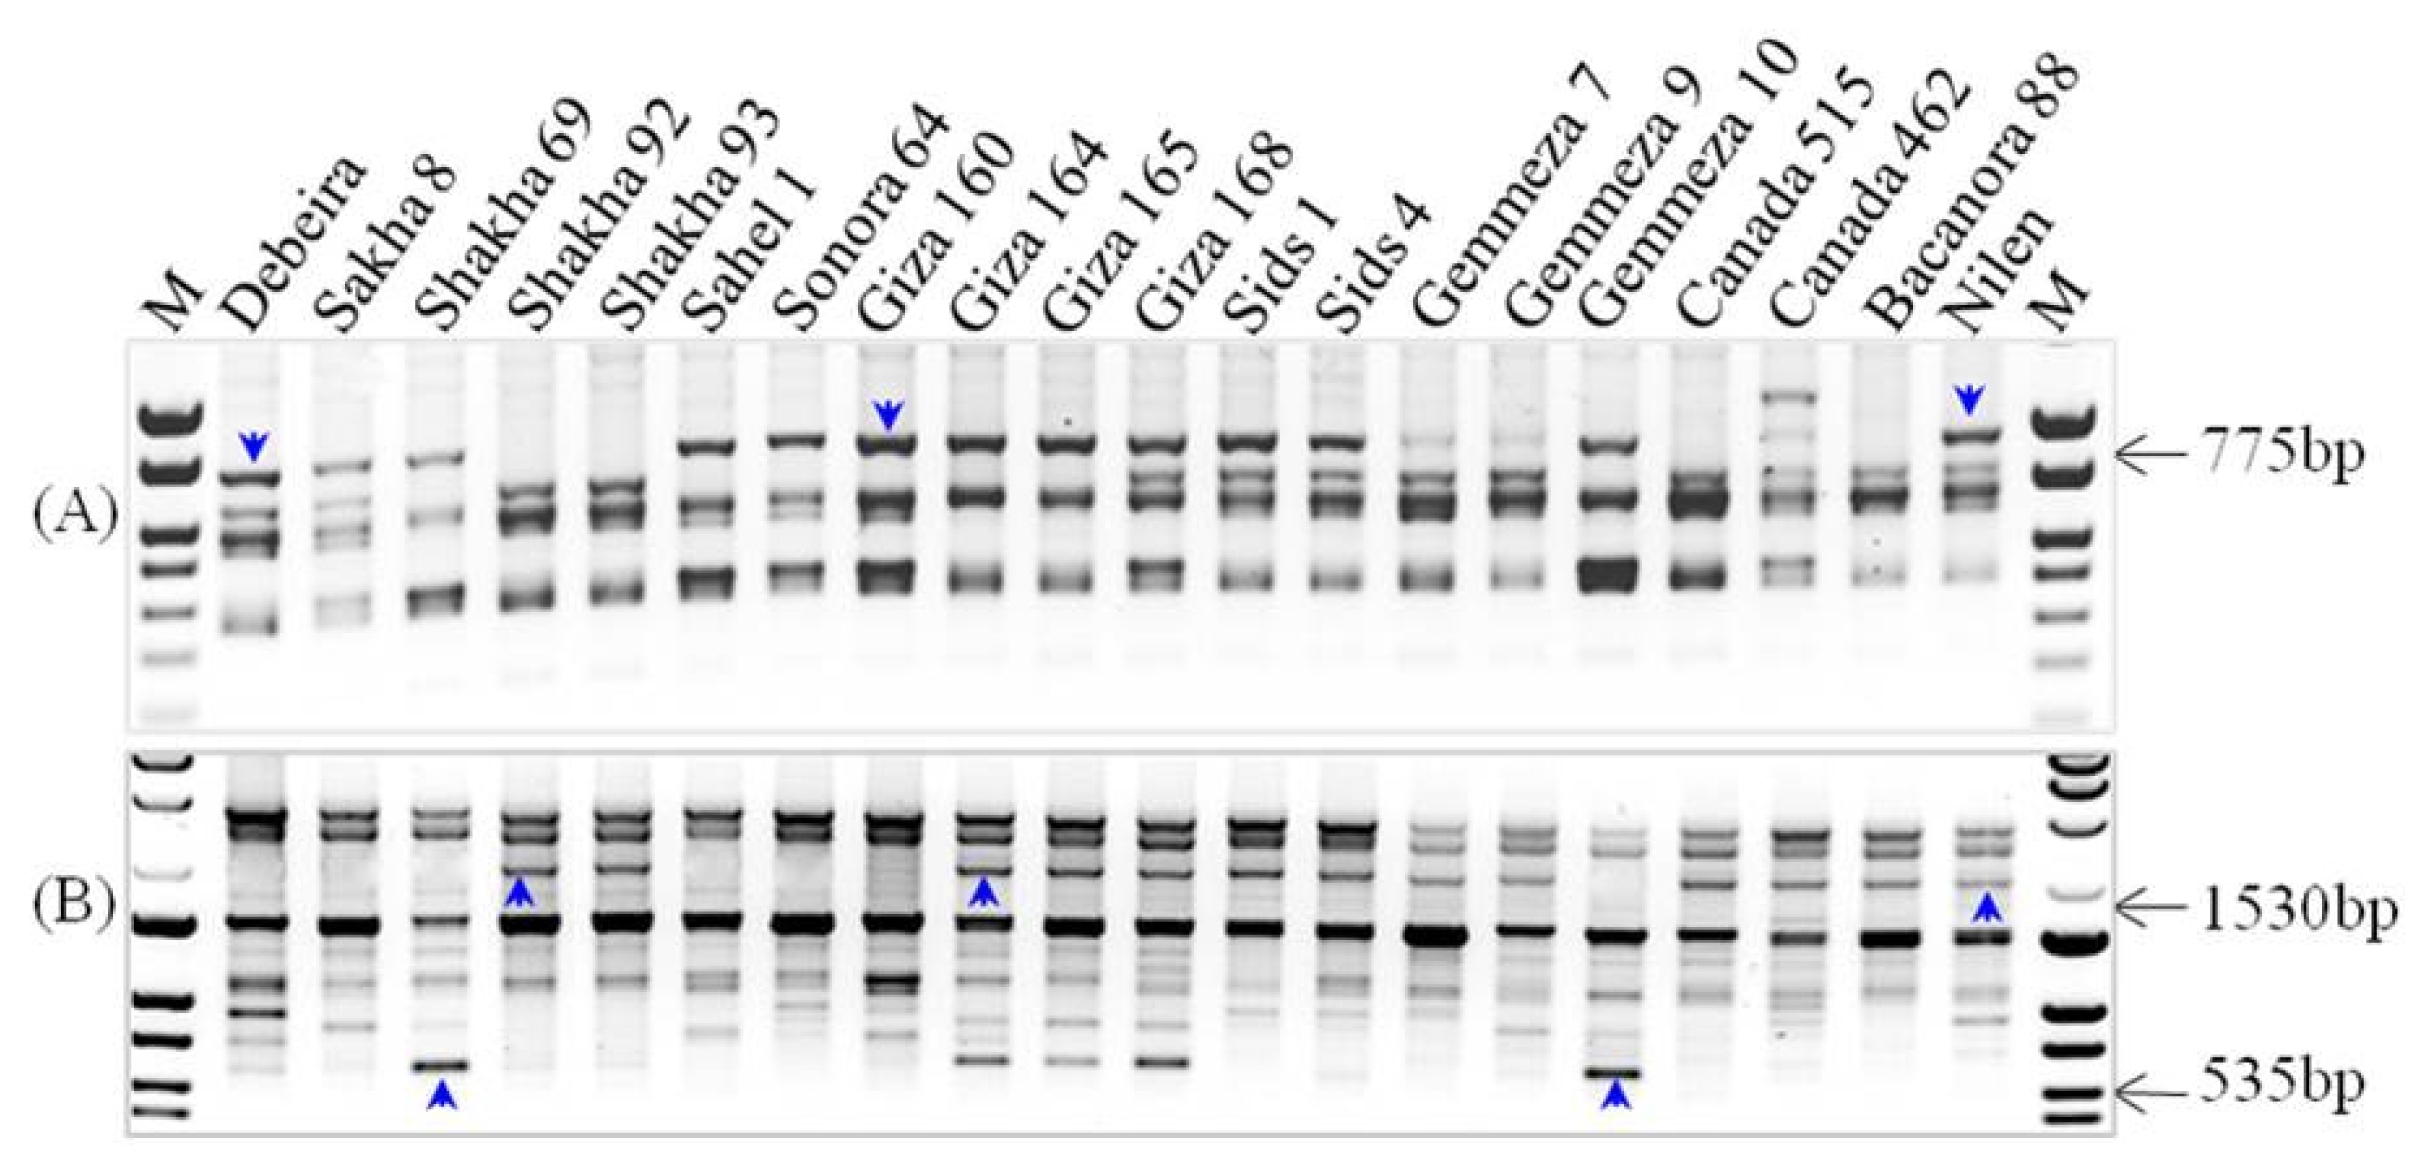
Table 1Pedigree and the origin of 20 bread wheat cultivars.
Table 1
|
Cultivar |
Pedigree |
Origin |
|
Debeira |
-- |
Sudan |
|
Sakha-8 |
CNO67/SN64//KLRE/3/8156PK-3418-65-05-05 |
Egypt |
|
Shakha-69 |
Inia/RL4220//7C/Yr“S”CM15430-25-65-05-05 |
Egypt |
|
Shakha-92 |
Napo63/Inia66/Wern“s”S.1551-15-15-15-05 |
Egypt |
|
Shakha-93 |
Sakha92/TR810328 s 8871-15-25-15-05 |
Egypt |
|
Sahel-1 |
N.S.732/Plm/veery“S” D735-4Sd-1Sd-OSd |
Egypt |
|
Sonora-64 |
YT 54/N10B//2*Y54=somoeng2 |
Mexico |
|
Giza-160 |
Chenab/Giza 155 |
Egypt |
|
Giza-164 |
KVZ/Buha“S”//k a1/Bb |
Egypt |
|
Giza-165 |
DMC no/Mfd//Mon“S”CM43339-C-1Y-1M-24- IM-24-OB |
Egypt |
|
Giza-168 |
MIL/Buc//Seri CM93046-8M-O4-OM-2Y-OB |
Egypt |
|
Sids-1 |
HD2172/Pavon“S”//1158/Maya74“S” |
Egypt |
|
Sids-4 |
Maya“S”/Mon “S”/CMH74.A592/3/Giza157-2 |
Egypt |
|
Gemmeza-7 |
CMH74A.630/5x//Seri82/3/Agent CGM4611-2GM-3GM-1GM-OGM |
Egypt |
|
Gemmeza-9 |
Aid“S”/Hauc “S”//CMH74A.630/5x CGH483-5GM-1GM-OGM |
Egypt |
|
Gemmeza-10 |
-- |
Egypt |
|
Canada-515 |
-- |
Canada |
|
Canada-462 |
-- |
Canada |
|
Bacanora-88 |
CM67458-4Y-1M-3Y-1M-5Y-O8-O |
Egypt |
|
Nilen |
-- |
Sudan |
Table 2Analysis of variance “p” values for selected sources of variation for characters measured on 20 bread wheat genotypes with two irrigation treatments for 2-years.
Table 2
|
SV |
Plant height |
Number of spikes |
Spike length |
1000-kernel weight |
Grain yield |
Harvest index |
|
Year (Y) |
0.00 |
0.00 |
0.00 |
0.00 |
0.00 |
0.27 |
|
Irrigations (I) |
0.00 |
0.00 |
0.00 |
0.00 |
0.00 |
0.00 |
|
Y × I |
0.00 |
0.28 |
0.45 |
0.64 |
0.00 |
0.42 |
|
Varieties (V) |
0.00 |
0.00 |
0.00 |
0.00 |
0.00 |
0.00 |
|
Y × V |
1.00 |
0.42 |
1.00 |
1.00 |
1.00 |
0.70 |
|
I × V |
0.00 |
0.00 |
0.00 |
0.00 |
0.00 |
0.00 |
|
Y × I × V |
1.00 |
0.76 |
1.00 |
1.00 |
1.00 |
0.83 |
|
CV% |
5.13 |
6.62 |
5.22 |
7.16 |
10.65 |
13.64 |
Table 3Mean performance of 20 wheat varieties under normal (N) and drought stress (D) for studied characters over two years.
Table 3
|
Characters |
Plant height (cm) |
Number of spikes/m2
|
Spike length (cm) |
1000-kernel weight (g) |
Grain yield (ton/hec.) |
Harvest index (%) |
|
|
Treatment |
N |
D |
N |
D |
N |
D |
N |
D |
N |
D |
N |
D |
|
Debeira |
93.45 |
83.18 |
353.00 |
285.88 |
11.18 |
10.48 |
37.03 |
25.91 |
4.42 |
2.86 |
26.83 |
23.47 |
|
Sakha 8 |
99.40 |
87.68 |
319.00 |
258.25 |
11.48 |
10.79 |
39.45 |
30.31 |
4.51 |
2.90 |
29.08 |
18.94 |
|
Sakha 69 |
98.70 |
89.53 |
344.38 |
275.00 |
12.04 |
11.06 |
39.26 |
27.49 |
4.80 |
3.04 |
27.96 |
17.94 |
|
Sakha 92 |
91.05 |
81.23 |
374.38 |
300.75 |
11.56 |
10.98 |
35.88 |
27.46 |
4.69 |
2.88 |
32.42 |
24.23 |
|
Sakha 93 |
86.95 |
72.23 |
288.38 |
234.25 |
11.51 |
11.06 |
39.56 |
31.73 |
4.84 |
3.25 |
28.89 |
28.02 |
|
Sahel 1 |
103.20 |
93.58 |
333.50 |
279.38 |
11.66 |
11.26 |
39.61 |
30.23 |
5.03 |
3.45 |
29.47 |
24.78 |
|
Sonora 64 |
100.45 |
91.83 |
298.00 |
248.88 |
11.31 |
10.90 |
39.70 |
28.15 |
4.72 |
2.86 |
30.30 |
20.70 |
|
Giza 160 |
101.70 |
90.23 |
348.50 |
294.88 |
11.56 |
11.03 |
41.46 |
31.89 |
5.15 |
3.36 |
34.17 |
26.46 |
|
Giza 164 |
100.10 |
92.63 |
360.25 |
295.13 |
12.34 |
11.30 |
40.93 |
33.00 |
5.03 |
3.30 |
33.88 |
24.51 |
|
Giza 165 |
98.95 |
89.08 |
353.63 |
284.88 |
11.65 |
11.18 |
39.81 |
29.71 |
4.64 |
2.99 |
27.65 |
22.49 |
|
Giza 168 |
105.00 |
95.53 |
321.00 |
242.00 |
11.91 |
11.38 |
42.55 |
31.31 |
5.06 |
3.58 |
31.18 |
25.30 |
|
Sids 1 |
102.40 |
92.63 |
369.25 |
307.50 |
12.43 |
11.33 |
40.64 |
33.08 |
5.26 |
3.66 |
31.41 |
25.76 |
|
Sids 4 |
96.10 |
87.98 |
221.00 |
202.63 |
14.74 |
12.16 |
44.39 |
34.98 |
4.33 |
3.25 |
35.17 |
24.48 |
|
Gemmeza 7 |
99.35 |
87.98 |
351.50 |
245.75 |
12.31 |
11.21 |
41.71 |
29.80 |
4.42 |
2.94 |
26.61 |
21.73 |
|
Gemmeza 9 |
101.25 |
87.38 |
322.25 |
232.75 |
11.43 |
10.48 |
41.03 |
31.21 |
4.01 |
2.64 |
27.09 |
18.50 |
|
Gemmeza 10 |
95.75 |
85.98 |
327.25 |
291.00 |
11.54 |
10.90 |
39.80 |
31.29 |
4.10 |
3.19 |
31.08 |
22.22 |
|
Canada 515 |
105.40 |
88.63 |
371.88 |
263.00 |
11.95 |
11.45 |
38.53 |
31.08 |
4.29 |
3.01 |
31.80 |
18.79 |
|
Canada 462 |
103.50 |
90.28 |
336.00 |
249.50 |
12.21 |
11.20 |
42.16 |
31.61 |
4.94 |
2.96 |
29.17 |
20.03 |
|
Bacanora 88 |
94.25 |
85.23 |
265.88 |
217.00 |
11.29 |
10.41 |
38.88 |
29.84 |
4.38 |
2.58 |
30.36 |
16.25 |
|
Nilen |
105.65 |
94.48 |
341.75 |
296.50 |
11.66 |
10.93 |
43.46 |
34.18 |
5.30 |
3.59 |
35.18 |
25.40 |
|
mean
|
99.13 |
88.36 |
330.04 |
265.24 |
11.89 |
11.07 |
40.29 |
30.71 |
4.70 |
3.11 |
30.49 |
22.50 |
|
RLSD
|
|
0.05 |
1.29 |
9.58 |
0.17 |
1.56 |
0.25 |
3.14 |
|
0.01 |
1.67 |
12.38 |
0.23 |
2.01 |
0.32 |
4.07 |
Table 4Mean sum of squares of combined analysis of variance for studied traits.
Table 4
|
SV |
|
Mean squares |
|
|
|
df |
Plant height |
Number of spikes/m2
|
Spike length |
1000-kernel weight |
Grain yield |
Harvest index |
|
Environment (E) |
3 |
748.45**
|
28476.50**
|
5.06**
|
6.21**
|
2.97**
|
426.11**
|
|
Rep/E |
12 |
6.37 |
48.66 |
0.12 |
0.03 |
0.27 |
11.66 |
|
Genotype (G) |
19 |
99.34**
|
4228.88**
|
1.25**
|
0.17**
|
0.73**
|
25.31**
|
|
E × G |
57 |
104.26**
|
171.37**
|
0.77**
|
0.72**
|
0.40**
|
4.31 |
|
Error |
228 |
1.11 |
60.57 |
0.02 |
0.03 |
0.04 |
6.52 |
Table 5Mean, stability parameters, relative yield reduction(RYR) and drought susceptibility index (DSI)for grain yield (ton/hec.) of the 20 bread wheat varieties over four environments.
Table 5
|
Varieties |
χ̄ Normal |
χ̄ Drought |
RYR% |
DSI |
Mean of all |
bi |
±S.E. |
S2di |
r2 % |
|
Debeira |
4.42 |
2.86 |
35.23 |
1.02 |
3.64 |
0.99 |
±0.01 |
0.00 |
42 |
|
Sakha-8 |
4.51 |
2.90 |
35.70 |
1.03 |
3.70 |
1.03 |
±0.01 |
0.00 |
88 |
|
Shakha-69 |
4.80 |
3.04 |
36.51 |
1.04 |
3.92 |
1.12*
|
±0.01 |
0.00 |
99 |
|
Shakha-92 |
4.69 |
2.88 |
38.61 |
1.11 |
3.78 |
1.35*
|
±0.02 |
0.00 |
98 |
|
Shakha-93 |
4.84 |
3.25 |
32.88 |
0.93 |
4.04 |
1.02 |
±0.01 |
0.04 |
93 |
|
Sahel-1 |
5.03 |
3.45 |
31.37 |
0.88 |
4.24 |
1.01 |
±0.01 |
0.00 |
90 |
|
Sonora-64 |
4.72 |
2.86 |
39.43 |
1.14 |
3.79 |
1.17*
|
±0.02 |
0.01 |
97 |
|
Giza-160 |
5.15 |
3.36 |
34.81 |
0.97 |
4.25 |
1.15*
|
±0.01 |
0.08 |
99 |
|
Giza-164 |
5.03 |
3.30 |
34.55 |
1.00 |
4.17 |
1.09*
|
±0.01 |
0.02 |
95 |
|
Giza-165 |
4.64 |
2.99 |
35.73 |
1.03 |
3.82 |
1.05 |
±0.00 |
0.00 |
99 |
|
Giza-168 |
5.06 |
3.58 |
29.40 |
0.82 |
4.32 |
0.95 |
±0.02 |
0.00 |
93 |
|
Sids-1 |
5.26 |
3.66 |
30.46 |
0.86 |
4.46 |
1.00 |
±0.00 |
0.00 |
99 |
|
Sids-4 |
4.33 |
3.25 |
25.02 |
0.70 |
3.79 |
0.71*
|
±0.03 |
0.01 |
98 |
|
Gemmeza-7 |
4.42 |
2.94 |
33.46 |
0.98 |
3.68 |
0.94*
|
±0.00 |
0.00 |
100 |
|
Gemmeza-9 |
4.01 |
2.64 |
34.11 |
1.04 |
3.33 |
0.86*
|
±0.00 |
0.00 |
100 |
|
Gemmeza-10 |
4.10 |
3.19 |
22.27 |
0.67 |
3.65 |
0.57*
|
±0.03 |
0.01 |
99 |
|
Canada-515 |
4.29 |
3.01 |
29.78 |
0.90 |
3.65 |
0.79*
|
±0.01 |
0.01 |
100 |
|
Canada-462 |
4.94 |
2.96 |
40.11 |
1.15 |
3.95 |
1.02 |
±0.02 |
0.00 |
99 |
|
Bacanora-88 |
4.38 |
2.58 |
41.15 |
1.24 |
3.48 |
1.40*
|
±0.04 |
0.04 |
77 |
|
Nilen |
5.30 |
3.59 |
32.32 |
0.91 |
4.44 |
1.07 |
±0.01 |
0.00 |
96 |
|
Grand mean |
4.70 |
3.11 |
33.70 |
|
3.90 |
|
|
|
|
Table 6ISSR primers used to detect polymorphism, primer sequences, AB, PB, %P, PIC, and MI for 20 breadwheat varieties.
Table 6
|
Primer |
Primer Sequence |
AB |
PB |
%P |
PIC |
MI |
|
UBC-811 |
(GA)8AC |
7 |
5 |
71.43 |
0.25 |
1.25 |
|
UBC-812 |
(GA)2GG(AG)4AA |
5 |
2 |
40.00 |
0.18 |
0.36 |
|
UBC-815 |
(TC)8A |
3 |
1 |
33.33 |
0.09 |
0.09 |
|
UBC-833 |
(GA)8TT |
4 |
2 |
50.00 |
0.13 |
0.26 |
|
UBC-834 |
(AG)8YT |
5 |
4 |
80.00 |
0.28 |
1.12 |
|
UBC-840 |
(CT)8TT |
6 |
2 |
33.33 |
0.13 |
0.26 |
|
UBC-849 |
(GT)8YA |
6 |
3 |
50.00 |
0.12 |
0.36 |
|
UBC-880 |
(TC)8AA |
4 |
1 |
25.00 |
0.08 |
0.08 |
|
(GGGTG)3
|
8 |
5 |
62.50 |
0.22 |
1.10 |
|
Total
|
|
48 |
25 |
|
|
|
|
Means |
|
5.33 |
2.78 |
52.08 |
0.16 |
0.54 |
Table 7Details of simple linear regression (R2) analysis using 48 amplified bands involving 6 different agronomic traits.
Table 7
|
Marker |
Trait |
Conditions |
R2
|
P-value
|
|
UBC-811775bp
|
Plant height |
N |
23.83 |
0.03 |
|
D |
40.38 |
0.00 |
|
UBC-811775bp
|
1000-kernel weight |
N |
27.54 |
0.02 |
|
D |
02.33 |
0.52 |
|
UBC-8401530bp
|
N |
9.14 |
0.20 |
|
D |
20.95 |
0.04 |
|
UBC-840535bp
|
No. of spikes/m2
|
N |
10.61 |
0.16 |
|
D |
24.95 |
0.03 |
References
- Ahmad R, Qadir S, Ahmad N, Shah KH. 2003. Yield potential and stability of nine wheat varieties under water stress conditions. Int J Agri Biol. 5: 7-9.
- Al-Otayk SM. 2010. Performance of yield and stability of wheat genotypes under high stress environments of the central region of Saudi Arabia. Env Arid Land Agric Sci. 21: 81-92.
- Aggarwal PK. 1991. Simulating growth, development, and yield in warmer areas. Saunders DA, editor. Wheat for the non traditional warmer areas. CIMMYT. Mexico, df: pp. 429-446.
- Ashraf M. 2010. Inducing drought tolerance in plants: Recent advances. Biotechnol Adv. 28: 169-183.
- Blum A. 1989. Breeding methods for drought resistance. pp. 197-216. Jones HG, Flowers TJ, Jones MB, editors. Plant under stress. Cambridge Univ. Press. UK:
- Bose LK, Jambhulkar NN, Pande K, Singh ON. 2014. Use of AMMI and other stability statistics in the simultaneous selection of rice genotypes for yield and stability under direct-seeded conditions. Chilean J of Agric Res. 74: 3-9.
- Bruckner PL, Frohberg RC. 1987. Stress tolerance and adaptation in spring wheat. Crop Sci. 27: 31-6.
- Carvalho A, Lima-Brito J, Maçãs B, Guedes-Pinto H. 2009. Genetic diversity and variation among botanical varieties of old Portuguese wheat cultivars revealed by ISSR assays. Biochem Genet. 47: 276-294.
- Clarke JM, Townley-Smith TF, McCaig TN, Green DG. 1984. Growth analysis of spring wheat cultivars of varying drought resistance. Crop Sci. 24: 537-541.
- Clarke JM, Depaw RM, Tounley-Smith TF. 1992. Evaluation of methods for quantification of drought tolerance in wheat. Crop Sci. 32: 723-7.
- Crossa J, Westcott B, Gonzalez C. 1988. The yield stability of maize genotypes across international environments: full season tropical maize. Exp Agric. 24: 253-263.
- Eberhart SA, Russell WA. 1966. Stability parameters for comparing varieties. Crop Sci. 6: 36-40.
- El-Rawy MA, Youssef M. 2014. Evaluation of drought and heat tolerance in wheat based on seedling traits and molecular analysis. J Crop Sci Biotechnol. 17: 183-189.
- Emel S. 2010. Evaluation of ISSR markers to assess genetic variability and relationship among winter triticale (X Triticosecale Wittmack) cultivars. Pak J Bot. 42: 2755-2763.
- Fisher RA, Maurer R. 1978. Drought resistance in spring wheat cultivars. I. Grain yield responses. Aust J Agric Res. 29: 897-912.
- Francis TR, Kannenberg LW. 1978. Yield stability studies in short-season maize. 1. A descriptive method for grouping genotypes. Can J Plant Sci. 58: 1029-1034.
- Ghislain M, Zhang D, Fajardo D, Hanuman Z, Hijmans R. 1999. Marker-assisted sampling of the cultivated Andean potato Solanumphureja collection using RAPD markers. Genet Res Crop Evol. 46: 547-555.
- Gomez KA, Gomez AA. 1984. Statistical Procedures for Agricultural Research. John Wiley and Sons. New York: pp. 680.
- Karaca M, Izbriak A. 2008. Comparative analysis of genetic diversity in Turkish durum wheat cultivars using RAPD and ISSR markers. J Food Agric Environ. 6: 219-225.
- Kassab OM, El-Zeiny HA. 2005. Effect of water stress and paclobutrazol application on growth and yield of wheat plants. J Agric Sci Mansoura Univ. 30: 1881-1888.
- Khaled AGA, Hamam KA. 2015. Association of molecular markers with phenotypic traits of bread wheat genotypes. Egypt J Genet Cytol. 44: 115-130.
- Khaled AGA, Motawea MH, Said AA. 2015. Identification of ISSR and RAPD markers linked to yield traits in bread wheat under normal and drought conditions. J Genet Engineering and Biotechnol. In press. http://dx.doi.org/10.1016/j.jgeb.2015.05.001
- Joshi AK, Mishra B, Chatrath R, Ortiz Ferrara R, Singh RP. 2007. Wheat improvement in India: Present status, emerging challenges, and future prospects. Euphytica. 157: 431-446.
- Marsafari M, Mehrabi AM, Tahmasebi Z. 2014. The identification of RAPD and ISSR informative markers with some quality traits of fruit some of Iranian date Palme. Int J Pl An and Env Sci. 4: 714-722.
- Menshawy AMM. 2007. Evaluation of some early bread wheat genotypes under different sowing dates: 1 Earliness characters. Egypt J Plant Breed. 11: 25-40.
- Mohamed NEM, Said AA. 2014. Stability parameters for comparing bread wheat genotypes under combined heat and drought stress. Egypt J Agron. 36: 123-146.
- Mohammadi A, Majidi-Heravan E, Bihamta MZ, Heidari-Sharifabad H, Hami H. 2010. Variation analysis of wheat F3 lines produced by crossing between Azar2 and 87-Zhong291 cultivars using RAPD method in drought stress condition. Iran J Genet Plant Breed. 1: 59-64.
- MSTATC1990. A microcomputer program for the design, management, and analysis of agronomic research experiments. Michigan State Univ USA.
- Nagaoka T, Ogihara Y. 1997. Applicability of inter-simple sequence repeat polymorphisms in what for use as DNA markers in comparison to RFLP and RAPD markers. Theor Appl Genet. 94: 597-602.
- Najaphy A, Parchina RA, Farshadfara E. 2011. Evaluation of genetic diversity in wheat cultivars and breeding lines using inter simple sequence repeat markers. Biotechnol Biotec Eq. 25: 2634-2638.
- Okuyama LA, Federizzi LC, Neto JFB. 2005. Grain yield stability of wheat genotypes under irrigated and non-irrigated conditions. Brazil Arch Biol Technol. 48: 697-704.
- Peng JH, Lapitan NLV. 2005. Characterization of EST-derived microsatellites in the wheat genome development of eSSR markers. Funct Inter Genom. 5: 80-96.
- Pinthus MJ. 1973. Estimate of genotypic value a proposed method. Euphytica. 2: 121-123.
- Poresbski SL, Bailey G, Baum RB. 1997. Modification of CTAB DNA extraction protocol for plants containing high polysaccharide and polyphenol components. Plant Mol Biol Reporter. 12: 8-15.
- Powell W, Morgante M, Andre C, Hanafey M, Vogel J, Tingey S, Rafalsky A. 1996. The comparison of RFLP, RAPD, AFLP and SSR (microsatellite) markers for germplasm analysis. Mol Breed. 2: 225-238.
- Roy SJ, Tucker EJ, Tester M. 2011. Genetic analysis of abiotic stress tolerance in crops. Curr Opin Plant Biol. 14: 232-239.
- Saleh B. 2012. Biochemical and Genetic Variation of some Syrian Wheat Varieties using NIR, RAPD and AFLPs Techniques. J Plant Biol Res. 1: 1-11.
- Singh P, Narayanan SS. 1993. Biometrical techniques in plant breeding. 1st Ed. Kalayani publishers. New Delhi.
- Sofalian O, Chaparzadeh N, Javanmard A, Hejazi MS. 2008. Study the genetic diversity of wheat landraces from northwest of Iran based on ISSR molecular markers. Int J Agric Biol. 10: 466-468.
- Tatikonda L, Wani PS, Kannan S, Beerelli N, Sreedevi TK, Hoisington DA, Devi P, Varshney RA. 2009. AFLP-based molecular characterization of an elite germplasm collection of Jatro phacurcas L.: A biofuel plant. Plant Sci. 176: 505-513.
- Thudi M, Manthena R, Wani SP, Tatikonda L, Hoisington DA, Varshney RA. 2010. Analysis of genetic diversity in Pongamia (Pongamia pinnata L. Pierre) using AFLP markers. J Plant Biochem Biotech. 19: 209-216.
- Tok D, Senturk-Akfirat F, Sevinc D, Aydin Y, Altinkut-Uncuoglua A. 2011. Identification of genetic polymorphism and DNA methylation pattern in wheat (Triticum aestivum L.). Turk J Field Crops. 16: 157-165.
- Tuberosa R, Salvi S. 2006. Genomics-based approaches to improve drought tolerance of crops. Trends Plant Sci. 11: 405-412.
- Williams JGJ, Kubelik AR, Livak KJ, Rafalski JA, Tingey SV. 1990. DNA polymorphisms amplified by arbitrary primers are useful as genetic markers. Nucl Acids Res. 18: 6531-6535.


