Abstract
In order to estimate genetic diversity of Korean rice landraces, rice characters and SSR markers of 76 rice germplasms were analyzed. Of 12 rice characters, amylose content (AC) showed as largest variance (4.9 to 28.9%), whereas grain length (GL) showed as the lowest variance (4.4 to 5.9 mm). In principal component analyses (PCA), the first principal component explained 60.3% of total variance, in which culm length (CL) and growth period (GP) showed as positive variance and AC showed as negative variance. The second principal component explained an additional 22.4% of the total variance, in which GP and AC showed highly positive variables and CL showed a negative variable. Forty nine SSR markers produced a total of 473 alleles with an average of 9.65 alleles. Polymorphism information content (PIC) was in the range of 0.11 to 0.93. Average observed heterozygosity ranged from 0.12 to 0.39, with an average value of 0.61. As a result of STRUCTURE analysis, 76 Korean rice landraces showed two subpopulations. In clustering analysis, rice characters and SSR markers were clustered into four groups and three groups, respectively. However, they were not significant different from each other. These results provided insight into the characteristics of Korean rice landraces, thus improving our knowledge on rice breeding.
-
Key words: Genetic diversity, Korean rice landraces, Rice characters, SSR
INTRODUCTION
Asian cultivated rice (
Oryza sativa L.) is an important cereal crop consumed exclusively by humans. It supplies staple food for nearly 50% of the global population (
Garris et al. 2005). In many developing countries, rice as the basis of food security is intimately associated with traditional culture and customs in local regions (
Lu and Snow 2005). Asian cultivated rice was domesticated from its wild ancestor about 11,500 years ago (
Normile 1997) with wide geographic ranges (
Chang 1976). Since the putative wild ancestor of cultivated rice
O. rufipogon is tremendously rich in genetic diversity (
Oka 1988), cultivated rice domesticated from different types of wild rice populations also contains tremendous genetic diversity. In addition, diverse demands by farmers from various regions resulted in greater genetic diversity in total rice gene pool (
Lu et al. 2002;
Zhu et al. 2004). Its abundant genetic diversity has not only made rice an essential food source, but also provided important genetic resource for rice breeding.
A clear understanding of genetic diversity is essential for effective conservation and utilization of rice genetic resources (
Tu et al. 2007). Genetic diversity is a source of variation. It provides raw material for crop improvement work. It is essential to decrease crop vulnerability to abiotic and biotic stresses, ensuring long-term selection gain in genetic improvement and promoting rational use of genetic resources (
Messmer et al. 1993). Diverse data sets including morphology, physiology, isozymes, storage protein profiles, and DNA markers have been used to assess genetic diversity (
Smith et al. 1987;
Bar-Hen et al. 1995;
Hamrich and Godt 1997;
Spicer and Gaston 1999). Of various methods for diversity analysis, morphology, physiology, and DNA marker especially simple sequence repeats (SSRs) have been widely used in different crop species (
Paterson et al. 1991). Differences and correlation among different methods of diversity study along with their clustering patterns have been reported (
Archak et al. 2003;
Beyene et al. 2005;
Cortese et al. 2010).
Landrace is a geographically or ecologically distinctive autochthonous population. It is conspicuously diverse in genetic composition both between landraces and within them. Thus, landrace represents a unique and critical source of genetically variable traits that can serve as a resource for future rice improvement (
Hossain et al. 2012). Landraces have been shown to be excellent sources of genes for novel alleles (
McCouch et al. 1997;
Hoisington et al. 1999;
Jackson 1999;
Guevarra et al. 2001). In this study, we analyzed 76 Korean rice landraces using rice characters and SSR fingerprints. The objectives of this study were: 1) to estimate the genetic diversity of Korean rice landraces based on rice characters and SSR markers; 2) to compare the classification of Korean rice landraces obtained by different methods.
MATERIALS AND METHODS
Plant materials and Data collection
A total of 76 Korean rice landraces (
Supplementary Table 1) were obtained from the National Agrobiodiversity Center of the Rural Development Administration (RDA), Republic of Korea (
http://genebank.rda.go.kr). Data were collected for several rice characters, including growth period (GP), culm length (CL), panicle length (PL), grain length (GL), grain width (GW), grain length to width ration (L/W), 1000-seed weight (SW), and grain thickness (GT). Amylose content (AC) and total protein content (TPC) were measured using the method of
Perez and Juliano (1978) and the method of Association of Official Agricultural Chemists (
AOAC 2005), respectively. Contents of K
+ and Mg
2+ were measured using an inductively coupled plasma optical emission spectrometry (ICP-OES) (Thermo Fisher Scientific, Waltham, USA).
Duncan’s multiple-range test was used to detect significant differences among the 76 Korean rice landraces using SPSS Statistics 20 (SPSS Inc., Chicago, IL, USA). Cluster analysis was performed using R statistical software (
http://www.r-project.org). Software PAST3 (
Hammer et al. 2001) was used for principal component analyses (PCA).
Total genomic DNA was extracted from young leaf tissue ground in liquid nitrogen using modified CTAB method (
Dellaporta et al. 1983). DNA concentration and quality were determined using NanoDrop ND-1000 spectrometer (NanoDrop Technologies, Wilmington, DE, USA). DNA stocks were diluted to 20 ng/μl as working solutions.
Markers were chosen according to their location on the rice genetic map and their suitability for high-throughput genotyping. A total of 49 SSR markers (
Table 3) distributed across all 12 chromosomes were used. Amplification was performed in 20-μL volume containing 100 ng template DNA, 1X PCR buffer, 0.2 mM of each dNTP, 1 U Taq DNA polymerase, 8 pmol of reverse and fluorescently labeled M13 (−21) primer, and 2 pmol forward primer with an M13 (−21) tail at its 5′-end. Published amplification conditions (
Schuelke 2000) were used: 94°C for 3 min; 30 cycles of 94°C for 30 s, 55°C (or other annealing temperature depending on the primer) for 45 s, and 72°C for 1 min; 10 cycles at 94°C for 30 s, 53°C for 45 s, and 72°C for 1 min; and a final extension at 72°C for 10 min. SSR alleles were resolved using a 3130xl Genetic Analyzer (Life Technologies Corp., Carlsbad, CA, USA) with GeneScan 3.7 software. Alleles were sized precisely against 6-carboxy-X-rhodamine molecular size standards using the Genotyper 3.7 software (Life Technologies Corp.).
As an indicator of genetic diversity, major allele frequency (MAF), number of alleles (NA), observed heterozygosity (Ho), expected heterozygosity (He), and polymorphism information content (PIC) were calculated using genetic analysis package PowerMarker V3.25 (
Liu and Muse 2005). Phylogenetic dendrogram was constructed with an unweighted pair-group method of arithmetic average (UPGMA) based on genetic distance matrix using the same software. Structure software (V2.3.4) (Pritchard
et al. 2007) was used to detect possible subpopulations (K=1 to K=10) with a model allowing for admixture and correlated allele frequencies using a burn-in period of 50,000 and MCMC repeats of 50,000 followed by three iterations. The optimal number of populations corresponds to the highest peak in the ΔK graph (
Evanno et al. 2005) and the landraces with membership probabilities ≥ 70% were assigned to each subpopulation.
RESLUTS
Rice characters diversity
The main descriptive statistics of 12 rice characters of 76 Korean rice landraces are summarized in
Table 1. Amylose content (AC) trait had the largest variance, with values ranging from 4.9% to 28.9%. However, GL trait had the lowest variance, with values ranging from 4.4 mm to 5.9 mm. Principal component analysis using the 12 rice characters indicated that two principal components (PCs) with Eigen values >1 (
Table 2) accounted for more than 82.7% variability. The first PC with Eigen value of 217.5 explained 60.3% of the total variance. Culm length (CL) was the variable with the largest positive loadings. Growth period (GP) had positive variances, where AC had negative variances. The second PC with Eigen value of 80.6 explained an additional 22.4% of the total variance. Growth period (GP) was the variable with the highest positive loading. Amylose content (AC) was a highly positive variable, whereas CL was a negative variable. The distribution of Korean rice landraces in the PCA analysis is shown in
Fig. 1. After placing an ellipse around the data that represented 95% confidence interval using Hotelling’s T2 statistic, it was possible to observe all Korean rice landraces except four (IT009077, IT007633, IT007578, and IT010275). IT007578 and IT010275 showed extreme growth period while IT009077 and IT007633 had the shortest culm length and panicle length, respectively.
The 49 SSR markers detected 473 alleles across 76 Korean rice landraces. The SSR loci diversity data are summarized in
Table 3. Allelic richness per locus varied among markers, ranging from two alleles (RM185 and RM452) to 25 (RM214) alleles. The average number of alleles was 9.65. The frequency of major alleles per locus ranged from 0.13 (RM214) to 0.94 (RM118), with an average value of 0.52 per marker. Of the 49 SSR markers, the overall PIC value ranged from 0.11 (RM185) to 0.93 (RM214), with an average value of 0.58. Ho value ranged from 0.00 to 0.09 (RM237), with an average of 0.01. He value ranged from 0.12 (RM118) to 0.39 (RM249), with an average of 0.61.
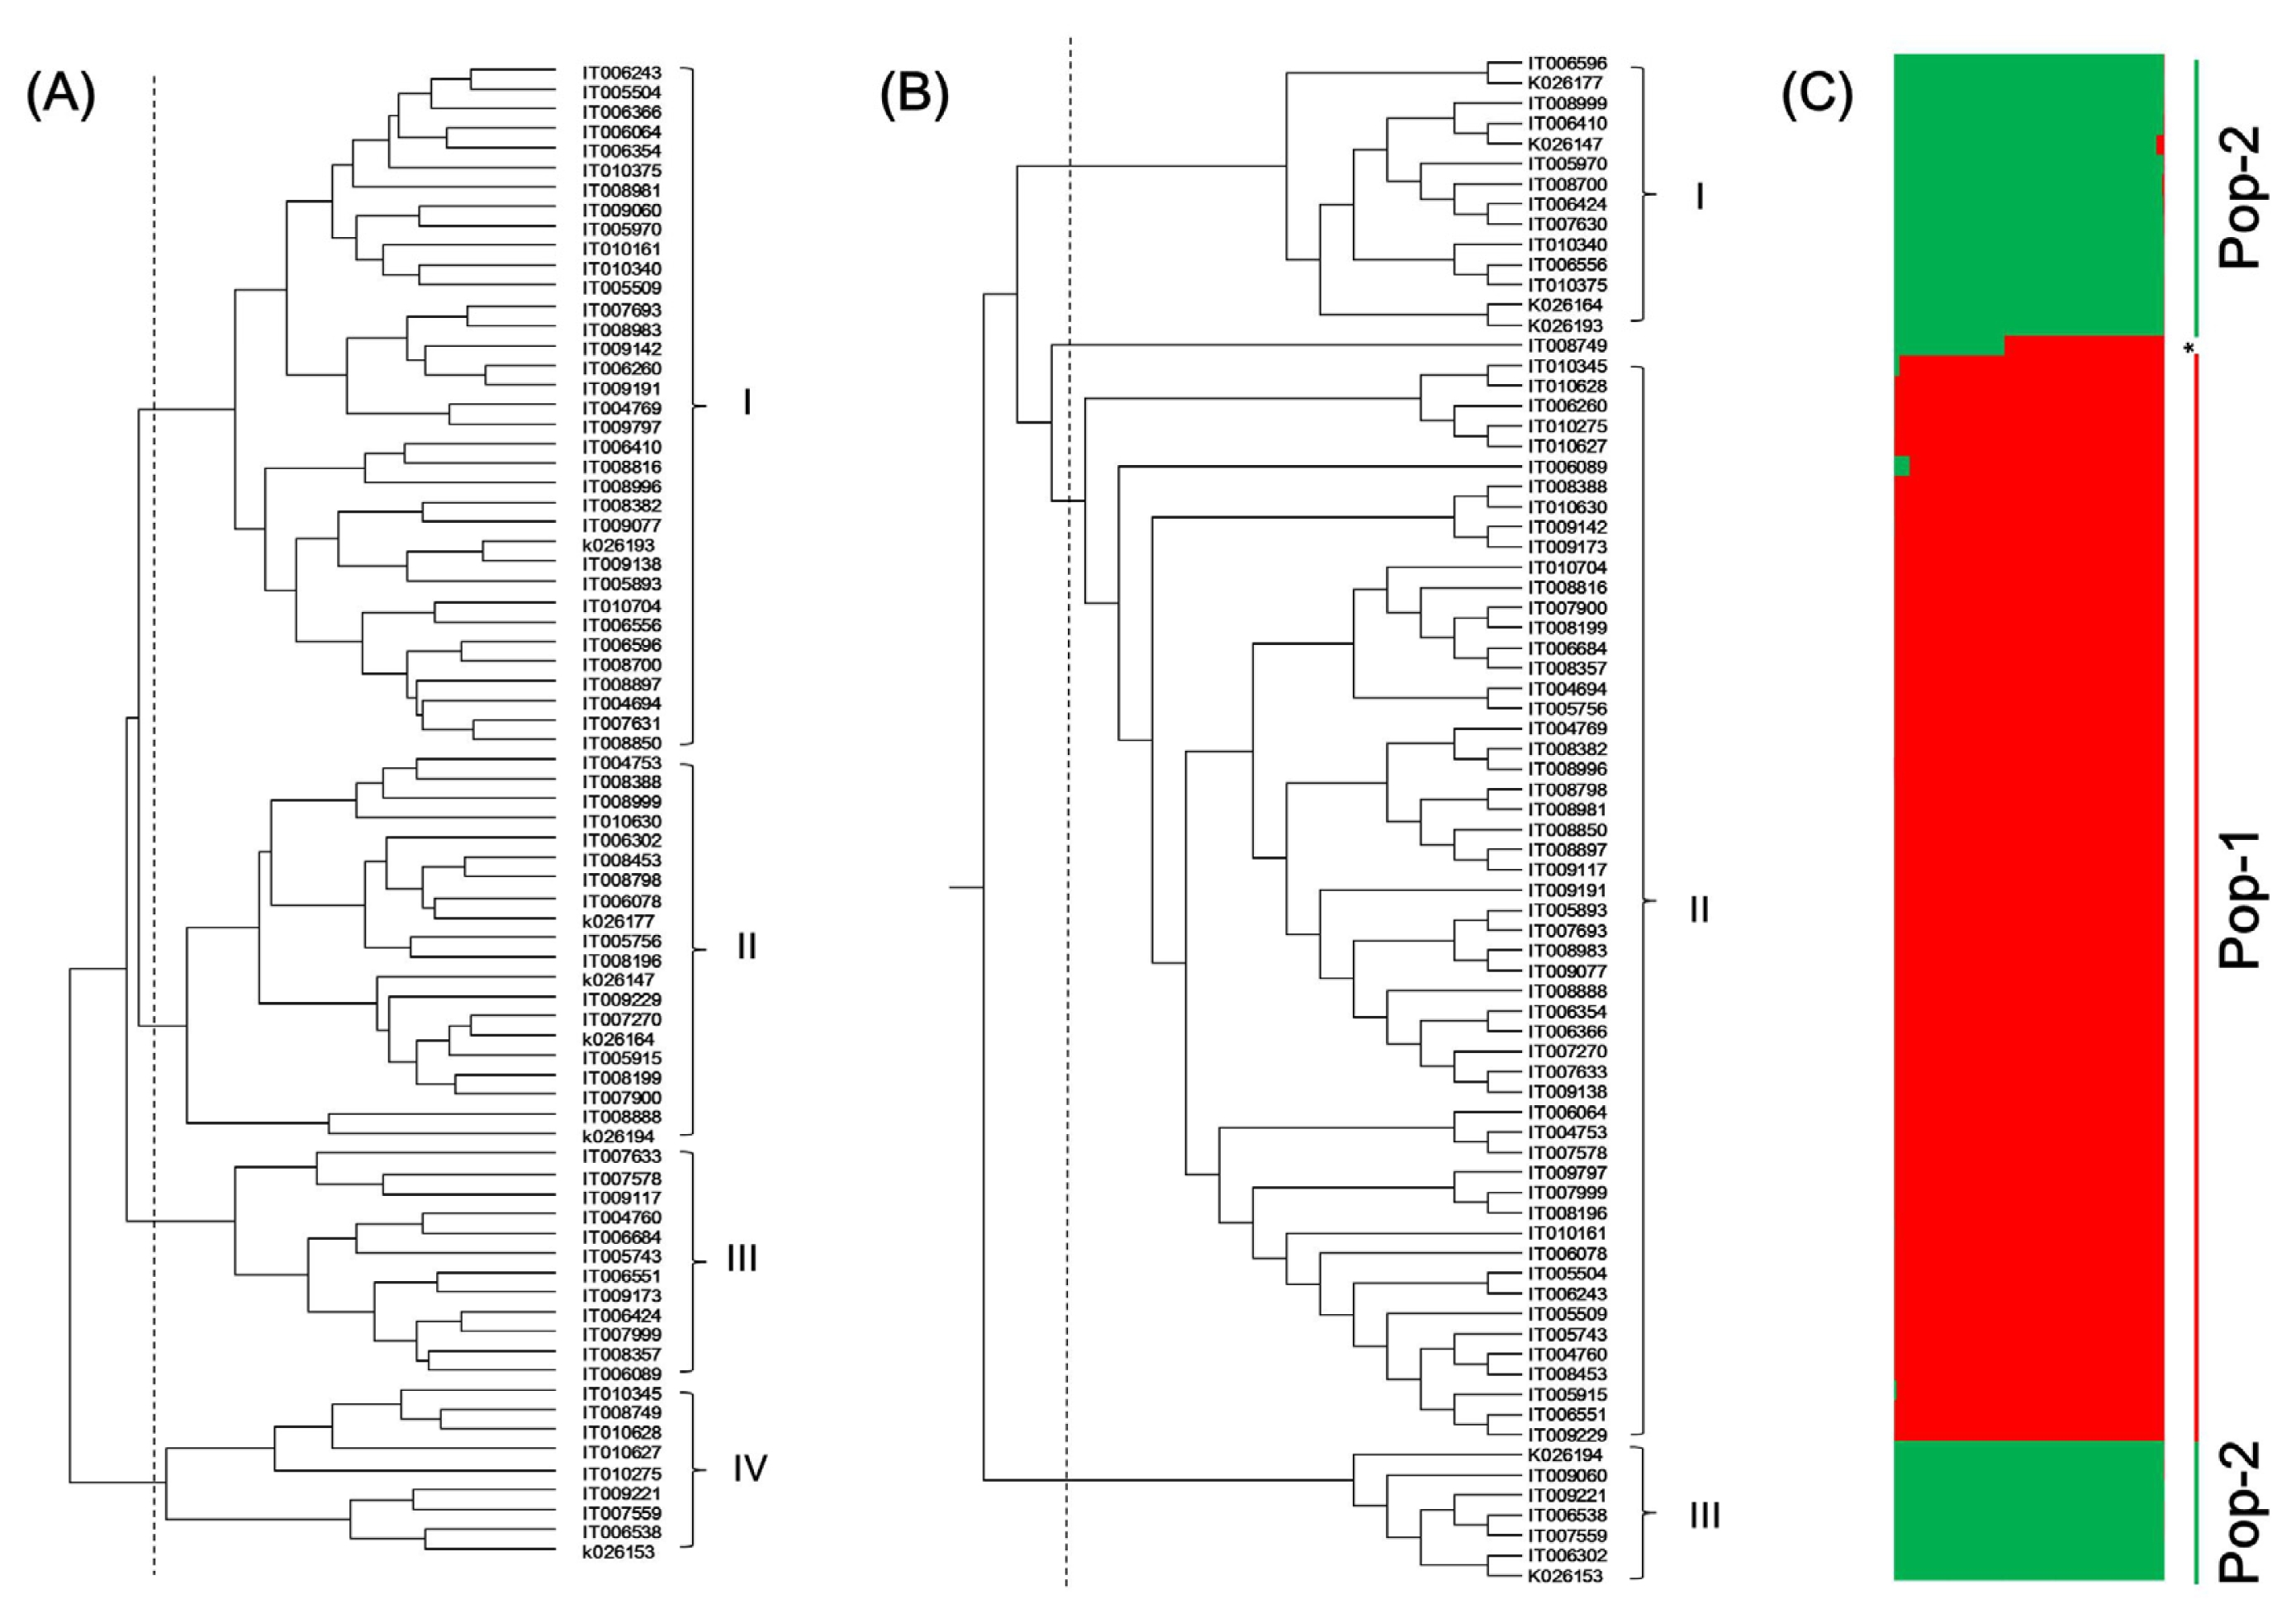
A total of 76 rice landraces were clustered into four groups based on rice characters (
Fig. 2A and
Table 4). Group I consisted of 35 landraces with the highest 1000-grain weight (26.3 ± 2.3 g) and amylose content (19.9 ± 2.2%) but the lowest Mg and K contents (0.20 ± 0.03 and 0.69 ± 0.05 mg/g, respectively). Group I was divided into two sub-groups according to culm length, panicle length, grain length, and amylose content. Group II consisted of 20 landraces with the longest culm length (110.3 ± 10.8 cm), the highest Mg and K contents (0.30 ± 0.03 and 0.95 ± 0.10 mg/g, respectively), the shortest grain length (4.8 ± 0.2 mm), and the lowest amylose content (7.6 ± 5.9%). Group III consisted of 12 landraces with the shortest panicle length (21.7 ± 2.3 cm) and the lowest 1000-grain weight (21.6 ± 1.6 g). Group IV consisted of 9 landraces with the longest grain length (5.4 ± 0.2 mm), the shortest grain width, thickness, and growth period (2.6 ± 0.2 mm, 1.9 ± 0.1 mm, and 102.9 ± 10.0 d, respectively), and the highest total protein (9.1 ± 0.7%) and grain length to width ratio (2.1 ± 0.3).
Based on SSR markers, the 76 Korean rice landraces were clustered into three groups (
Fig. 2B and
Table 5). Difference of characteristics between groups based on SSR was not significant compared to that based on rice characters. Group I and Group II consisted of 14 and 54 Korean rice landraces, respectively. They showed similar levels of 12 rice characters. Group III contained 7 Korean rice landraces. It had lower awn length, culm length, grain width, and grain thickness but higher grain length, grain length to width ratio, and amylose content than the other two groups.
For effective conservation and utilization of germplasm, one must analyze the population structure of each crop. The possible population structure of the 76 Korean rice landraces was deduced with a model-based program Structure with 49 SSR loci. The method of STRUCTURE (
Evanno et al. 2005) had predicted K = 2 to be the most likely number of clusters. Based on this, all landraces fell into two subpopulations (membership >80%) (
Fig. 2C). POP-1 and POP-2 were comprised of 54 and 22 landraces, respectively. Landrace IT008749 was observed as admixture.
DISCUSSION
An efficient breeding program requires information concerning the extent and nature of genetic diversity within the germplasm for the characterization and determination of the breeding potential of cultivars (
Asare et al. 2011). Phenotypic identification of plants has been used in the classification of genotypes and the study of their taxonomic status (
Bonierbale et al. 1997;
Nassar 2005). Rice characters are useful for preliminary evaluation because they offer a fast and easy approach for assessing the extent of diversity. In this study, 12 rice characters were able to cluster 76 Korean rice landraces into four groups (
Table 4 and
Fig. 2A), with Group II showing higher mineral contents and lower amylose contents. This result might help us develop new rice populations such as low amylose rice variety for diabetic patients.
In this study, all SSR markers were found to be polymorphic. There was considerable genetic variation among rice landraces, with an average He of 0.61, MAF of 0.52, and PIC of 0.58. Most SSR markers differed in the number of alleles, ranging from 2 to 25. Of the 49 SSR markers, RM214, RM 249, RM48, and RM206 showed higher number of alleles in the 76 Korea rice landraces, which has been reported in previous studies (
Lee et al. 2006;
Zhao et al. 2009;
Li et al. 2014). In addition, 473 alleles were detected in the 76 Korea rice landraces using the 49 SSR markers, with an average of 9.65 alleles per locus. This value is higher than that reported previously for landrace rice (
Bajracharya et al. 2006;
Pandey et al. 2011). These results may provide important genetic resource for rice breeding programs, thus increasing the utilization of rice landraces.
Our model-based structural analysis revealed the presence of two populations (POP1 and POP2) using ΔK = 2. Most landraces were classified into POP1 and POP2, which included 54 and 22 rice landraces, respectively. A similar pattern was also detected in the phylogram (
Fig. 2C). The occurrence of admixed/hybrid genotypes indicated frequent hybridization/introgression events. Although the extent and significance of natural hybridization/introgressions is currently unclear (
Jarvis and Hodgkin 1998), new gene combinations between domestic cultivars and their wild or weedy relatives are important for the evolution of domesticated plant species (
Jarvis and Hodgkin 1999).
Detailed studies on the genetic diversity in germplasm can be performed by rice characters or marker systems such as allozymes, RFLPs, RAPDs, AFLPs, or SSRs (
Wang et al. 2013). In this study, we analyzed genetic diversity of 76 Korean rice landraces using rice characters and SSR markers simultaneously. When genetic diversity was analyzed by rice characters, the 76 Korean rice landraces were mainly clustered according to their rice characters. However, when genetic diversity was assessed by SSR markers, the 76 Korean rice landraces were not clustered according to their rice characters.
Wang et al. (2013) have suggested that different result of clusters based on rice characters and SSR markers might be caused by different purposes and diversified habitats during the breeding period. The difference of genetic diversity based on rice characters and that based on SSR markers in this study might be caused by the selection of farmers and local environment conditions.
For centuries, farming communities have continuously contributed to the evolution, enrichment, and maintenance of landrace diversity on-farm (
Brush 1995;
Jarvis et al. 2008;
FAO 2010). However, little has been done to understand the landrace diversity or to improve these landraces.
Sthapit and Rao (2009) have suggested that landraces can be effectively improved by simple trait selection if these landraces could offer sufficient natural variation in the population. Rice landraces are thought to be intermediate stages in the domestication process from the wild ancestor to cultivated rice. Thus, they represent unique and critical sources of genetically variable traits that can contribute to future rice improvement (
Li et al. 2014). In this study, we estimated the genetic diversity of 76 Korean rice landraces using rice characters and SSR markers. Our results could contribute to more efficient conservation and utilization of rice landraces to broaden the genetic bases of commercially grown varieties of rice.
Supplementary Information
ACKNOWLEDGMENTS
This study was carried out with the support of the Research Program for Agricultural Science & Technology Development (Project No. PJ010883) and was supported by the 2015 Postdoctoral Fellowship Program of National Academy of Agricultural Science, Rural Development Administration, Korea.
Fig. 12D scatter diagram of principal component analysis (PCA) of 76 Korean rice landraces based on 12 rice characters.
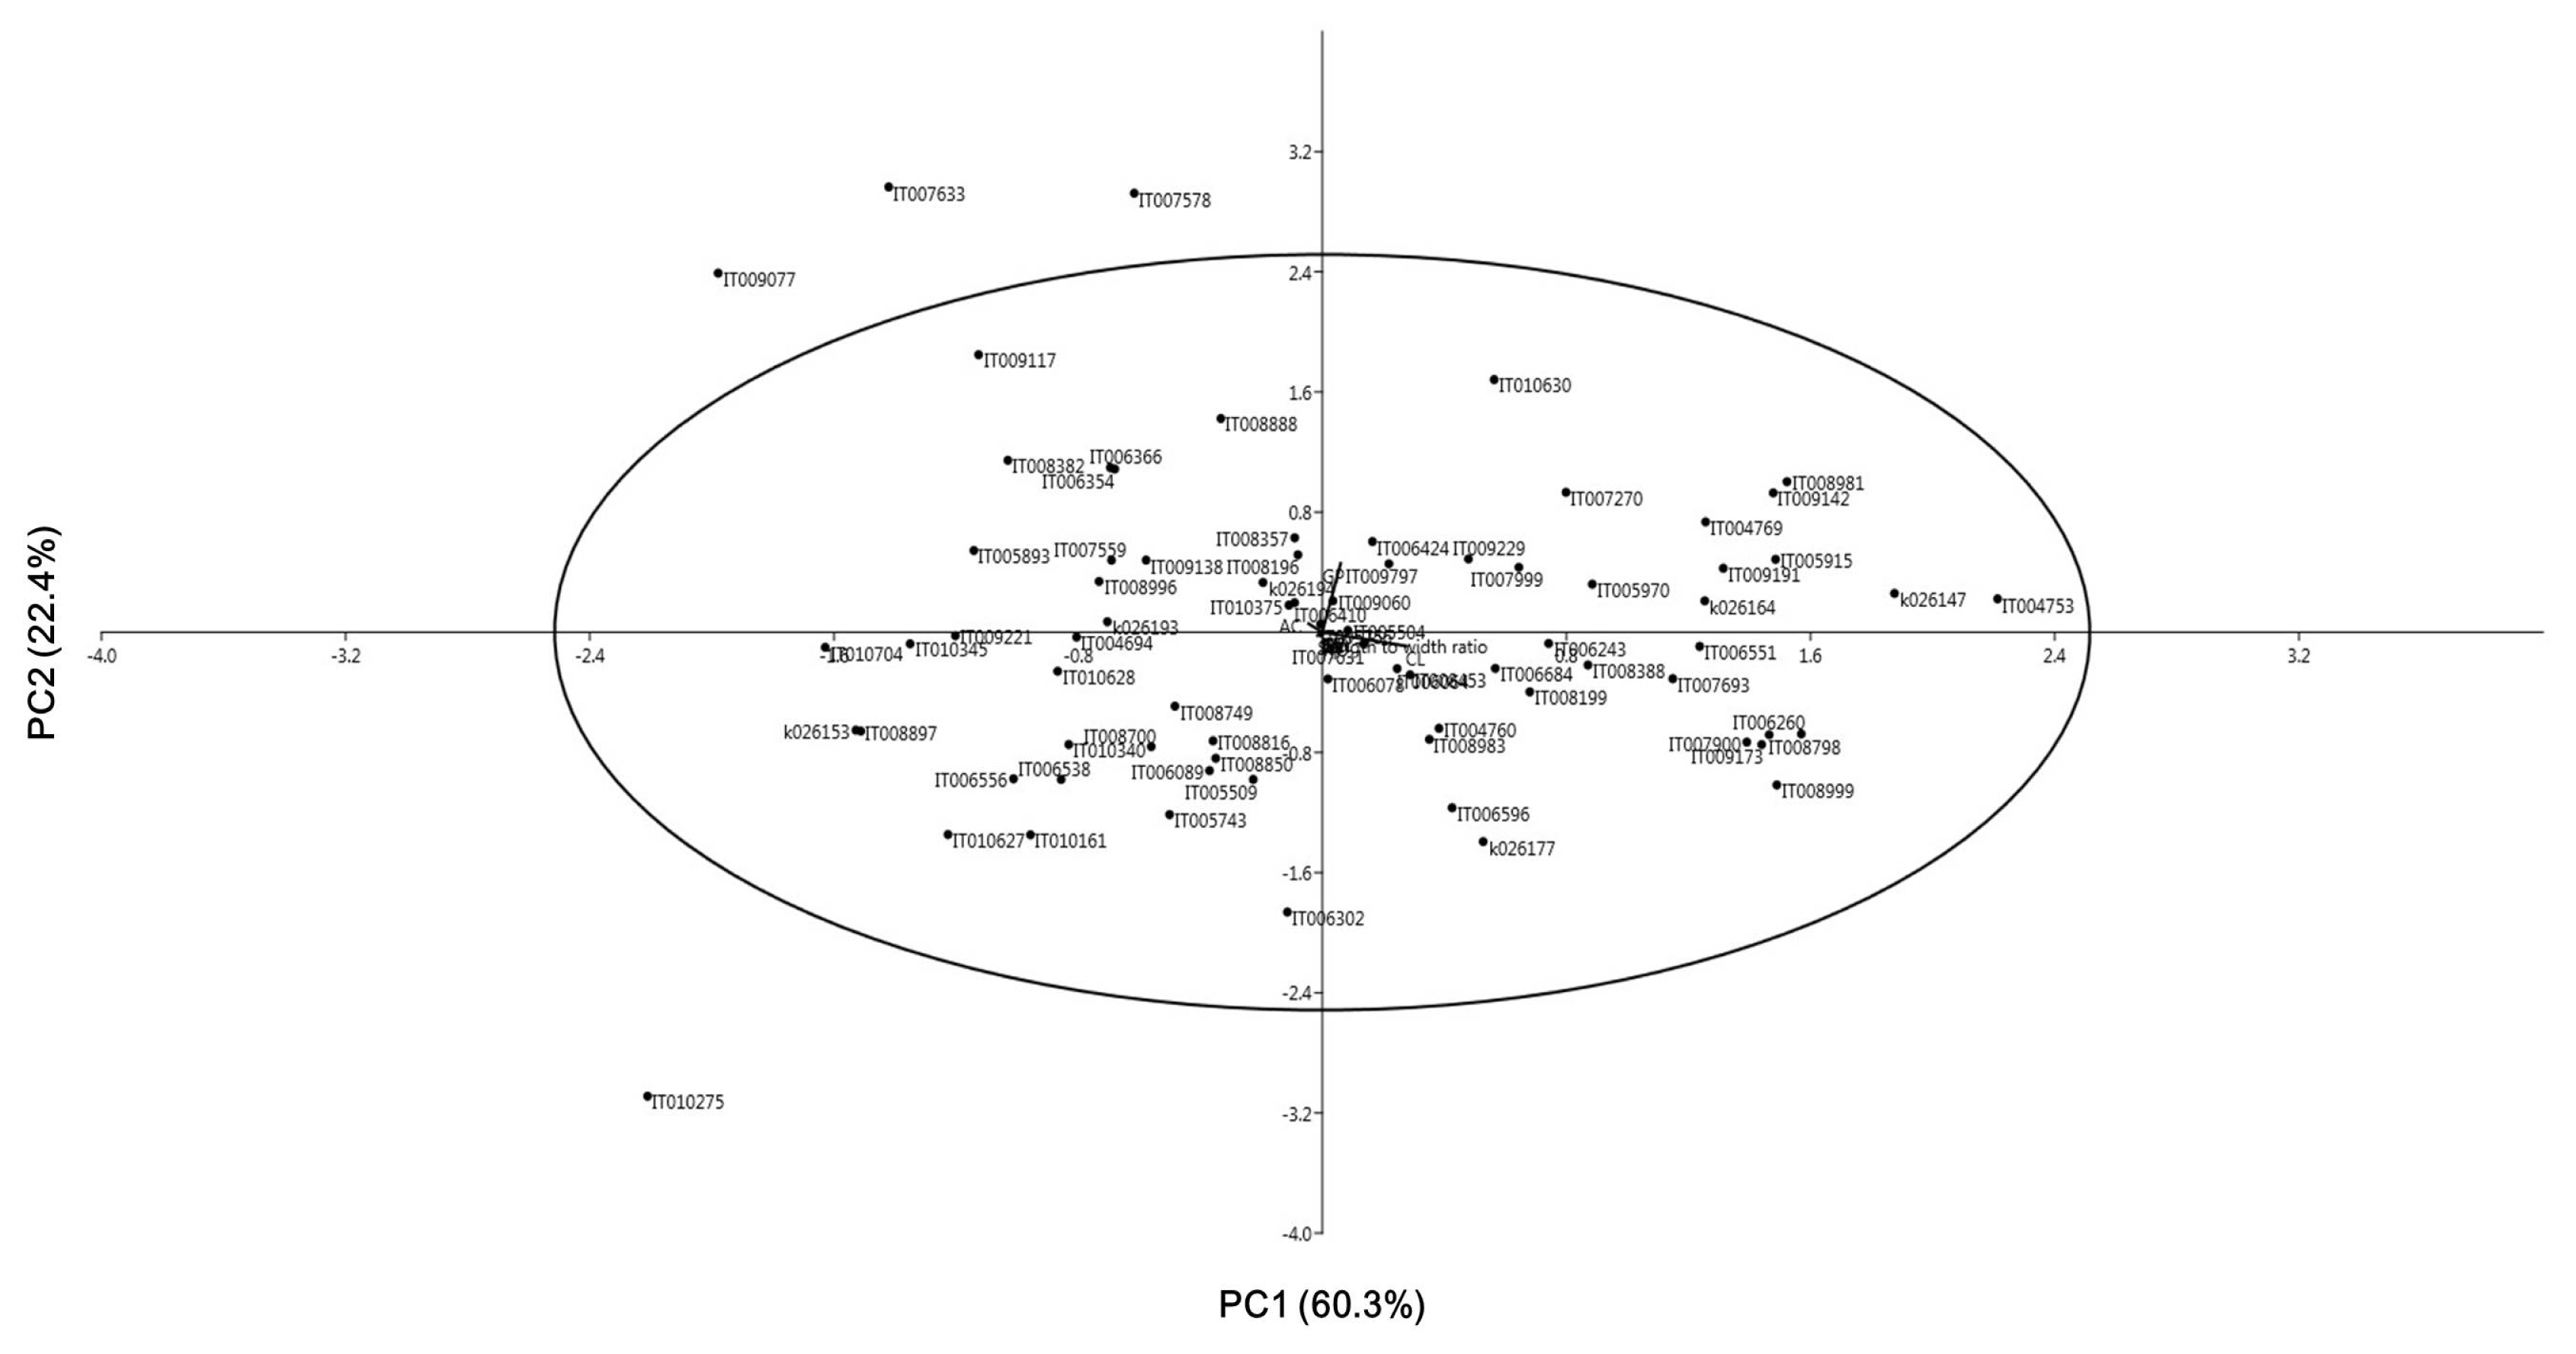
Fig. 2Dendrograms and STRUCTURE analysis of 76 rice accessions. (A) Dendrogram based on 12 rice characters; (B) Dendrogram based on 49 SSR markers; (C) STRUCTURE analysis based on 49 SSR markers.

Table 1Descriptive statistics of 12 rice characters in 76 rice landraces.
Table 1
|
Variable |
Min |
Max |
Mean |
SD |
CV (%) |
|
GPz)
|
80.0 |
136.0 |
112.7 |
9.3 |
8.2 |
|
CL |
68.0 |
131.0 |
101.0 |
14.4 |
14.2 |
|
PL |
17.0 |
30.0 |
23.5 |
2.5 |
10.7 |
|
GL |
4.4 |
5.9 |
5.0 |
0.3 |
6.1 |
|
GW |
2.3 |
3.3 |
2.9 |
0.2 |
6.4 |
|
L/W |
1.4 |
2.5 |
1.7 |
0.2 |
11.8 |
|
SW |
18.6 |
30.7 |
24.6 |
2.9 |
11.8 |
|
GT |
1.8 |
2.5 |
2.0 |
0.1 |
6.8 |
|
Mg |
0.2 |
0.4 |
0.2 |
0.1 |
21.8 |
|
K |
0.6 |
1.2 |
0.8 |
0.1 |
17.0 |
|
AC |
4.9 |
28.9 |
15.5 |
7.2 |
46.5 |
|
TPC |
5.3 |
10.7 |
7.7 |
1.0 |
13.4 |
Table 2Principal component analysis of 11 traits, Eigen values, and percentage variability explained by first two components.
Table 2
|
Characteristics |
PC 1 |
PC 2 |
|
GPz)
|
0.21 |
0.97 |
|
CL |
0.96 |
− 0.20 |
|
PL |
0.03 |
− 0.02 |
|
GL |
− 0.01 |
− 0.01 |
|
GW |
0.00 |
0.00 |
|
L/W |
− 0.00 |
− 0.00 |
|
SW |
− 0.05 |
− 0.04 |
|
GT |
0.00 |
0.00 |
|
Mg |
0.00 |
0.00 |
|
K |
0.00 |
0.00 |
|
AC |
− 0.15 |
0.12 |
|
TPC |
− 0.02 |
− 0.05 |
|
Eigenvalue |
217.5 |
80.6 |
|
% variance |
60.3 |
22.4 |
|
Cumulative variability |
60.3 |
82.7 |
Table 3Characterization of 49 simple sequence repeat (SSR) loci based on 76 Korean rice accessions.
Table 3
|
SSR loci |
NAz)
|
MAF |
NG |
He |
Ho |
PIC |
SSR loci |
NA |
MAF |
NG |
He |
Ho |
PIC |
|
RM5 |
5 |
0.51 |
5 |
0.65 |
0.00 |
0.60 |
RM231 |
9 |
0.59 |
9 |
0.61 |
0.00 |
0.58 |
|
RM19 |
6 |
0.84 |
6 |
0.29 |
0.00 |
0.28 |
RM232 |
16 |
0.33 |
16 |
0.81 |
0.00 |
0.79 |
|
RM21 |
10 |
0.36 |
10 |
0.75 |
0.00 |
0.72 |
RM235 |
10 |
0.71 |
10 |
0.48 |
0.01 |
0.46 |
|
RM44 |
16 |
0.21 |
16 |
0.87 |
0.00 |
0.85 |
RM237 |
9 |
0.49 |
11 |
0.69 |
0.09 |
0.65 |
|
RM48 |
20 |
0.14 |
20 |
0.91 |
0.00 |
0.91 |
RM241 |
18 |
0.24 |
18 |
0.88 |
0.00 |
0.87 |
|
RM53 |
15 |
0.21 |
15 |
0.88 |
0.04 |
0.86 |
RM246 |
10 |
0.37 |
10 |
0.79 |
0.00 |
0.77 |
|
RM70 |
14 |
0.23 |
14 |
0.89 |
0.00 |
0.88 |
RM247 |
13 |
0.33 |
13 |
0.80 |
0.00 |
0.78 |
|
RM101 |
16 |
0.17 |
16 |
0.91 |
0.00 |
0.90 |
RM249 |
24 |
0.14 |
24 |
0.93 |
0.00 |
0.93 |
|
RM118 |
4 |
0.94 |
5 |
0.12 |
0.03 |
0.11 |
RM253 |
10 |
0.53 |
10 |
0.68 |
0.00 |
0.66 |
|
RM133 |
3 |
0.92 |
3 |
0.15 |
0.00 |
0.15 |
RM257 |
6 |
0.29 |
6 |
0.76 |
0.00 |
0.72 |
|
RM142 |
3 |
0.75 |
3 |
0.39 |
0.00 |
0.33 |
RM259 |
15 |
0.15 |
18 |
0.89 |
0.07 |
0.89 |
|
RM144 |
12 |
0.25 |
12 |
0.86 |
0.00 |
0.84 |
RM283 |
8 |
0.42 |
11 |
0.69 |
0.08 |
0.64 |
|
RM154 |
8 |
0.67 |
9 |
0.52 |
0.03 |
0.50 |
RM307 |
5 |
0.89 |
5 |
0.19 |
0.00 |
0.19 |
|
RM164 |
9 |
0.34 |
9 |
0.76 |
0.00 |
0.72 |
RM408 |
5 |
0.86 |
5 |
0.26 |
0.00 |
0.25 |
|
RM171 |
4 |
0.87 |
4 |
0.23 |
0.00 |
0.22 |
RM431 |
7 |
0.62 |
7 |
0.57 |
0.00 |
0.53 |
|
RM185 |
2 |
0.94 |
2 |
0.12 |
0.00 |
0.11 |
RM433 |
4 |
0.53 |
4 |
0.54 |
0.00 |
0.44 |
|
RM206 |
20 |
0.14 |
20 |
0.91 |
0.00 |
0.90 |
RM452 |
2 |
0.91 |
2 |
0.17 |
0.00 |
0.15 |
|
RM208 |
5 |
0.59 |
5 |
0.55 |
0.00 |
0.47 |
RM455 |
3 |
0.90 |
3 |
0.18 |
0.01 |
0.17 |
|
RM210 |
14 |
0.30 |
14 |
0.85 |
0.00 |
0.83 |
RM495 |
6 |
0.70 |
6 |
0.47 |
0.00 |
0.44 |
|
RM213 |
5 |
0.52 |
5 |
0.59 |
0.00 |
0.52 |
RM514 |
7 |
0.73 |
7 |
0.45 |
0.00 |
0.43 |
|
RM214 |
25 |
0.13 |
25 |
0.93 |
0.00 |
0.93 |
GBSS |
8 |
0.52 |
8 |
0.66 |
0.00 |
0.63 |
|
RM215 |
6 |
0.37 |
6 |
0.76 |
0.00 |
0.73 |
SBE |
7 |
0.66 |
7 |
0.54 |
0.00 |
0.51 |
|
RM217 |
10 |
0.47 |
10 |
0.65 |
0.00 |
0.60 |
SSS |
7 |
0.90 |
7 |
0.19 |
0.00 |
0.19 |
|
RM222 |
10 |
0.50 |
11 |
0.70 |
0.04 |
0.68 |
Total |
473 |
- |
- |
- |
- |
- |
|
RM224 |
11 |
0.57 |
11 |
0.63 |
0.00 |
0.59 |
Mean |
9.65 |
0.52 |
9.9 |
0.61 |
0.01 |
0.58 |
|
RM228 |
11 |
0.57 |
11 |
0.63 |
0.00 |
0.60 |
|
|
|
|
|
|
|
Table 4Average values ± SD of each group clustered based on rice characters.
Table 4
|
Group |
GPz)
|
CL |
PL |
GL |
GW |
L/W |
GT |
SW |
Mg |
K |
AC |
TPC |
|
I |
112.3 ± 7.6b |
99.8 ± 14.0b |
24.1 ± 2.7b |
5.1 ± 0.3b |
3.0 ± 0.1b |
1.7 ± 0.1a |
2.1 ± 0.1b |
26.3 ± 2.3c |
0.20 ± 0.03a |
0.69 ± 0.05a |
19.9 ± 2.2c |
7.6 ± 0.8a |
|
II |
115.4 ± 7.8b |
110.3 ± 10.8c |
23.3 ± 2.1ab |
4.8 ± 0.2a |
2.9 ± 0.1b |
1.7 ± 0.1a |
2.0 ± 0.1b |
23.6 ± 2.3b |
0.30 ± 0.03d |
0.95 ± 0.10c |
7.6 ± 5.9a |
7.3 ± 1.1a |
|
III |
116.8 ± 10.9b |
100.3 ± 14.8b |
21.7 ± 2.3a |
4.9 ± 0.2ab |
3.0 ± 0.1b |
1.6 ± 0.1a |
2.1 ± 0.1b |
21.6 ± 1.6a |
0.22 ± 0.04b |
0.75 ± 0.09ab |
14.8 ± 6.1b |
7.6 ± 1.0a |
|
IV |
102.9 ± 10.0a |
85.7 ± 6.2a |
24.0 ± 1.8b |
5.4 ± 0.2c |
2.6 ± 0.2a |
2.1 ± 0.3b |
1.9 ± 0.1a |
24.4 ± 3.4b |
0.28 ± 0.04c |
0.80 ± 0.10b |
17.2 ± 9.6bc |
9.1 ± 0.7b |
Table 5Average values ± SD of each group clustered based on SSR markers.
Table 5
|
Group |
GPz)
|
CL |
PL |
GL |
GW |
L/W |
GT |
SW |
Mg |
K |
AC |
TPC |
|
I |
110.6 ± 7.0a |
105.4 ± 11.9b |
23.1 ± 2.3a |
5.0 ± 0.3a |
3.0 ± 0.1b |
1.7 ± 0.1a |
2.1 ± 0.2b |
25.2 ± 2.9a |
0.23 ± 0.04a |
0.74 ± 0.10a |
16.7 ± 6.5a |
7.7 ± 0.8a |
|
II |
114.0 ± 9.7a |
100.8 ± 15.3ab |
23.6 ± 2.6a |
5.0 ± 0.3a |
3.0 ± 0.1b |
1.7 ± 0.1a |
2.1 ± 0.1b |
24.5 ± 2.9a |
0.24 ± 0.05a |
0.79 ± 0.14a |
14.3 ± 6.7a |
7.6 ± 1.1a |
|
III |
107.0 ± 7.3a |
93.4 ± 8.2a |
23.7 ± 2.8a |
5.4 ± 0.4b |
2.6 ± 0.2a |
2.1 ± 0.3b |
1.9 ± 0.2a |
24.1 ± 3.5a |
0.27 ± 0.04a |
0.81 ± 0.13a |
22.9 ± 8.5b |
8.2 ± 1.0a |
References
- Archak S, Gaikwad AB, Gautam D, Rao EVVB, Swamy KRM, Karihaloo JK. 2003. Comparative assessment of DNA fingerprinting techniques (RAPD, ISSR and AFLP) for genetic analysis of cashew (Anacardium occidentale L.) accessions of India. Genome. 46: 362-69.
- Asre PA, Galyuon IKA, Sarfo JK, Tetteh JP. 2011. Morphological and molecular based diversity studies of some cassava (Manihot esculenta Crantz) germplasm in Ghana. Afr J Biotech. 10: 13900-13908.
- Association of Official Agricultural Chemists (AOAC).2005. Official Methods of Analysis of AOAC International. 18th ed. AOAC International Gaithersburg.
- Bajracharya J, Steele KA, Jarvis DI, Sthapit BR. 2006. Rice landrace diversity in Nepal: Variability of agromorphological traits and SSR markers in landraces from a high-altitude site. Field Crop Res. 95: 327-335.
- Bar-Hen A, Charcosset A, Bourgoin M, Guiard J. 1995. Relationship between genetic markers and morphological traits in a maize inbred lines collection. Euphytica. 84: 145-154.
- Beyene Y, Botha AM, Myburg AA. 2005. A comparative study of molecular and morphological methods of describing genetic relationships in traditional Ethiopian highland maize. African J Biotechnol. 4: 586-595.
- Bonierbale M, Guevara C, Dixon AGO, Ng NQ, Asiedu R, Ng SYC. 1997. Cassava. pp. 1-20. Fuccilo D, Sears L, Stapleton P, editors. Biodiversity in Trust. Cambridge: Cambridge Univ.
- Brush SB. 1995. In situ conservation of landraces in centers of crop diversity. Crop Sci. 35: 346-354.
- Chang TT. 1976. The origin, evolution, cultivation, dissemination, and diversification of Asian and African rice. Euphytica. 25: 425-441.
- Cortese L, Honig J, Miller C, Bonos S. 2010. Genetic diversity of twelve switchgrass populations using molecular and morphological markers. Bioenerg Res. 3: 262-271.
- Dellaporta S, Wood J, Hicks JB. 1983. A plant DNA minipreparation: Version II. Plant Mol Biol Rep. 1: 19-21.
- Evanno G, Regnaut S, Goudet J. 2005. Detecting the number of clusters of individuals using the software STRUCTURE: A simulation study. Mol Ecol. 14: 2611-2620.
- FAO.2010. Second report on the world’s plant genetic resources for food and agriculture. Food and Agriculture Organization. Rome, Italy.
- Garris A, Tai T, Coburn J, Kresovich S, McCouch SR. 2005. Genetic structure and diversity in Oryza sativa L. Genetics. 169: 1631-1638.
- Guevarra E, Lorseto GC, Jackson MT. 2001. Use of conserved rice germplasm. Plant Genet Resour News. 124: 51-56.
- Hammer O, Harper DAT, Ryan PD. 2001. PAST: paleontological statistics software package for education and data analysis. Paleontol Electron. 4: 1-9.
- Hamrich J, Godt M. 1997. Allozyme diversity in cultivated crops. Crop Sci. 37: 26-30.
- Hoisington D, Khairallah M, Reeves T, Ribaut JM, Skovmand B, Taba S, Warburton M. 1999. Plant genetic resources: What can they contribute toward increased crop productivity? Proc Natl Acad Sci USA. 96: 5937-5943.
- Hossain MM, Islam MM, Hosain H, Ali MS, Teixeira da Silva JA, Komamine A, Prodhan SH. 2012. Genetic diversity analysis of aromatic landraces of rice (Oryza sativa L.) by microsatellite markers. Genes Genom Genomic. 6: 42-47.
- Jackson MT. 1999. editors. Managing the world;s largest collection of rice genetic resources. pp. 22-28. In : Rutger JN, JN , Robinson JF, Dilday RH, In: International Symposium on Rice germplasm Evaluation and Enhancement, Arkansas Agricultural Experiment Station Special Report; Arkansas, USA.
- Jarvis DI, Brown AHD, Pham HC, Collado-Panduro L, Latournerie-Moreno L, Gyawali S, Tanto T, Sawadogo M, Mar I, Sadiki M, Hue NTN, Arias-Reyes L, Balma D, Bajracharya J, Castillo F, Rijal D, Belqadi L, Rana R, Saidi S, Ouedraogo J, Zangre R, Rhrib K, Chavez JL, Schoen D, Sthapit B, De Santis P, Fadda C, Hodgkin T. 2008. A global perspective of the richness and evenness of traditional crop-variety diversity maintained by farming communities. Proc Natl Acad Sci USA. 105: 5326-5331.
- Jarvis DI, Hodgkin T. 1998. editors. Wild relatives and crop cultivars: conserving the connection. pp. 163-179. In : Zencirci N, Kaya Z, Anikster Y, Adams WT, In: The Proceedings of an International Symposium on in situ Conservation of Plant Genetic Diversity; George Allen & Unwin. London.
- Jarvis DI, Hodgkin T. 1999. Wild relatives and crop cultivars: detecting natural introgression and farmer selection of new genetic s in agroecosystems. Mol Ecol. 8: S159-S173.
- Lee JK, Chung JW, Park YJ, Ma KH. 2006. Assessment of genetic diversity of Korean landrace rice accessions (Oryza sativa L.) by microsatellite analysis. Kor J Breed. 38: 75-82.
- Li FP, Lee YS, Kwon SW, Li G, Park YJ. 2014. Analysis of genetic diversity and trait correlations among Korean landrace rice (Oryza sativa L). Genet Mol Res. 13: 6316-6331.
- Liu K, Muse SV. 2005. PowerMarker: An integrated analysis environment for genetic marker analysis. Bioinform. 21: 2128-2129.
- Lu B-R, Snow AA. 2005. Gene flow from genetically modified rice and its environmental consequences. BioSci. 55: 669-678.
- Lu B-R, Zhu YY, Wang YY. 2002. The current status and perspectives of on-farm conservation of crop genetic diversity. Biodiv Sci. 10: 409-415.
- McCouch SR, Chen X, Panaud O. 1997. Microsatellite mapping and applications of SSLP’s in rice genetics and breeding. Plant Mol Biol. 35: 89-99.
- Messmer MM, Melchinger AE, Hermann RG, Boppenmaier J. 1993. Relationships among early European maize inbreds: Comparison of pedigree and RFLP data. Crop Sci. 33: 944-950.
- Nassar NMA. 2005. Cassava: Some ecological and physiological aspects related to plant breeding. Gene Conserv. 3: 229-245.
- Normile D. 1997. Archaeology: Yangtze seen as earliest rice site. Science. 275: 309
- Oka HI. 1988. Origin of cultivated rice. Development in crop species. Developments in crop science. 14: Japan Scientific Society Press. Tokyo, Japan.
- Pandey A, Bisht IS, Bhat KV, Mehta PS. 2011. Role of informal seed system in promoting landrace diversity and their on-farm conservation: a case study of rice in Indian Himalayas. Genet Resour Crop Evol. 58: 1213-1224.
- Paterson AH, Tanksley SD, Sorrells ME. 1991. DNA markers in plant improvement. Advan Agron. 46: 39-90.
- Perez CM, Juliano BO. 1978. Modification of the simplified amylose test for milled rice. Starch. 30: 424-426.
- Pritchard JK, Stephens M, Donnelly P. 2000. Inference of population structure using multilocus genotypes. Genetics. 155: 945-959.
- Schuelke M. 2000. An economic method for the fluorescent labeling of PCR fragments. Nat Biotechnol. 18: 233-234.
- Smith JS, Paszkiewicz S, Smith OS, Schaffer J. 1987. Electrophoretic, chromatographic and genetic techniques for identifying associations and measuring genetic diversity among corn hybrids. In: Report of annual corn and sorghum research conference; pp 187-203. American seed trade association. Washington, DC.
- Spicer JI, Gaston KJ. 1999. Physiological diversity and its ecological implication. Wiley-Blackwell.
- Sthapit BR, Rao VR. 2009. Consolidating community’s role in local crop development by promoting farmer innovation to maximise the use of local crop diversity for the well-being of people. Acta Horticulturae. 806: 669-676.
- Tu M, Le BR, Zhu Y, Wang Y. 2007. Abundant within varietal genetic diversity in rice germplasm from Yunnan province of China revealed by SSR fingerprints. Biochem Genet. 45: 789-801.
- Wang L, Jiao S, Jiang Y, Yan H, Su D, Sun G, Yan X, Sun L. 2013. Genetic diversity in parent lines of sweet sorghum based on morphologicalal traits and SSR markers. Field Crops Res. 149: 11-19.
- Zhao WG, Chung J, Ma KH, Kim T. 2009. Analysis of genetic diversity and population structure of rice varieties from Korea, China and Japan using SSR markers. Genes Genom. 31: 283-292.
- Zhu MY, Wang YY, Zhu YY, Lu BR. 2004. Estimating genetic diversity of rice landraces from Yunnan by SSR assay and its implication for conservation. Acta Bot Sin. 46: 1458-1467.