Abstract
Rice anthers from Nipponbare in the flowering stage were collected, proteins extracted and shotgun proteomic analysis conducted. From three biological replications, total 3,198 non-redundant rice anther proteins were identified. There was no bias of physiochemical properties in identified proteins. Proteins showing wide pI value range and molecular weight were identified. The lowest pI value was pH 3.93 (LOC_Os07g41694.1) and the highest was pH 12.48 (LOC_Os01g69020.1). Molecular weights of the identified proteins ranged from 5.2kDa (LOC_Os02g27769.1) to 486.0kDa (LOC_Os09g07300.1). Gene ontolgy enrichment analysis revealed that proteins associated with cellular and metabolic processes, catalytic activity, cell, cell parts, and organelles were enriched in rice anther, suggesting the status of proteins in rice anther were associated with pollen germination and pollen tube elongation. The highly abundant proteins in rice anther were pollen allergens, ATP synthase, glyceraldehyde-3-phosphate dehydrogenase, cupin domain containing proteins, and ascorbate peroxidase.
-
Key words: Rice, Anther, Shotgun proteomics
INTRODUCTION
Rice is an important crop because more than three billion people in Asia consume it. It is a model plant for genomics due to its small genome size. Its genome was revealed in the early stage of genomic research because of importance as a food and model crop. Rice is a staple diet for over half of the people in the world and its consumption in 2014/2015 is over 484,592 thousand metric tons (
http://www.statista.com/statistics/255977/total-global-rice-consumption).
Unlike structural genomic studies where genomic information in all of cell for a certain individual plant is identical, proteomic information is dynamically different among cells of various tissues, environments, and growth stages. Thus, continued proteome identification is required to construct a rice proteome database.
Since the physical size of pollen is so small, protein extraction from the pollen is impossible and anthers were analyzed instead. The anther is located on a stamen. It is composed of archespores, which are surrounded by tapetum. The archespore turn into a pollen sac. In a pollen sac, there are pollen mother cells, which transform into pollen after passing through two rounds of meiosis. Because of the difficulty in collecting rice anther and extracting proteins for proteomic analysis, limited numbers of rice anther proteome studies are reported.
The 2-dimensional polyacrylamide gel electrophoresis (2D-PAGE) (
Mahmud et al. 2012;
O’Farrell 1975) is a technique widely used in proteomic analysis (
S. Komatsu 1993) because of its simplicity and fast results. Currently, an advanced proteomics system has emerged, called the ‘shotgun proteomic method’ (
Haynes and Roberts 2007). The shotgun proteomic method is also called multidimensional protein identification technology (MudPIT). The benefits of this method is that it can analyze large-scale proteins for identification and it is high-throughput (
Agrawal et al. 2009). This method can be used complementary to 2D-PAGE and can get results in a faster time-frame (
Lee and Cooper 2006). For these reasons, MudPIT is of interest.
Previous proteome research for rice pollen focuses on the stress response (
Imin et al. 2004;
Nijat Imin 2006) using 2D-PAGE to reveal differentially expressed proteins. However, the identification of proteins was limited to differentially expressed proteins. In this work, we conducted shotgun proteomics analysis using rice anthers to identify the rice anther proteome.
MATERIALS AND METHODS
Plant materials
The seeds of rice, Oryza sativa L. Nipponbare were germinated and grown in 15 × 30 cm rows at the Seoul National University experimental field, Suwon, Republic of Korea. Rice anthers in the flowering stage were collected. To unify the developing stages of the collected anthers, anthers were collected from only one panicle and the upper part of spikelet, where the anther exerts from the spikelet, was not used. Only 3 cm width anthers inside in the spikelet located in the middle of the panicle were collected.
Protein extraction
The samples were bottled into 1.5 ml Eppendorf tubes with 2–3 of small ball bearings. The tubes were stored in liquid nitrogen then ground to break the cell wall. Next, the proteins were extracted by adding extraction buffer (8 M Urea/5 mM DTT/1% LDS/100 mM Tris pH 8.5) to the ground powder. The suspension was incubated at room temperature for 30 minutes followed by centrifugation at 14,000 g for 15 minutes. The protein concentration of the supernatant was measured. The extracted proteins were precipitated overnight with 20% (v/v) trichloroacetic acid (TCA), washed several times with cold acetone until chlorophyll or other pigments removed. Finally, the extracted proteins were resolublized in 8 M Urea/Tris-HCl pH 8.5. Protein concentration was assayed by the 2D-Protein Quant Kit (GE Healthcare, Piscataway, NJ, USA) with the method by
Lee et al. (2007b).
Five-hundred μg of protein from pollen powder was prepared with NuPage® LDS Sample Buffer (4X)/NuPAGE® Reducing Agent (10X)/Deionized Water (Invitrogen, Carlsbad, CA, USA). The proteins were loaded into 4–12% NuPAGE® Novex Bis-Tris Mini Gels (Life Technologies, Invitrogen, Carlsbad, CA, USA), then separated by electrophoresis. After electrophoresis, the gels were fixed in 100 mL of fixing solution (Deionized Water 40 ml/Methanol 50 ml/Acetic Acid 10 ml) for 10 minutes and the fixing solution drained. To stain the protein bands, staining solution (Deionized Water 55 ml/Methanol 20 ml/Stainer A 20 ml, NOVEX® Colloidal Blue Stain Kit (Invitrogen)/Stainer B 5 ml, NOVEX® Colloidal Blue Stain Kit (Invitrogen)) was used.
Each lane of stained protein bands was sliced into seven equal pieces. Each piece was further divided into smaller regular hexahedronal cubes (approximate size 1 mm3) and gathered into a 1.5 ml Eppendorf® tube. In each tube, destaing buffer (50% acetonitrile (ACN) in 50 mM ammonium bicarbonate (ABC) pH 7.8) was added to remove the Coomassie blue stain. The tube contents were dehydrated in a SpeedVac, then reduced with reduction buffer (10 mM DTT in 25 mM NH4HCO3) for 45 minutes, at 56°C and alkylated for 30 minutes with alkylation buffer (55 mM iodoacetamide in 25 mM NH4HCO3) at room temperature in a dark environment. The gels pieces were dried by SpeedVac and digested with trypsin (trypsin 12.5 ng/μl in 50 mM NH4HCO3). Finally, the gel fragments in digestion solution were incubated at 36°C overnight. Tryptic peptides were harvested from the gel using harvest buffer (5% formic acid in 50% acetonitrile). Following vortex, the solution was spun down for few seconds and kept at room temperature for 20 minutes. Supernatants were dehydrated by the SpeedVac, and the samples were desalted by Pierce® C18 spin columns (Thermo Scientific, Rockford, IL, USA). Each sample was then ready to analyze with LC MS/MS.
LC MS/MS Analysis with Q Exactive
A Nanoflow HPLC instrument (Easy nLC, Thermo Fisher Scientific, San Jose, CA, USA) was connected on-line to a Q Exactive mass spectrophotometer (Thermo Fisher Scientific, Bremen, Germany). The columns for analysis (12 cm, 75 μm inner diameter) were packed in-house with Alltima C18-AQ 5 μm resin. There are two buffers (0.1% formic acid, Buffer A and acetonitrile in 0.1% formic acid, buffer B) for reverse phase chromatography. The samples were separated with a binary buffer system in a linear gradient of 3–50% buffer B at a flow rate of 270 nL/min. The total run time for the LC MS/MS is 120 minutes.
MS data was acquired using a data-dependent top 8 method, which dynamically chooses the most abundant precursor ions among the survey scan (300–2,000 Da) for higher-energy collisional dissociation (HCD) fragmentation. Dynamic exclusion duration was 15s HCD fragmentation. Survey scans were acquired at a resolution of 70,000 m/z 200 and resolution for HCD spectra was set to 17,500 m/z 200.
Analysis of proteomic data
Q-Extractive analysis, using Proteome Discoverer (verision 1. 3) software (Thermo Fisher Scientific), was used for protein identification from the MS/MS spectra data acquired. This program provided p
I values and molecular weights (MW) for each identified protein. The protein database for fragmentation spectra analysis was the TIGR Rice Pseudo-molecule protein database Release V7.0 (
http://rice.plantbiology.msu.edu/annotation_pseudo_current.shtml) with precursor and fragment mass tolerances set to 10 ppm and 0.8 Da, respectively, with up to two missed cleavages. A possible modification of peptide was considered carbamidomethylation of cysteine was set as a fixed modification and the oxidation of methionine was set as a variable modification for data mining. To revise these modifications, both identifications were filtered at a 1% false discovery rate.
where the total number of MS/MS spectra matching peptides from protein k (SpC) is divided by the protein’s length (L), then divided by SpC/L for all N proteins in the experiment.
Bioinformatics Analysis of Proteomic Data
RESULTS AND DISCUSSION
Identified proteins in rice anther
Rice anther proteome were identified with three biological replications. A total of 3,198 non-redundant proteins were identified by merging all three replications’ MudPIT runs. The number of each identified protein replications were 2,645 (Replication 1), 2,662 (Replication 2), 2,702 (Replication 3). All 3,198 proteins were not identified through the three replications reproducibly. This resulted from the analytical incompleteness phenomenon, which happens when identifying highly complex mixtures of peptides. A single analytical run may only recognize a fraction of associated peptides when analyzing a highly complex peptide mixture (
Wilkins et al. 2006). Since proteins exist in a cell, in huge dynamic ranges, and the physiochemical properties of the proteins vary, a single analysis of proteome identification is not enough to reveal the entire proteome. In this study, ~ 2,600 proteins were identified from a single MudPIT run. 2D-PAGE analysis generally resolves ~1,000 protein spots in a single 2D-gel, whereas a single MudPIT run showed a higher resolving power.
The physiochemical properties of the 3,198 identified proteins were analyzed. The proportion of the distribution of p
I values and MWs for the 3,198 proteins were compared to those of entire rice genome (
Fig. 1). The lowest p
I value was pH 3.93 (LOC_Os07g41694.1) and the highest was pH 12.48 (LOC_Os01g69020.1). The overall distribution of the p
I value of the identified proteins was similar to that of entire rice genome even though the identification of the proteins ranging of pH 5–6 and pH 6–7 are slightly higher (
Fig. 1A). In the plant proteome study with 2D-PAGE, proteins were generally resolved in the p
I value range of pH 4 to 7.
We identified a wide distribution of acidic and basic proteins; of note, ~40% of the proteins were basic proteins, implying that the protein deification was unbiased by p
I value. The MWs of the identified proteins from pollen ranged from 5.2 kDa (LOC_Os02g27769.1) to 486.0 kDa (LOC_Os09g07300.1). The distribution of the MW was quite similar with entire rice genome (
Fig. 1B). Proteins having less than 20 kDa were less likely to be identified. This may be due to MudPIT analysis relying on peptide detection. Peptides originate from proteins and proteins having a low MW can produce a small number of peptides decreasing chances of mass spectrometry detection in comparison to high MW proteins.
To represent the overall trends of the existing proteins mature anthers, the GO categories of the identified 3,198 proteins were analyzed. The identified proteins were categorized into 22 groups by their protein class (
Fig. 2). There were four categories consisting over 46.5% of GO. The category of hydrolase (12.8%) and transferase (12.8%) were the highest, followed by the categories of oxidoreductase (10.7%) and nucleic acid binding proteins (10.2%).
GO enrichment analysis was conducted with total 3,198 rice anther proteins to reveal that 16 GO terms of biological processes (
Fig. 3a), five GO terms of molecular functions (
Fig. 3b), and six GO terms of cellular components were enriched in rice anther compared to the proportion of those proteins in the whole rice genome (
Fig. 3c).
Proteins associated with biological processes, specifically, proteins associated with cellular and metabolic processes were present in high proportions. Concerning molecular function, the proteins associated with catalytic activity were enriched. In relation to cellular components, proteins associated with the cell, cell part and organelle were enriched. These results imply that the mature anthers were preparing for cell nucleus division, pollen tube germination and elongation. The proteins for catalytic activity imply that starch in pollen is a material that supports pollen germination and pollen tube elongation. Possibly, proteins associated with metabolism utilize stored starch in pollen as energy/carbon skeleton-building material (
Dai et al. 2006).
During pollen tube germination and pollen tube elongation, cell wall and cellular organelle synthesis is required. Thus, the enriched proteins associated with cell, cell parts, and organelles suggest that those proteins exist in mature pollen for pollen germination and pollen tube elongation (
Drøbak et al. 2004;
Suen et al. 2003). This rice anther proteome database was constructed from rice anthers in natural field conditions, thus the enrichment of the proteins associated with response to stimulus were unexpected. Generally, the roles of those proteins are tolerant of environmental stressors. Pollen is very vulnerable to the environment, such as high temperatures (
Jagadish et al. 2007;
Prasad et al. 2006), Thus enrichment of pollens and mature pollens represent preparation to respond to an unfavorable environment (
Dai et al. 2006;
Dietz 2003;
Foyer and Noctor 2005;
Sheoran et al. 2007).
The relative amount of the 3,198 identified proteins is estimated from the spectral counts of the MS/MS spectra. Although the mass spectrometry of MudPIT is qualitative, where MS/MS spectra are mainly used for protein identification, methods for quantification in MudPIT have recently been developed (
Liu et al. 2004;
Washburn et al. 2002). To estimate the relative quantity, the spectral count (SC), which assesses the total number of assigned MS/MS spectra for peptides from a given protein, is considered an accurate method. SC is linearly correlated with protein abundance over a dynamic range of two orders of magnitude (
Dong et al. 2007). With proper normalization of SC, the relative protein concentrations can be estimated (
Zybailov et al. 2006b).
With the relative protein amount for all of the identified proteins, 20 highly expressed proteins in rice anther are listed in
Table 1. For general rice leaf proteome studies, the highly abundant proteins are RuBisCO proteins. In rice anther proteins, we detected several pollen allergens and they were present in high amounts. It is known that pollen allergen proteins are allergenic to humans, however in plants, pollen allergen proteins are present in high amounts suggesting that these proteins have physiological roles required in pollen germination and growth (
Songnuan 2013).
In addition, ATP synthase and glyceraldehyde-3-phosphate dehydrogenase were present in high amounts, suggesting that in mature pollen proteins that supply energy for pollen germination and tube elongation are present in high amounts. Interestingly, two cupin domain-containing proteins were identified in high amounts. Cupins are expressed in the early phase of wheat embryo germination. This study suggests the possible role of the cupins in rice pollen germination. As discussed in the previous section, stress resistant protein, ascorbate peroxidase was present in high amounts. Ascorbate peroxidase is an enzyme that detoxifies peroxides, such as hydrogen peroxide. A previous tomato pollen proteome study reported the role of ascorbate peroxide in detoxification (
Sheoran et al. 2007). One protein of unknown function (LOC_Os08g12520) was present in high amounts. In the BLSAT search, all of the homologue proteins are uncharacterized. Based on the high amount of this protein in rice anther, it may have a role in pollen germination and tube elongation; however, further study of this protein is required to reveal its role in rice pollen.
CONCLUSION
In summary, with high-throughput proteomic analysis method of shotgun proteomics, we could identified total 3,198 non-redundant rice anther proteins. There was no bias of physiochemical properties in identified proteins showing wide pI value range and molecular weight. Gene ontolgy enrichment analysis revealed that proteins associated with cellular and metabolic processes, catalytic activity, cell, cell parts, and organelles were enriched in rice anther, suggesting the status of proteins in rice anther were associated with pollen germination and pollen tube elongation. With estimated relative amount of the total identified proteins, we could detect highly abundant proteins in rice anther. There were pollen allergens, ATP synthase, glycer-aldehyde-3-phosphate dehydrogenase, cupin domain containing proteins, and ascorbate peroxidase.
ACKNOWLEDGEMENTS
This research was supported by the Basic Science Research Program through the National Research Foundation of Korea (NRF) funded by the Ministry of Education (NRF-2012R1A1A1004138). This research was also supported by the “Cooperative Research Program for Agriculture Science & Technology Development (Mapping/Detection of genes conferring resistance to rice brown plant hopper and cold stress and development of breeding materials PJ01104202)” in the Rural Development Administration Republic of Korea
Fig. 1The proportion of physiochemical property of the identified rice anther proteome.
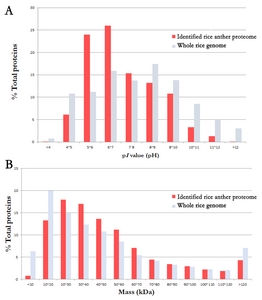
Fig. 2Pie chart of the protein classes of the identified rice anther proteins.
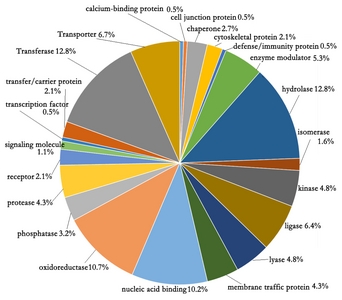
Fig. 3Enriched GO terms of rice anther proteins: (a): biological processes, (b): molecular functions and (c): cellular components.
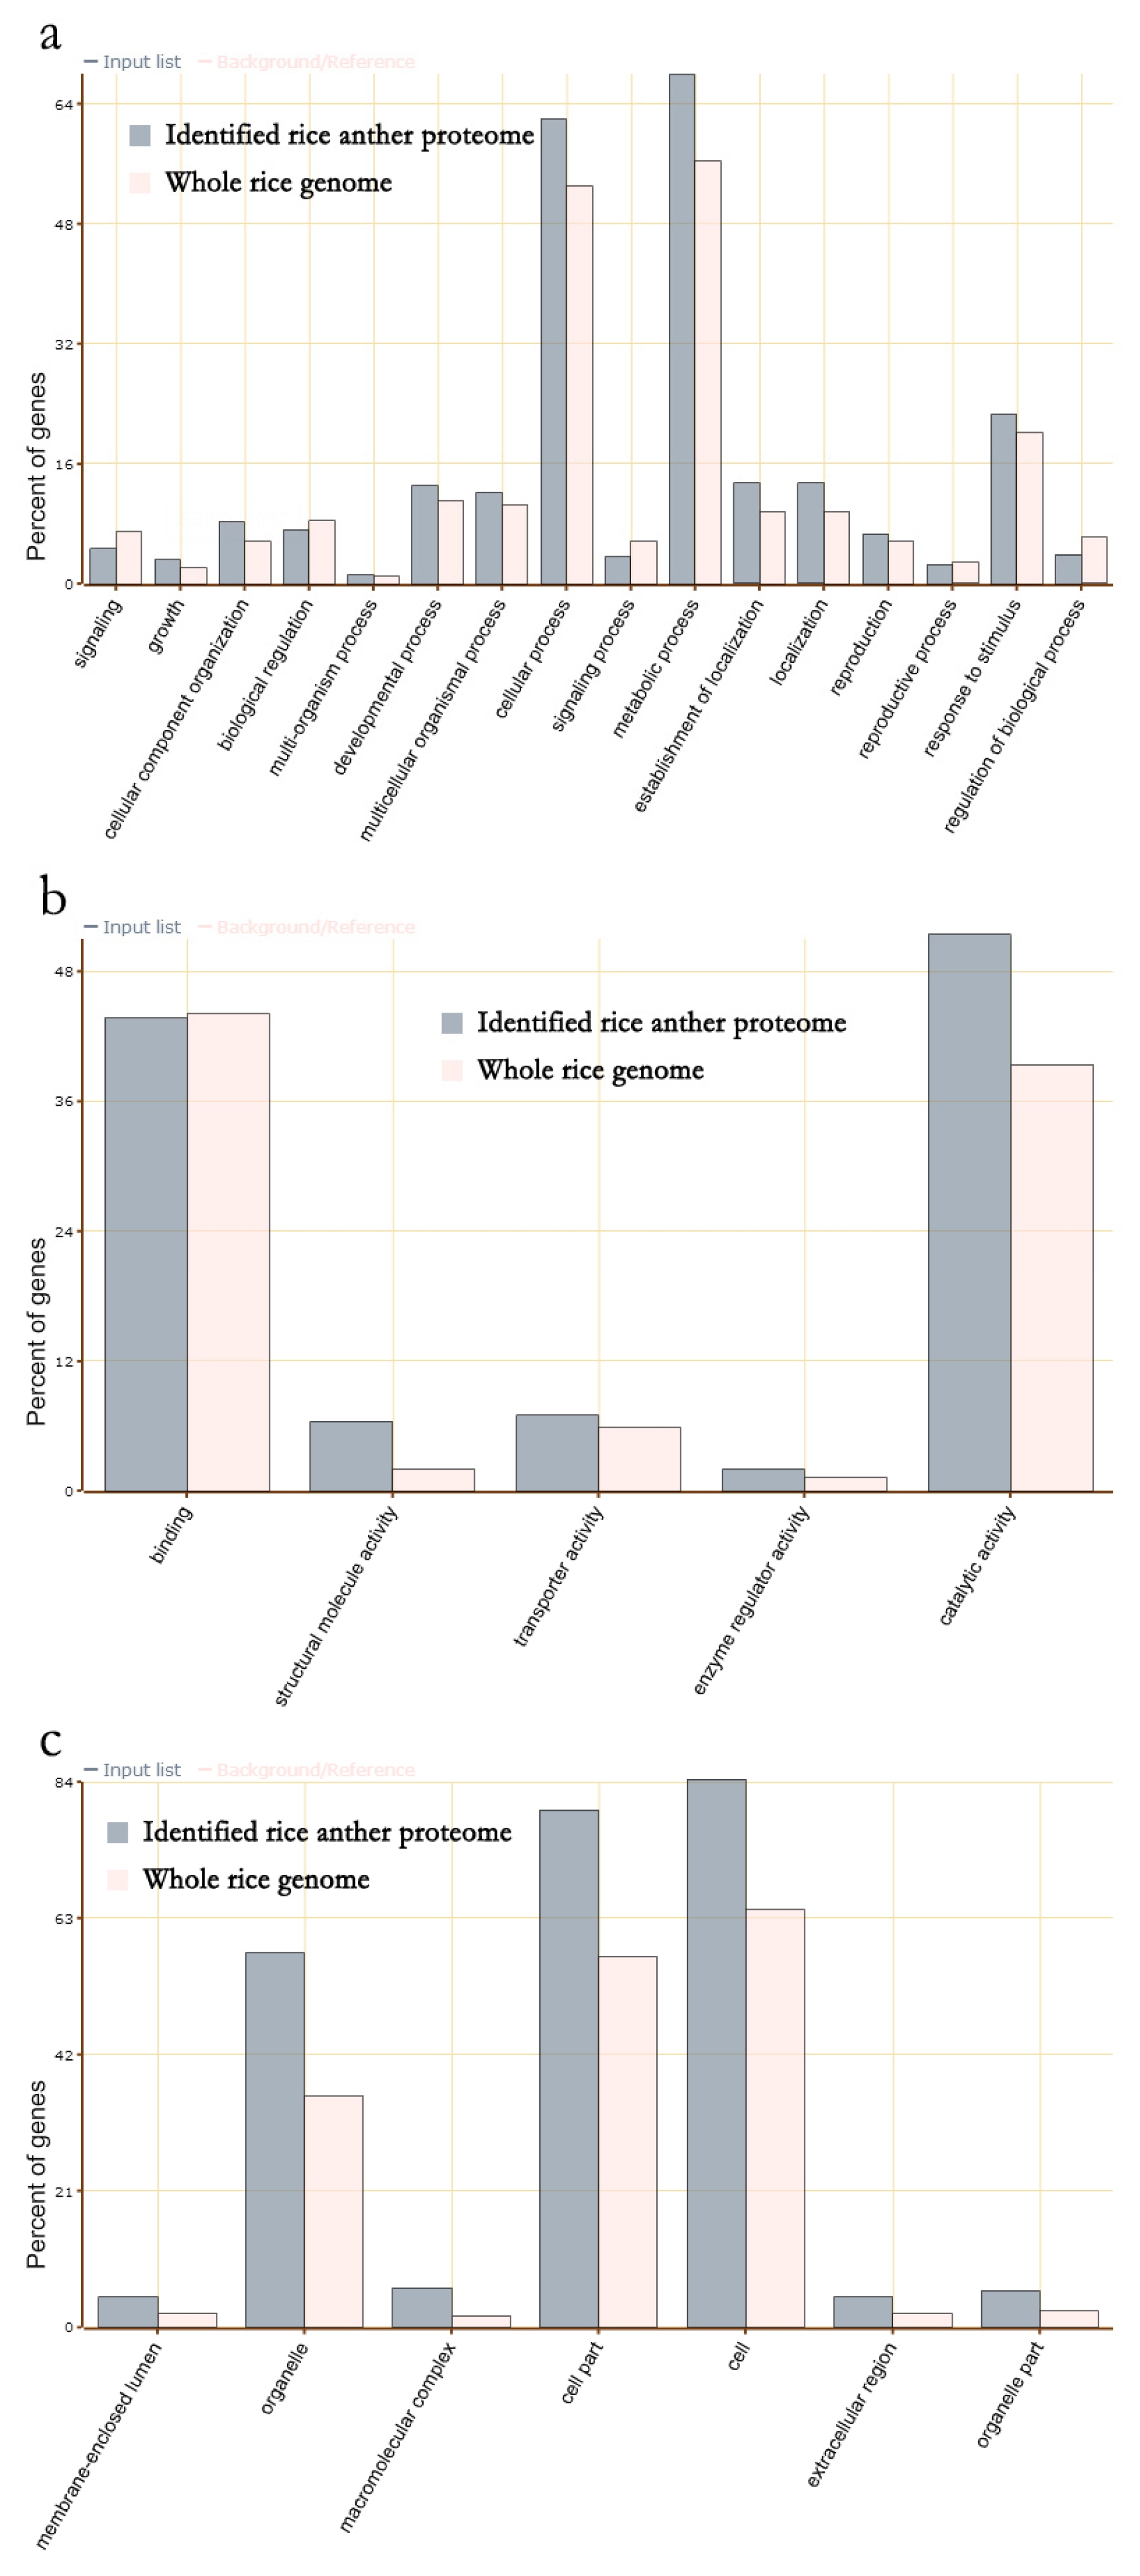
Table 1The 20 most abundant proteins in the rice anther genome.
Table 1
|
Accession |
Description |
AAsz)
|
MW [kDa] |
calc. pI |
|
LOC_Os09g23999.1 protein |
pollen allergen Cyn d 23, putative, expressed |
134 |
14.0 |
8.07 |
|
LOC_Os09g23899.1 protein |
pollen allergen Cyn d 23, putative, expressed |
134 |
14.0 |
6.76 |
|
LOC_Os04g26220.1 protein |
pollen allergen, putative, expressed |
117 |
12.4 |
6.06 |
|
LOC_Os05g02520.1 protein |
cupin domain containing protein, expressed |
359 |
38.2 |
6.16 |
|
LOC_Os06g45180.1 protein |
pollen allergen, putative, expressed |
117 |
12.3 |
6.68 |
|
LOC_Os01g74480.1 protein |
cupin domain containing protein, expressed |
377 |
40.2 |
5.94 |
|
LOC_Os04g26230.1 protein |
pollen allergen, putative, expressed |
117 |
12.4 |
5.48 |
|
LOC_Os08g12520.1 protein |
expressed protein |
226 |
24.8 |
5.69 |
|
LOC_Os04g25150.1 protein |
pollen allergen, putative, expressed |
117 |
12.4 |
5.48 |
|
LOC_Os04g40950.1 protein |
glyceraldehyde-3-phosphate dehydrogenase, putative, expressed |
337 |
36.7 |
6.81 |
|
LOC_Os05g47980.1 protein |
ATP synthase, putative, expressed |
552 |
58.9 |
6.37 |
|
LOC_Os01g49190.1 protein |
ATP synthase, putative, expressed |
557 |
59.4 |
6.55 |
|
LOC_Os08g03290.1 protein |
glyceraldehyde-3-phosphate dehydrogenase, putative, expressed |
337 |
36.4 |
7.11 |
|
LOC_Os02g38920.1 protein |
glyceraldehyde-3-phosphate dehydrogenase, putative, expressed |
356 |
39.0 |
6.95 |
|
LOC_Os04g25190.1 protein |
pollen allergen, putative, expressed |
117 |
12.3 |
8.10 |
|
LOC_Os03g17690.1 protein |
OsAPx1 - Cytosolic Ascorbate Peroxidase encoding gene 1–8, expressed |
250 |
27.1 |
5.66 |
|
LOC_Os03g50885.1 protein |
actin, putative, expressed |
377 |
41.8 |
5.49 |
|
LOC_Os07g49400.2 protein |
OsAPx2 - Cytosolic Ascorbate Peroxidase encoding gene 4,5,6,8, expressed |
251 |
27.1 |
5.36 |
|
LOC_Os03g50290.1 protein |
14-3-3 protein, putative, expressed |
260 |
29.2 |
4.88 |
|
LOC_Os10g08550.1 protein |
enolase, putative, expressed |
480 |
51.6 |
5.99 |
References
- Agrawal GK, Jwa NS, Rakwal R. 2009. Rice proteomics: ending phase I and the beginning of phase II. Proteomics. 9: 935-963.
- Anwar MR, Liu DL, Macadam I, Kelly G. 2012. Adapting agriculture to climate change: a review. Theor Appl Climatol. 113: 225-245.
- Dai S, Li L, Chen T, Chong K, Xue Y, Wang T. 2006. Proteomic analyses of Oryza sativa mature pollen reveal novel proteins associated with pollen germination and tube growth. Proteomics. 6: 2504-2529.
- Dietz K-J. 2003. PLANT PEROXIREDOXINS. Annual Review of Plant Biology. 54: 93-107.
- Dong MQ, Venable JD, Au N, Xu T, Park SK, Cociorva D, Johnson JR, Dillin A, Yates JR 3rd. 2007. Quantitative mass spectrometry identifies insulin signaling targets in C. elegans. Science. 317: 660-663.
- Drøbak BK, Franklin-Tong VE, Staiger CJ. 2004. The role of the actin cytoskeleton in plant cell signaling. New Phytologist. 163: 13-30.
- Du Z, Zhou X, Ling Y, Zhang Z, Su Z. 2010. agriGO: a GO analysis toolkit for the agricultural community. Nucleic acids research. gkq310.
- Foyer CH, Noctor G. 2005. Oxidant and antioxidant signalling in plants: a re-evaluation of the concept of oxidative stress in a physiological context. Plant, Cell & Environment. 28: 1056-1071.
- Griffin NM, Yu J, Long F, Oh P, Shore S, Li Y, Koziol JA, Schnitzer JE. 2010. Label-free, normalized quantification of complex mass spectrometry data for proteomic analysis. Nat Biotech. 28: 83-89.
- Haynes PA, Roberts TH. 2007. Subcellular shotgun proteomics in plants: looking beyond the usual suspects. Proteomics. 7: 2963-2975.
- Imin N, Kerim T, Rolfe BG, Weinman JJ. 2004. Effect of early cold stress on the maturation of rice anthers. Proteomics. 4: 1873-1882.
- Jagadish SV, Craufurd PQ, Wheeler TR. 2007. High temperature stress and spikelet fertility in rice (Oryza sativa L). Journal of experimental botany. 58: 1627-1635.
- Julia C, Dingkuhn M. 2013. Predicting temperature induced sterility of rice spikelets requires simulation of crop-generated microclimate. European Journal of Agronomy. 49: 50-60.
- Lee DG, Ahsan N, Lee SH, Kang KY, Lee JJ, Lee BH. 2007a. An approach to identify cold-induced low-abundant proteins in rice leaf. Comptes rendus biologies. 330: 215-225.
- Lee J, Cooper B. 2006. Alternative workflows for plant proteomic analysis. Molecular bioSystems. 2: 621-626.
- Lee J, Garrett WM, Cooper B. 2007b. Shotgun proteomic analysis of Arabidopsis thaliana leaves. Journal of separation science. 30: 2225-2230.
- Liu H, Sadygov RG, Yates JR 3rd. 2004. A model for random sampling and estimation of relative protein abundance in shotgun proteomics. Analytical chemistry. 76: 4193-4201.
- Mackill DJ, Coffman WR, Rutger JN. 1982. Pollen Shedding and Combining Ability for High Temperature Tolerance in Rice. Crop Science. 22: 730-733.
- Mahmud SA, Hirasawa T, Furusawa C, Yoshikawa K, Shimizu H. 2012. Understanding the mechanism of heat stress tolerance caused by high trehalose accumulation in Saccharomyces cerevisiae using DNA microarray. Journal of bioscience and bioengineering. 113: 526-528.
- Matsui T, Omasa K, Horie T. 2000. High Temperature at Flowering Inhibits Swelling of Pollen Grains, a Driving Force for Thecae Dehiscence in Rice (Oryza sativa L). Plant Production Science. 3: 430-434.
- Matsui T, Omasa K, Horie T. 2001. The Difference in Sterility due to High Temperatures during the Flowering Period among Japonica-Rice Varieties. Plant Production Science. 4: 90-93.
- Mirzaei M, Soltani N, Sarhadi E, Pascovici D, Keighley T, Salekdeh GH, Haynes PA, Atwell BJ. 2012. Shotgun proteomic analysis of long-distance drought signaling in rice roots. Journal of proteome research. 11: 348-358.
- Nijat Imin TK, Weinman Jeremy J, Rolfe Barry G. 2006. Low Temperature Treatment at the Young Microspore Stage Induces Protein Changes in Rice Anthers. Molecular & Cellular Proteomics. 5: 274-292.
- O’Farrell PH. 1975. High resolution two-dimensional electrophoresis of proteins. Journal of Biological Chemistry. 250: 4007-4021.
- Oliver SN, Van Dongen JT, Alfred SC, Mamun EA, Zhao X, Saini HS, Fernandes SF, Blanchard CL, Sutton BG, Geigenberger P, Dennis ES, Dolferus R. 2005. Cold-induced repression of the rice anther-specific cell wall invertase gene OSINV4 is correlated with sucrose accumulation and pollen sterility. Plant, Cell & Environment. 28: 1534-1551.
- Paoletti AC, Parmely TJ, Tomomori-Sato C, Sato S, Zhu D, Conaway RC, Conaway JW, Florens L, Washburn MP. 2006. Quantitative proteomic analysis of distinct mammalian Mediator complexes using normalized spectral abundance factors. Proceedings of the National Academy of Sciences. 103: 18928-18933.
- Prasad PVV, Boote KJ, Allen LH, Sheehy JE, Thomas JMG. 2006. Species, ecotype and cultivar differences in spikelet fertility and harvest index of rice in response to high temperature stress. Field Crops Research. 95: 398-411.
- Komatsu SHK, Hirano H. 1993. A rice protein library: a data-file of rice proteins separated by two-dimensional electrophoresis. Theor Appl Genet. 86: 935-942.
- Satake T, Hayase H. 1974. Male sterility caused by cooling treatment at the young microspore stage in rice plants. Crop Sci Soc Japan. 43: 36-39.
- Sheoran IS, Ross AR, Olson DJ, Sawhney VK. 2007. Proteomic analysis of tomato (Lycopersicon esculentum) pollen. Journal of experimental botany. 58: 3525-3535.
- Songnuan W. 2013. Wind-pollination and the roles of pollen allergenic proteins. Asian Pacific journal of allergy and immunology/launched by the Allergy and Immunology Society of Thailand. 31: 261-270.
- Suen DF, Wu SS, Chang HC, Dhugga KS, Huang AH. 2003. Cell wall reactive proteins in the coat and wall of maize pollen: potential role in pollen tube growth on the stigma and through the style. The Journal of biological chemistry. 278: 43672-43681.
- Washburn MP, Ulaszek R, Deciu C, Schieltz DM, Yates JR 3rd. 2002. Analysis of quantitative proteomic data generated via multidimensional protein identification technology. Analytical chemistry. 74: 1650-1657.
- Wilkins MR, Appel RD, Van Eyk JE, Chung MC, Gorg A, Hecker M, Huber LA, Langen H, Link AJ, Paik YK, Patterson SD, Pennington SR, Rabilloud T, Simpson RJ, Weiss W, Dunn MJ. 2006. Guidelines for the next 10 years of proteomics. Proteomics. 6: 4-8.
- Yan S, Tang Z, Su W, Sun W. 2005. Proteomic analysis of salt stress-responsive proteins in rice root. Proteomics. 5: 235-244.
- Yang P, Li X, Wang X, Chen H, Chen F, Shen S. 2007a. Proteomic analysis of rice (Oryza sativa) seeds during germination. Proteomics. 7: 3358-3368.
- Yang Q, Wang Y, Zhang J, Shi W, Qian C, Peng X. 2007b. Identification of aluminum-responsive proteins in rice roots by a proteomic approach: cysteine synthase as a key player in Al response. Proteomics. 7: 737-749.
- Zhao C, Wang J, Cao M, Zhao K, Shao J, Lei T, Yin J, Hill GG, Xu N, Liu S. 2005. Proteomic changes in rice leaves during development of field-grown rice plants. Proteomics. 5: 961-972.
- Zybailov B, Mosley AL, Sardiu ME, Coleman MK, Florens L, Washburn MP. 2006a. Statistical Analysis of Membrane Proteome Expression Changes in Saccharomyces cerevisiae. Journal of proteome research. 5: 2339-2347.
- Zybailov B, Mosley AL, Sardiu ME, Coleman MK, Florens L, Washburn MP. 2006b. Statistical analysis of membrane proteome expression changes in Saccharomyces cerevisiae. Journal of proteome research. 5: 2339-2347.


