Abstract
Leafspot is one of the major diseases of peanut (Arachis hypogaea L.) that can cause more than 50% yield loss. The objective of this study was to identify and map quantitative trait loci (QTLs) for resistance to leafspot disease. An F2:6 recombinant inbred line (RIL) population, derived from a released cultivar Tamrun OL07 and a highly tolerant breeding line Tx964117, were used as a mapping population. A total of 90 RILs were planted for disease phenotyping in Yoakum, Texas in 2010 and 2012. A genetic map spanning the 20 linkage groups was developed using 1,211 SNP markers based on double digest restriction-site associated DNA sequencing (ddRAD-seq). A total of six quantitative trait loci (QTLs) were identified, with LOD score values of 3.2–5.0 and phenotypic variance explained ranging from 11%–24%. Major QTLs identified in this study may be used as potential targets for peanut improvement to leafspot disease through molecular breeding.
-
Key words: Peanut (Arachis hypogaea L.), Groundnut, Leafspot disease, QTL mapping
INTRODUCTION
The foliar disease leafspot, caused by
Cercospora arachidicola (early leafspot) or
Cercosporidium personatum (late leafspot), is one of the major diseases of peanut across the world, which can cause 50% or more yield losses in peanut production (
Subrahmanyam et al. 1984). Chemical management such as fungicide spray is the most common method to control the prevalence of the diseases in the field. However, breeding an elite cultivar with resistance to these diseases would be a more sustainable solution.
Previous reports indicated that leafspot resistance is controlled by multiple genes (
Green and Wynne 1986) and several QTLs for tolerance to this disease identified using SSR markers have been reported in various RIL populations (
Khedikar et al. 2010;
Sujay et al. 2012;
Wang et al. 2013;
Sukruth et al. 2015). The objective of our current study is to precisely map QTLs conferring peanut leafspot resistance using high density sequence-based SNP marker genotyping by double digest restriction-site associated DNA sequencing (ddRAD-seq) (
Baird et al. 2008;
Peterson et al. 2012). A RIL population derived from a released cultivar, Tamrun 0L07, a runner type cultivar having high yield, high oleic to linoleic fatty acid ratio (O/L) with moderate resistance to tomato spotted wilt virus (TSWV) and Sclerotinia blight (
Baring et al. 2006), and a breeding line Tx964117, having high level of resistance to early and late leafspot but having average yield potential, poor percentage of total sound mature kernels (TSMK), normal O/L fatty acid ratio and low level of resistance to TSWV and Sclerotinia blight, were used for this study. Several major QTLs for resistance to leafspot detected in this study can be used as possible targets for future molecular breeding efforts to enhance leafspot resistance in peanut.
MATERIALS AND METHODS
Plant materials
A cross was made to transfer resistance for early and late leafspot into a high oleic multiple disease resistant cultivar. A high oleic released cultivar Tamrun OL07, with high yield potential and resistance for TSWV and Sclerotinia blight was used as the female parent, and breeding line Tx964117 which has resistance to early and late leafspot (unpublished data) was used as the male parent for this cross. A total of 90 F2 seeds derived from a single F1 individual were advanced in a greenhouse in College Station, Texas during 2007 to develop a RIL mapping population.
Field experiments and disease evaluation
Phenotyping was conducted in 2010 as F2:5 lines and 2012 as F2:6 lines in Yoakum, Texas. This experimental field station has an average of 21–35°C daytime temperature and 10.2 cm precipitation per month during May to October, the growing season for peanut in this region. Both experiments were conducted by randomized complete block design (RCBD) with three replications. Plots were 2-rows wide measuring 1.83 m wide by 3.05 m in length. Both parents were replicated five times as controls in each replication in both years.
The experimental field station in Yoakum has a history of both early and late leafspot and has been used as a leafspot screening nursery for over thirty years. Hence, leafspot screening was performed without any artificial inoculation. Plots were planted in late June and additional late evening irrigations were conducted during the last quarter of the growing season to make the environment more conducive for the development of the disease. The majority of symptoms were of early leaf spot and these were visually scored from 1–10 according to Florida scale for peanut leafspot (
Chiteka et al. 1988). Plots were rated at approximately 120 day after planting (DAP), and at harvest which was approximately 140 DAP. The final rating was used for the purpose of this study. Score 1 indicates no symptom, while score 10 indicates the plant is dead.
For DNA extraction, 90 RILs and the two parents were planted at the Borlaug Center greenhouse in Texas A&M University, College Station, Texas. DNA was extracted from 3–5 week-old peanut unexpanded leaves. A modified CTAB method was used to obtain high quality of DNA (
Doyle 1987), where 2% CTAB, 100 mM solid Tris, 700 mM NaCl, 20 mM EDTA, 0.9% sodium bisulfate, 4% polyvinylpyrrolidone (PVP-40) and 0.5% β-mercapto-ethanol were used. Prior to DNA library preparation, 4 μL RNase was added to each sample and incubated at room temperature for 1 hour. All DNA samples then were incubated in 65°C water bath to stop the RNase digestion.
Genotyping for the mapping population and both parents was performed using the next-generation sequence-based genotyping method, ddRAD-seq (
Peterson et al. 2012). Library preparation and sequencing were performed at the Genomic and Bioinformatics Service, Texas A&M AgriLife Research. Library preparation was performed according to
Peterson et al. (2012).
PstI and
MluCI restriction enzymes were used to prepare the libraries and Illumina HiSeq 2500v4 platform was used for sequencing.
Raw sequencing reads were first trimmed to remove low quality bases with quality score less than 20 on the ends of reads; then reads with 30% or more bases showing low quality score (Q<15) were removed. Two diploid wild type
A. duranensis and
A. ipaensis genomes were downloaded from PeanutBase (
https://peanutbase.org/) as genome A and B, respectively, to build a tetraploid reference genome. Reads were sorted by individual sample and aligned to reference genome using the Bowtie2 (
Langmead and Salzberg 2012) with default parameters for end-to-end mode. Local re-alignment was performed after aligning to reference using GATK if any Indels were occurred in the alignments. Low mapping quality reads with MQ less than 5 were removed. Single-nucleotide polymorphism was calling when there were polymorphisms between the two parents and minor allele frequency (MAF) greater than 0.05.
The genetic map was constructed by MSTMAP software (
Wu et al. 2008). First, SNP markers were assigned to chromosomes based on the mapping locations; then Kosambi mapping function was used for calculating recombinant frequency to genetic distance and RIL6 was set as the population type. To remove markers with high genotyping errors or miss-assign of chromosomes, the “no mapping distance threshold” was set at 15 and “no mapping size threshold” was set at 2, as suggested by the authors of MSTMAP.
Windows QTL cartographer 2.5 software (
Wang et al. 2012) was used to perform QTL analysis with Ri1 cross type (recombinant inbred line, derived by selfing). Interval mapping (IM) and composite interval mapping (CIM) were performed using Kosambi function. For CIM, forward and backward regression method was used with window size of 10 cM. Five markers were set for background control with F-in and F-out equal to 0.01 selection criteria. A LOD value of 3.0 was used as significant threshold to declare the QTL.
RESULTS
Disease severity in different years
Due to the significance of year effect in analysis of variance (ANOVA) for both leafspot diseases, the data were analyzed separately. The distributions of leafspot disease score were similar in 2010 and 2012, and the range was 2–8. Transgressive segregation was observed in both years, although it was more obvious in 2012 (
Fig. 1). Disease scores for the susceptible parent Tamrun OL07 were 6.8 and 6.9, in 2010 and 2012, respectively. On the other hand, the resistant parent Tx964117 disease scores were 4.3 and 4.1 in 2010 and 2012, respectively. In 2010, leafspot infection was mild, only 2 lines were identified with a disease score higher than 6. In contrast, 21 lines had leafspot disease scores higher than 6 in 2012. (
Fig. 1). The heritability of leafspot resistance was high in both years, which were 0.5 and 0.6, respectively (
Table 1).
A total of 260,445,423 reads were obtained from 90 F2:7 progenies, including ~10 million reads generated for each parent. After filtering, ~254 million reads were remained. Out of 9.9 million and 8.6 million quality-filtered reads from Tamrun OL07 and Tx964117, approximately 94.5% and 93.8% of reads, respectively, were aligned to the two Arachis reference genomes, A. duranensis and A. ipaensis. A total of 19,232 SNPs were screened between two parents. High quality SNPs markers were obtained based on two criteria: (1) SNPs with score <30 were removed; (2) SNPs with 10 or more missing data were removed. Based on these criteria, a total of 17,341 SNPs markers were called.
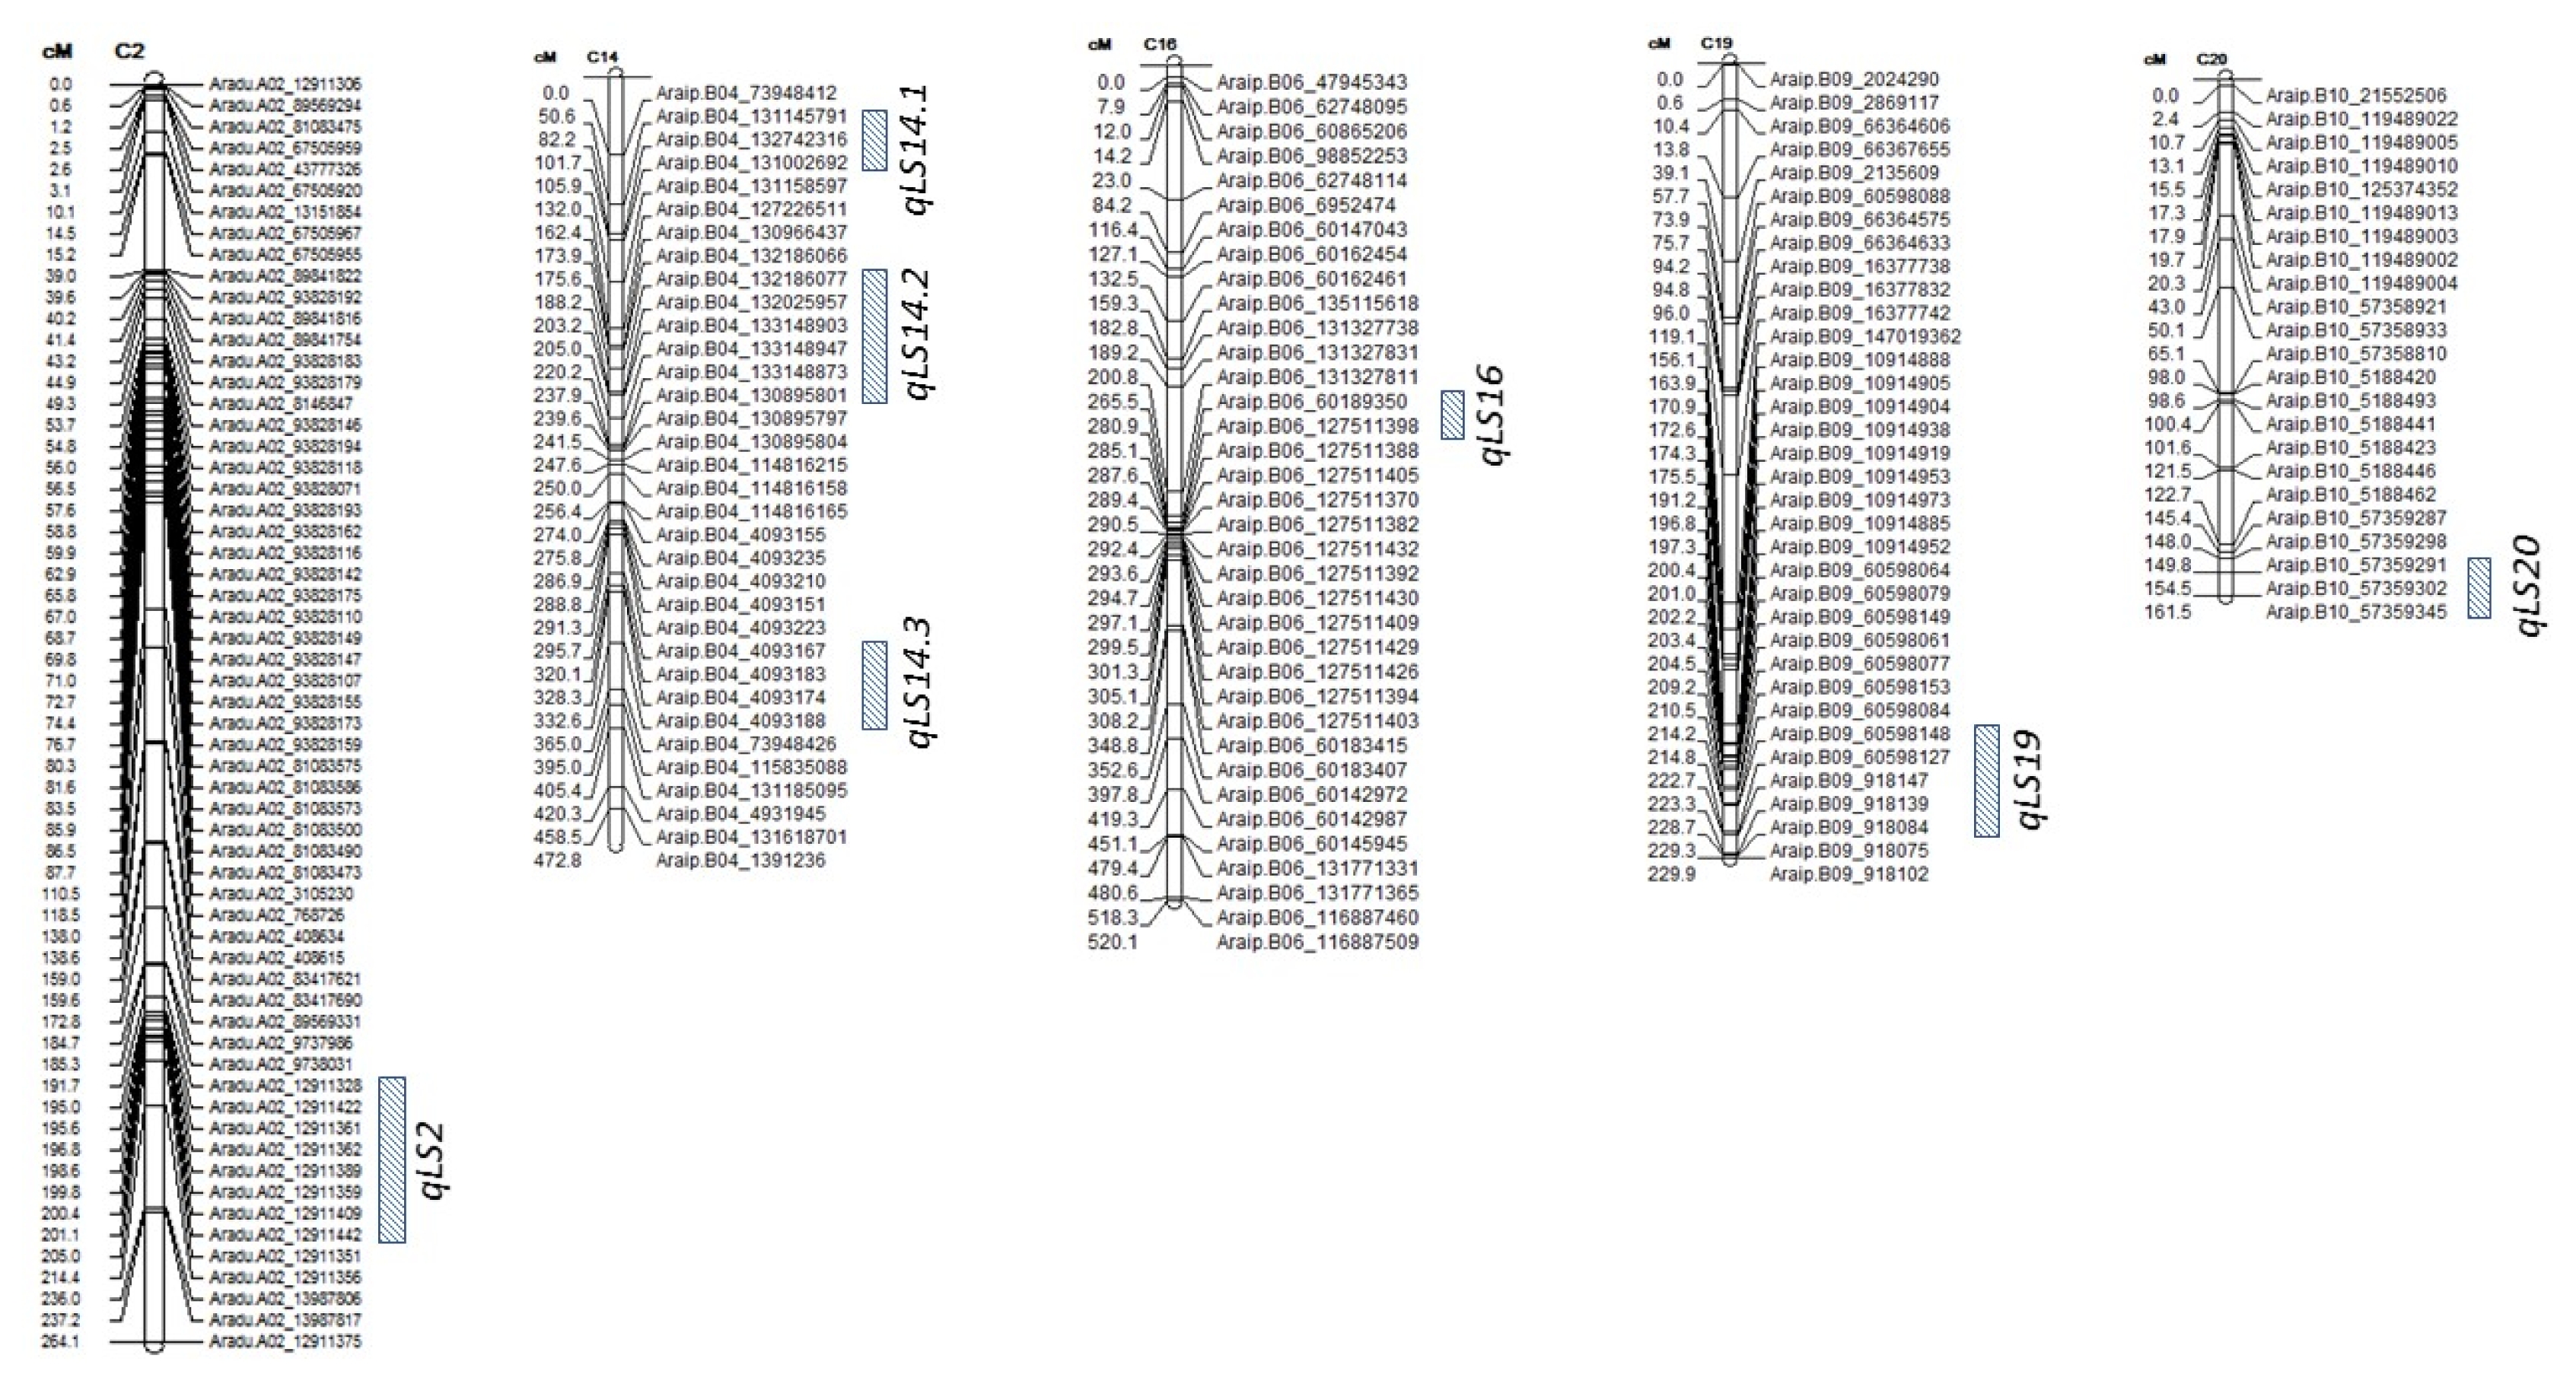
Twenty linkage groups were constructed using MSTMAP based on 5826 SNPs markers. Out of 5826 SNPs, 4595 SNPs were removed from the QTL analysis since they are located in the same genetic distance as other markers. After filtering, 1211 SNPs with unique genetic distances were used for the genetic map. The map covered 6,382 cM in twenty linkage groups. The average length of each linkage group was 319 cM with 5.18 cM average distance between two adjacent markers. For brevity, however, only linkage groups bearing QTLs were shown (
Fig. 2).
A total of six QTLs were detected above the threshold (LOD of 3.0) across 2010 and 2012 (
Table 2).
qLS14.2 was detected by both IM and CIM in both years, the highest LOD score value was 4.6, which was detected in 2012, and the phenotypic variance explained (R
2) of 19%, and the increased resistant allele came from the tolerant parent, Tx964117. Four other QTL were detected by CIM only. Two of the QTLs detected in 2010,
qLS2 and
qLS14.3, having LOD values of 5.0 and 4.0 and R
2 of 16% and 12%, respectively, and interestingly the increased resistant allele of both QTLs came from the susceptible parent, Tamrun OL07. On the other hand, of the other two QTLs detected in 2012, one of the QTLs,
qLS16, had the increased resistant allele from Tamrun OL07 (LOD = 3.7, R
2 = 11%), while the other,
qLS19, had its increased resistant allele derived from the tolerant parent, Tx964117 (LOD = 4.8, R
2 = 20%). Only one QTL was detected by IM only,
qLS14.1, and the increased resistant allele also came from tolerant parent Tx964117. This QTL was also detected in 2012 with LOD score value of 3.2 and R
2 of 24%, but it was under the threshold (LOD = 2.2, R
2 = 14%) in 2010. Additionally, there was a QTL,
qLS20, with increased resistant allele from Tx964117 detected by CIM in both years; however, it was slightly under the threshold with LOD values of 2.8 and 2.7 and R
2 values of 9% and 8% in 2010 and 2012, respectively (
Table 2).
DISCUSSION
SNP marker distribution
In total, 1,211 SNPs markers were used to construct the genetic map with 5.18 cM average distance between two adjacent markers. Our results showed that compared with the linkage maps developed using RFLP (
Burow et al. 2014), RAPD (
Mondal et al. 2014) and SSR markers (
Khedikar et al. 2010;
Sujay et al. 2012;
Wang et al. 2013), next-generation sequencing (NGS) based genotyping does significantly increase the marker density and mapping resolution. However, the marker density varies across regions, which may affect the resolution for the QTL detection.
The current study revealed six QTLs related to leafspot disease resistance with LOD values ranging from 3.2–5.0 and R
2 ranging from 11%–24% (
Table 2). The results indicate that the resistance of leafspot is controlled by both major and minor QTLs. This finding was similar to a previous QTL study reported by
Wang et al. (2013) in which the QTLs could explain 6–21% of the contribution to leafspot resistance. Additionally, one QTL,
qLS20 was detected in both years, but slightly under the threshold. Even though the size of our mapping population was sufficient to perform a QTL study, it was in the small side. Increasing the number of the RILs in the mapping population would increase the power of the QTL detection (
Vales et al. 2005;
Ferreira 2006) which could potentially increase the statistical significance of
qLS20. Considering that this QTL was detected in both years this QTL could be a stable QTL, albeit with a small effect.
Our results also indicated that the resistant alleles not only came from the resistant parent Tx964117, but also from Tamrun OL07. This phenomenon could contribute to the transgressive segregation observed in the mapping population (as seen in
Fig. 1). For example,
qLS2 and
qLS14.3, which were detected by CIM in 2010, had the allele for resistance from Tamrun OL07. Likewise,
qLS16 detected in 2012 possessed the resistant allele from Tamrun OL07 as well. This phenomenon, where the “good alleles” come from the “bad” parents is not uncommon in many QTL studies in different crops. An extreme example is the detection of a large-stable QTL for drought in rice, where the QTL for increased yield under drought,
qtl12.1, was derived from the susceptible parent, Way Rarem, suggesting an epistatic effect (
Bernier et al. 2007). Interestingly, in our study, all QTLs with increased resistant allele coming from the resistant parent Tx964117 were detected in both years, except for
qLS19, which indicates more stable QTLs which are desirable for marker-assisted breeding. However, other QTLs that were detected only in a single year, might be still useful in certain environments, although they might only be expressed by the triggers of a certain level of disease severity or specific environmental factors.
Three of the most resistant RILs (no. 7505, 7514, and 7532) and three of the most susceptible RILs (no. 7511, 7556, 7574) in both years were also further examined for their QTL allele combinations (
Table 3). The results showed that RILs that appeared to be resistant to leafspot possess more resistance alleles compared to their counterparts. This indicates that QTL pyramiding of several selected loci may potentially enhance resistance, as seen in many other crops, such as QTL pyramiding for bacterial leaf blight resistance in rice (
Huang et al. 1997). Interestingly, all the most tolerant and susceptible entries carry the tolerant allele of
qLS19, which is from Tx964117 (
Table 3). This may partly explain why the most susceptible entries were still more resistant than susceptible parent, especially in 2010.
Unfortunately, QTL comparisons with previous studies cannot be directly performed due to the different types of markers used and lack of information of the physical positions of the markers on the chromosomes. Nonetheless, selected major QTLs identified in this study can be further confirmed for their use in molecular breeding to enhance resistance to leafspot disease, as it was performed previously for other peanut diseases, such as root-knot nematode and rust resistance (
Burow et al. 2014;
Varshney et al. 2014). Transferring one or more of these QTLs to different genetic backgrounds and developing near-isogenic lines (NILs) will help validate the usefulness of these loci for future breeding programs.
ACKNOWLEDGEMENTS
We thank James Grichar, Dwayne Drozt, and Dr. Nithya Subramanian for technical assistance, and the team at the Genomics and Bioinformatics Service, Texas A&M AgriLife Research for genotyping assistance. The work reported here was supported in part by a grant from Texas A&M AgriLife Research, the Texas Peanut Producers Board, the National Peanut Board, and the National Institute of Food and Agriculture, U. S. Department of Agriculture, Hatch project 1009300.
Fig. 1Disease score of leafspot in Yoakum, Texas in 2010 and 2012. The score of disease ranges from 1–10. Score 1 indicates no symptom, while score 10 indicates the plant is dead.
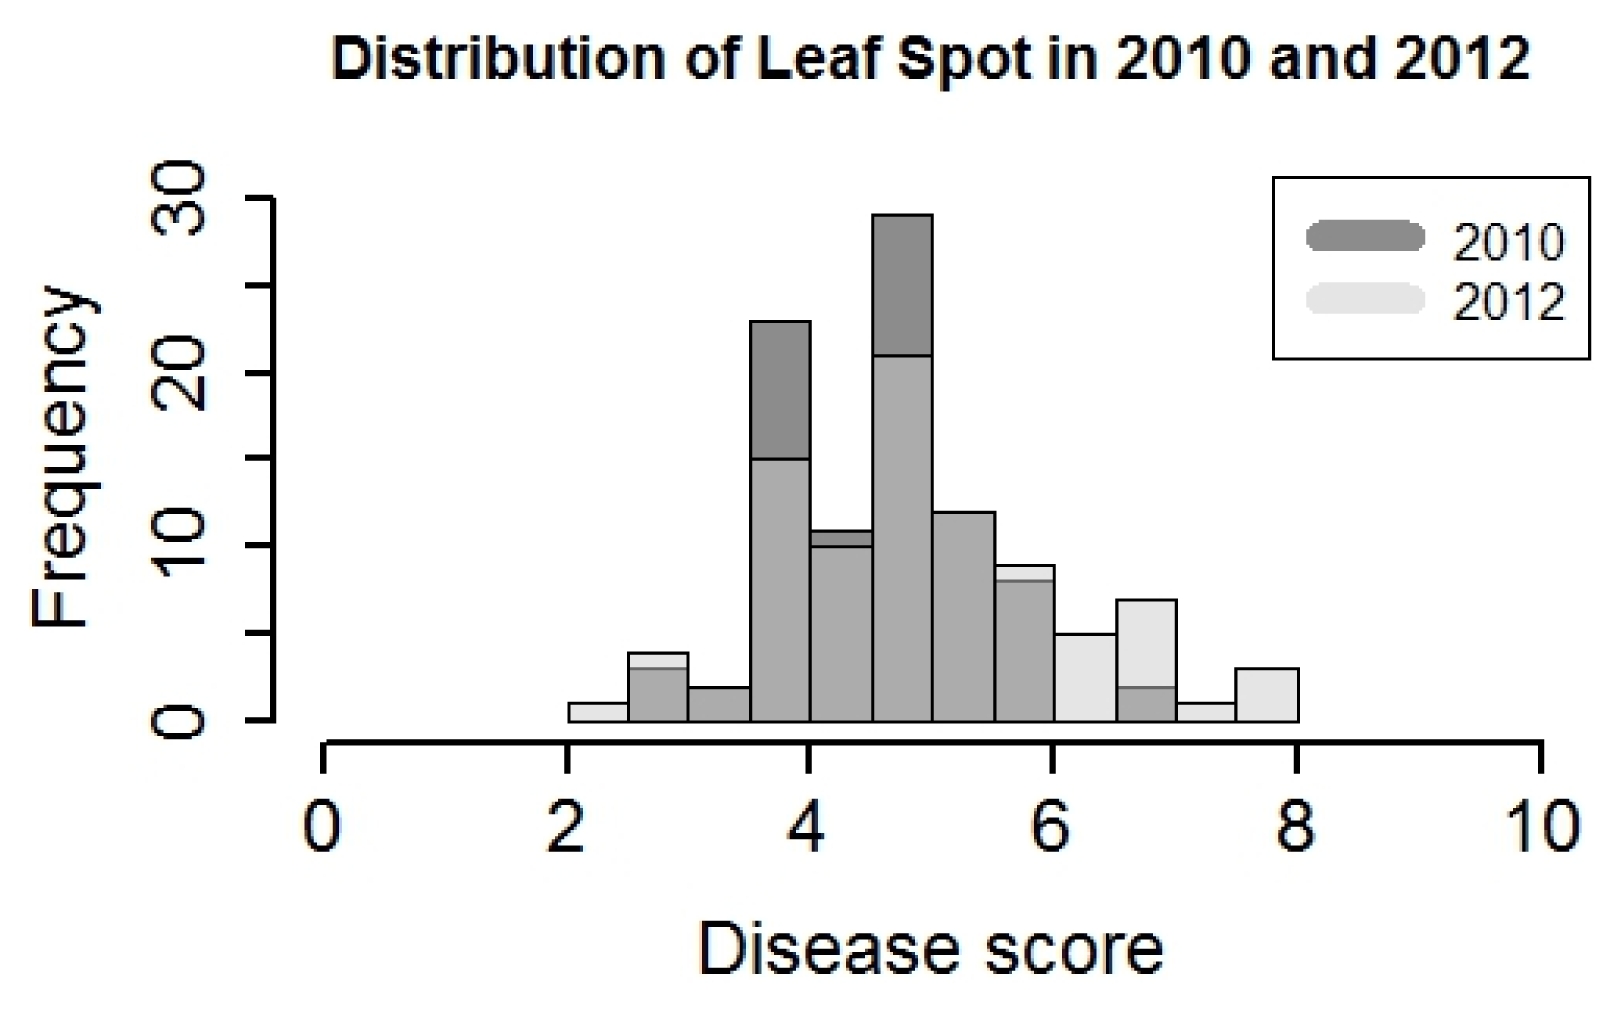
Fig. 2Linkage map of a RIL population derived from a cross between Tamrun OL07 and Tx964117 along with the positions of QTLs for leaf spot tolerance which are indicated by the bars.

Table 1Descriptive statistics for leafspot disease symptom scoring in the RIL mapping population in Yoakum Texas in 2010 and 2012.
Table 1
|
Year |
Range |
Mean |
SD |
CV (%) |
H2
|
|
2010 |
2.7–7.0 |
4.6 |
0.68 |
14.8 |
0.5 |
|
2012 |
2.3–8.0 |
5.0 |
0.91 |
18.2 |
0.6 |
Table 2QTL identified for leafspot disease resistance in the RIL mapping population in Yoakum, Texas in 2010 and 2012.
Table 2
|
Year |
QTL |
Chr. |
Flanking markers |
Marker closest to LOD peak |
Resistant Allelez)
|
IM |
CIM |
|
|
|
LOD |
Add. |
R2 (%) |
LOD |
Add. |
R2 (%) |
|
2010 |
qLS2
|
2 |
Aradu.A02_12911389
Aradu.A02_12911409 |
Aradu.A02_12911359 |
A |
|
|
|
5.0 |
−0.45 |
16 |
|
qLS14.1
|
14 |
Araip.B04_131145891
Araip.B04_130856881 |
Araip.B04_132742316 |
B |
2.2y)
|
0.31 |
14 |
|
|
|
|
qLS14.2
|
14 |
Araip.B04_133148952
Araip.B04_133148884 |
Araip.B04_133148947 |
B |
3.4 |
0.36 |
20 |
4.4 |
0.32 |
15 |
|
qLS14.3
|
14 |
Araip.B04_4093173
Araip.B04_4093186 |
Araip.B04_4093183 |
A |
|
|
|
4.0 |
−0.3 |
12 |
|
qLS20
|
20 |
Araip.B10_57359291
Araip.B10_57359345 |
Araip.B10_57359302 |
B |
|
|
|
2.8
|
0.26 |
9 |
|
|
2012 |
qLS14.1
|
14 |
Araip.B04_131145891
Araip.B04_130856881 |
Araip.B04_132742316 |
B |
3.2 |
0.62 |
24 |
|
|
|
|
qLS14.2
|
14 |
Araip.B04_132025957
Araip.B04_133148903 |
Araip.B04_132025906 |
B |
3.5 |
0.57 |
23 |
4.6 |
0.53 |
19 |
|
qLS16
|
16 |
Araip.B06_60189350
Araip.B06_127511398 |
Araip.B06_127511362 |
A |
|
|
|
3.7 |
−0.46 |
11 |
|
qLS19
|
19 |
Araip.B09_60598148
Araip.B09_918147 |
Araip.B09_60598127 |
B |
|
|
|
4.8 |
0.66 |
20 |
|
qLS20
|
20 |
Araip.B10_57359291
Araip.B10_57359345 |
Araip.B10_57359302 |
B |
|
|
|
2.7
|
0.36 |
8 |
Table 3Allelic combination of leafspot resistant QTLs for three of the most resistant and the most susceptible entries.
Table 3
|
Entry |
Disease score |
qLS2z) (2010) |
qLS14.1 (2010, 2012) |
qLS14.2 (2010, 2012) |
qLS14.3 (2012) |
qLS16 (2012) |
qLS19 (2012) |
qLS20 (2010, 2012) |
|
|
2010 |
2012 |
|
7505 |
2.7 |
2.3 |
+ |
+ |
+ |
+ |
− |
+ |
− |
|
7514 |
3.3 |
3 |
+ |
+ |
+ |
+ |
− |
+ |
− |
|
7532 |
3 |
4 |
+ |
+ |
+ |
+ |
+ |
+ |
− |
|
7511 |
6 |
8 |
? |
− |
+ |
+ |
− |
+ |
− |
|
7556 |
6 |
7 |
− |
+ |
+ |
− |
− |
+ |
− |
|
7574 |
6.7 |
6.3 |
− |
− |
− |
− |
− |
+ |
− |
References
- Baird NA, Etter PD, Atwood TS, Currey MC, Shiver AL, Lewis ZA, et al. 2008. Rapid SNP discovery and genetic mapping using sequenced RAD markers. PLoS One. 3: e3376
- Baring MR, Simpson CE, Burow MD, Black MC, Cason JM, Ayers J, Lopez Y, Melouk HA. 2006. Registration of ‘Tamrun OL07’ Peanut. Crop Sci. 46: 2721-2722.
- Bernier J, Kumar A, Ramaiah V, Spaner D, Atlin G. 2007. A large-effect QTL for grain yield under Rreproductive-stage drought stress in upland rice. Crop Sci. 47: 507-516.
- Burow MD, Starr JL, Park CH, Simpson CE, Paterson AH. 2014. Introgression of homeologous quantitative trait loci (QTLs) for resistance to the root-knot nematode [Meloidogyne arenaria (Neal) Chitwood] in an advanced backcross-QTL population of peanut (Arachis hypogaea L.). Mol Breed. 34: 393-406.
- Chiteka ZA, Gorbet DW, Shokes FM, Kucharek TA, Knauft DA. 1988. Components of resistance to late leafspot in peanut. I. Levels and variability-Implications for selection. Peanut Sci. 15: 25-30.
- Doyle JJ. 1987. A rapid DNA isolation procedure for small quantities of fresh leaf tissue. Phytochem Bull. 19: 11-15.
- Ferreira A, da Silva MF, da Costa e Silva L, Cruz CD. 2006. Estimating the effects of population size and type on the accuracy of genetic maps. Genet Mol Biol. 29: 187-192.
- Foncéka D, Hodo-Abalo T, Rivallan R, Faye I, Sall MN, Ndoye O, et al. 2009. Genetic mapping of wild introgressions into cultivated peanut: a way toward enlarging the genetic basis of a recent allotetraploid. BMC Plant Biol. 9: 103
- Green CC, Wynne JC. 1986. Diallel and generation means analyses for the components of resistance to Cercospora arachidicola in peanut. Theor Appl Genet. 73: 228-235.
- Hong Y, Chen X, Liang X, Liu H, Zhou G, Li S, et al. 2010. A SSR-based composite genetic linkage map for the cultivated peanut (Arachis hypogaea L.) genome. BMC Plant Biol. 10: 17
- Huang N, Angeles ER, Domingo J, Magpantay G, Singh S, Zhang G, et al. 1997. Pyramiding of bacterial blight resistance genes in rice: marker-assisted selection using RFLP and PCR. Theor Appl Genet. 95: 313-320.
- Khedikar YP, Gowda MVC, Sarvamangala C, Patgar KV, Upadhyaya HD, Varshney RK. 2010. A QTL study on late leaf spot and rust revealed one major QTL for molecular breeding for rust resistance in groundnut (Arachis hypogaea L.). Theor Appl Genet. 121: 971-984.
- Langmead B, Salzberg SL. 2012. Fast gapped-read alignment with Bowtie 2. Nat Meth. 9: 357-359.
- Mallikarjuna N, Varshney RK. 2014. Genetics, genomics and breeding of peanuts. CRC Press. New York.
- Mondal S, Hadapad AB, Hande PA, Badigannavar AM. 2014. Identification of quantitative trait loci for bruchid (Caryedon serratus Olivier) resistance components in cultivated groundnut (Arachis hypogaea L.). Mol Breed. 33: 961-973.
- Peterson BK, Weber JN, Kay EH, Fisher HS, Hoekstra HE. 2012. Double digest RADseq: An inexpensive method for de novo SNP discovery and genotyping in model and non-model species. PLoS One. 7: e37135
- Subrahmanyam P, Williams J, Mcdonald D, Gibbons R. 1984. The influence of foliar diseases and their control by selective fungicides on a range of groundnut (Arachis hypogaea L.) genotypes. Ann Appl Biol. 104: 467-476.
- Sujay V, Gowda MVC, Pandey MK, Bhat RS, Khedikar YP, Nadaf HL, et al. 2012. Quantitative trait locus analysis and construction of consensus genetic map for foliar disease resistance based on two recombinant inbred line populations in cultivated groundnut (Arachis hypogaea L.). Mol Breed. 30: 773-788.
- Sukruth M, Paratwagh SA, Sujay V, Kumari V, Gowda MVC, Nadaf HL, et al. 2015. Validation of markers linked to late leaf spot and rust resistance, and selection of superior genotypes among diverse recombinant inbred lines and backcross lines in peanut (Arachis hypogaea L.). Euphytica. 204: 343-351.
- Vales MI, Schön CC, Capettini F, Chen XM, Corey AE, Mather DE, et al. 2005. Effect of population size on the estimation of QTL: a test using resistance to barley stripe rust. Theor Appl Genet. 111: 1260-1270.
- Varshney RK, Pandey MK, Janila P, Nigam SN, Sudini H, Gowda MVC, et al. 2014. Marker-assisted introgression of a QTL region to improve rust resistance in three elite and popular varieties of peanut (Arachis hypogaea L.). Theor Appl Genet. 127: 1771-1781.
- Wang H, Pandey MK, Qiao L, Qin H, Culbreath AK, He G, et al. 2013. Genetic mapping and quantitative trait loci analysis for disease resistance using F2 and F5 generation-based genetic maps derived from ‘Tifrunner’ × ‘GT-C20’ in peanut. Plant Genome. 6: 3
- Wang S, Basten CJ, Zeng ZB. 2012. Windows QTL Cartographer V2.5_011. Program in Statistical Genetics, North Carolina State University. http://statgen.ncsu.edu/qtlcart/WQTLCart.htm
- Wu Y, Bhat PR, Close TJ, Lonardi S. 2008. Efficient and accurate construction of genetic linkage maps from the minimum spanning tree of a graph. PLoS Genet. 4: e1000212