Abstract
Sesame (Sesamum indicum L.) is the queen of oil seed crops and is cultivated widely in tropical and subtropical areas. The availability of the sesame genome sequence presents unprecedented opportunities for studying its genetics, genomics, and evolution. In this report, we conducted a genome resequencing-based identification of sesame orthologs; in total, 26,379 coding sequences (CDSs) were isolated. Using a reciprocal best hit, we ultimately identified a total of 639 orthologs sets after one-to-one orthologs extraction across seven Pentapetalae plant species. These orthologs were considered to be the most credible between the two species, and in sesame. Furthermore, we performed a branch model-based maximum likelihood estimation of dN/dS of the orthologs, resulting in the identification of 198 evolutionarily accelerated orthologs and 66 positively selected genes (P-value and FDR < 0.05). An enrichment analysis and protein interaction network suggested 19 genes with important functions of the orthologs specific in sesame development and domestication. The method we used here provides a case study for identifying orthologous genes between sesame and other plants species that are distributed in equilibrium phylogenetically, which can be used in other plants.
-
Key words: Sesame, Orthologs, Resequencing, dN/dS, Evolution
INTRODUCTION
Sesame (
Sesamum indicum L.) is one of the crop has been cultivated for the longest time by human and now wildly cultivated in tropical and subtropical zones (
Bedigian 2003). It is a diploid species with 13 pairs of chromosomes (2n = 2x = 26) (
Bremer et al. 2009), which belongs to the
Sesamum genus of the family
Pedaliaceae and the order
Lamiales. Sesame is called “queen of the oil seeds” because of the highest oil content (~55% in the seeds) among oilseed crops, including peanut, soybean, and rapeseed (
Anilakumar et al. 2010). Among the oilseed crops, sesame has a high oil content and a small diploid genome (~259.73 Mb) (
Wang et al. 2014;
Wang et al. 2016), making it an attractive species for genetic studies. Sesame is known to be the core lineage of
Sesamum in
Lamiales using phylogenetic analysis with chloroplast genome (
Yi and Kim 2012). It was estimated to have diverged from the
Lamiales species
Utricularia gibba ~98 million years ago, and from the tomato potato lineage ~125 MYA (
Wang et al. 2014).
Orthologs are homologous sequences that started to diverge through a speciation event (as with paralogs and duplication events). Consequently, the better we approximate the evolution of such sequences, the better ortholog predictions will be. In general, phylogenetic history can be parsed by examining nucleotide sequences, instead of amino acid sequences, and then separating non-synonymous substitutions (resulting in amino acid substitutions) from synonymous substitutions (silent or neutral substitutions). Selection pressure can be estimated by scaling the ratio of non-synonymous substitutions to synonymous substitutions to that expected with neutral divergence. This calculation is normalized as the number of non-synonymous substitutions per potential non-synonymous sites (dN) divided by the number of synonymous substitutions per potential synonymous sites (dS), referred to as dN/dS or Ka/Ks (
Hurst 2002). Extant proteins have been selected for optimal function over millions of years, the dN value of their genes becomes depressed; thus, dN/dS < 1 indicates “purifying” selection. When dN/dS = 1, the gene may be experiencing neutral selection. While dN/dS > 1, the gene may be undergoing “positive selection” resulting adaptive evolution, where amino acid replacements are advantageous and synonymous substitutions become stabilized at a high rate (
McPartland et al. 2007;
Dalloul et al. 2010). Positive selection of Embryophytes plants occurred in a wide variety of gene families with different functions, including in the self in-compatibility locus, in defense against pathogens, in embryogenesis, in cold acclimation, and in electron-transport (
Roth and Liberles 2006). In
Brassica juncea, 13 GSL-metabolism-related genes and 22 lipid-metabolism-related genes were differentially selected between the vegetable- and oil-use subvarieties of
B. juncea, which indicating that positive selection of some genes could be a major impact on plant domestication (
Yang et al. 2016). An
EID1 gene, responsible for a phase delay, has been under positive selection during tomato domestication or improvement (
Muller et al. 2016), revealing the key position of positively selected genes during the domestication.
In this study, we developed a detailed strategy (
Supplementary Fig. S1) using an evolutionary-based method to mine orthologs between different species from a genome resequencing project. Using this method, we identified orthologs in sesame, including five sesame accessions from a core set (RDA-Genebank, Republic of Korea) and several other plant species. Complemented with a branch model-based maximum likelihood estimation of dN/dS (
Kim et al. 2013;
Ahn et al. 2014) of the orthologs in these several species that were distributed in equilibrium phylogenetically, we identified evolutionarily accelerated genes in sesame. The methods in this study provide a case study for identifying orthologous genes in sesame and other plant species.
MATERIALS AND METHODS
Plant material and whole genome resequencing
Five sesame accessions (
Table 1) from a core set stored in National Genebank of the Rural Development Administration, Republic of Korea (RDA-Genebank) were selected for current study (
Park et al. 2014). We conducted a field experiment during the 2015 sesame growing season at Kongju National University experimental farm. Young leaves from a single plant were sampled and stored at −80°C prior to genomic DNA extraction using the DNeasy plant mini kit (Qiagen, Germany). At least 5 μg of genomic DNA was used for each accession to construct paired-end sequencing libraries with insert sizes of approximately 500 bp according to the manufacturer’s instructions (Illumina Inc., USA). We sequenced the genomes of the collected sesame varieties in deep coverage (~19.8×) on an Illumina HiSeq 2500 Sequencing System Platform (Illumina Inc., USA) with paired-end 2 × 100 bp read length.
Raw sequences were first trimmed using the SICKLE tool (
https://github.com/najoshi/sickle) to remove low-quality reads. Then, high-quality reads were aligned against the sesame reference genome (ver. 2.0) (
Wang et al. 2016) using the Burrows-Wheeler Aligner (BWA; ver. 0.7.5a) software (
Li and Durbin 2009). Reads that did not meet BWA quality criteria or did not match the reference genome were removed. PCR duplicate reads were also removed using PICARD tool (ver. 1.88;
http://broadinstitute.github.io/picard/). Applied with the Genome Analysis Toolkit (GATK; ver. 2.3.9 Lite) (
McKenna et al. 2010), regional realignment and quality score recalibration were first carried out and then single nucleotide polymorphisms (SNPs) and insertion/deletion polymorphisms (indels) were called with ≥ 3× of read depth coverage. Coding sequences (CDSs) of the five sesame core accessions were extracted, based on the annotations of the sesame reference genome using the variant call format (VCF) file generated from genotype calling of the five accessions.
A branch model-based phylogenetic tree was constructed with the TimeTree database (
Hedges et al. 2015), and several
Pentapetalae plant species (
Solanum tuberosum, Solanum lycopersicum, Populus trichocarpa, Brassica rapa, Arabidopsis thaliana, and
Vitis vinifera) that distributed in equilibrium phylogenetically with sesame were selected for comparison with
S. indicum. The coding sequences of
Solanum tuberosum were downloaded from NCBI (
http://www.ncbi.nlm.nih.gov) and the other six
Pentapetalae species were downloaded from Ensembl Plants (release 30;
http://plants.ensembl.org). Ortholog information for the other
Pentapetalae plants was also downloaded from BioMart of Ensembl Plants, satisfying orthologs confidence = 1. Since orthologous relationship between
S. tuberosum and other
Pentapetalae species had not been established, we performed a reciprocal best hits test between
S. indicum and
S. tuberosum, the closest species to
S. indicum among six
Pentapetalae species, using the options, E-value < 10
−5, 50 < coverage (%) < 150, and identity (%) > 60 (
Brudno et al. 2003;
Schwede et al. 2003;
Katoh et al. 2005).
To identify rapidly evolving genes in sesame, we conducted a branch model-based maximum likelihood estimation of dN/dS values among seven
Pentapetalae species, including
S. indicum. The coding sequences of all the seven
Pentapetalae species and the five accessions of
S. indicum were aligned using PRANK (ver. 150803) software (
Löytynoja and Goldman 2005), which is known for accurately align insertion and deletion (
Fletcher and Yang 2010). Poor alignments were eliminated using Gblocks (ver. 0.91b) (
Castresana 2000). Selected positive genes for
S. indicum and each of the five accessions were tested using a maximum likelihood estimation of dN/dS ratio with the phylogenetic tree (
Fig. 1) (
Yang 2007). Maximum likelihood estimations of dN/dS ratios were determined with branch-site model A with codon frequency F3x4 using PAML (ver. 4.8a) software (
Yang 2007). The log-likelihood ratio test was used for determining
P-values, and multiple testing errors were controlled using the false discovery rate (FDR).
All the identified evolutionarily accelerated genes were subjected to Gene Ontology (GO) enrichment, pathway, and network analyses. GO enrichment analyses were performed using AgriGO (
http://bioinfo.cau.edu.cn/agriGO/) with
Arabidopsis thaliana as the background species (
Du et al. 2010). The
P-values for the considered enrichment GO terms were < 0.05 and the minimum number of mapping entries was set to 5. Plant metabolic pathway enrichment analysis was carried out online using the Plant Gene Set Enrichment Analysis Toolkit (GSEA,
http://structuralbiology.cau.edu.cn/PlantGSEA/analysis.php), based on the corresponding genes in
A. thaliana (
Yi et al. 2013). Network analyses were also conducted for the genes by integrating with the Biological General Repository for Interaction Datasets (BioGRID,
http://thebiogrid.org/) (
Chatr-Aryamontri et al. 2015), which can provide genetic and protein interaction data from model organisms. Sesame orthologs were mapped onto interactome data using cross-reference tables assembled from identifiers of
A. thaliana and were displayed with Cytoscape software (
Shannon et al. 2003).
RESULTS
Whole-genome resequencing and genotype calling
We conducted resequencing of five core set accessions in this study and generated a total of 297.8 million reads (~42 Gb) (
Table 1). After removing low-quality reads, ~38 million clean reads were retained as high-quality data and were used for further analysis. About 80% of the clean reads of each accession were mapped to the sesame reference genome, resulting in an average genome coverage of ~19.8 (
Table 1). We performed genotype calling of the five accessions and, in total, ~1.96 million SNP/indels were identified (
Supplementary Table S1). Of them, ~86% (~1.69 million) were high-quality variations (sites without missing and heterozygotes). This suggested a large amount of high-quality data, resulting reliable results in the rest of the study. By complementing with the reference genome of sesame, and
vice versa, we could see more genetic variations across the sesame genome, which would promote genetic and genomic studies of sesame to be increasingly active. For example, in this study, with the high-depth resequencing and genotype calling data, ~1.69 million high-quality variations were generated across the genome. However, an uneven distribution of these SNPs/indels was observed across some chromosomes (
Supplementary Fig. S2). In contrast, several chromosomes with shorter lengths (chromosomes 1, 4, 5 and 13) had more SNPs/indels than the chromosomes with longer lengths (chromosomes 3, 6, 8, 9, and 10). This suggested that some genes in the chromosomes with high-density variations might play more important roles in the development and evolution of sesame.
Based on the annotation information of the sesame reference genome, we identified 26,379 CDSs in each of the five accessions among a total of 27,148 protein-encoding genes in the sesame reference genome. These CDSs were mined by mapping to the sesame reference genome with the positions of each gene CDS. In this way, all the SNPs/indels could be included in the CDS specific to each accession if some SNPs/indels existed specifically in one accession. To analyze genes of S. indicum by comparing orthologs with other species in a monophyletic group, the six Pentapetalae species were carefully selected to be distributed in equilibrium phylogenetically with S. indicum.
However, the orthologs among
S. indicum and the other six
Pentapetalae species have not been identified, whereas the orthologs between the other six
Pentapetale species were identified. Thus, we made entire orthologs including
S. indicum and the other six
Pentapetalae species by identifying orthologs between
S. indicum and its closest neighbor among the other six
Pentapetalae species,
S. tuberosum. The orthologs sets between
S. indicum and
S. tuberosum were identified by reciprocal best hits (RBH). Candidate orthologs of sesame were then intersected with the orthologs of the other six species, downloaded from BioMart of Ensembl Plants. As a result, 8,281 pair wise orthologs sets were identified between
S. indicum and
S. tuberosum. Finally, 639 orthologs sets remained after extracting one-to-one (1:1) ortholog sets across all seven
Pentapetalae species (
Supplementary Table S2). In present study, only 1:1 orthologs were used for further dN/dS tests. One-to-many, many-to-many, and many-to-one orthologs were excluded to eliminate influences from genes that were duplicated one or more times in an ancestor of the current or other species after a speciation event. The 1:1 ortholog relationship is used in many comparative genomics studies, especially in the identification of functional orthologs (
Bandyopadhyay et al. 2006); in evolutionary, comparative, and systematic studies in plants (
Wu et al. 2006); and the mapping of biological pathways (
Mao et al. 2006). We also used 1:1 orthologs which are suitable for comparative method based on proportion of functional changes (
Sabeti et al. 2006).
Clearly, it would be easier to identify orthologs between two species if the duplication history of the genes in the two genomes was known (relative to their speciation event). Unfortunately, this evolutionary process is unknown in many cases. Thus, to find the most probable 1:1 orthologs assignment between two genomes should to be carried out based on sequence similarity. When predefined orthologs sets of a species group exist without target species, the strategy that identify pairwise orthologs between target species and its closest species in members of the predefined orthologs sets and construct whole orthologs sets had been used in genome project (
Dalloul et al. 2010).
Given the ortholog sets detected, we conducted a branch model-based maximum likelihood estimation of dN/dS in the seven species (total 12 accessions). Considering the insertion and deletion, PRANK was used to align the CDSs of all seven species. After removing poor alignments, 623 of 639 alignments remained. Under a phylogenetic model tree (
Fig. 1), which indicated the tested branches for adapted genes (overall branch of
S. indicum and each branch of each accession), we investigated the maximum likelihood estimation of dN/dS ratios with branch-site model A with codon frequency F3x4. In total, 198 evolutionarily accelerated orthologs were identified in
S. indicum, including the five accessions, using a maximum likelihood estimation of the dN/dS ratio (
Supplementary Table S3) with a value greater than 1. The difference in the maximum likelihood ratio was calculated as:
LR = 2 (ln ML (dN/dS = 1)/ln ML (dN/dS)).
LR was then compared against the χ
2 distribution with one degree of freedom to test whether the dN/dS ratio was significantly > 1. The significance level was set at 0.05. Genes that passed this test are reported as positively selected. After adjusting the threshold with a
P-value and FDR < 0.05, 66 positively selected genes were retained, and were used in further analyses.
Based on the sesame reference genome annotation, we mapped the 198 orthologs and 66 positively selected genes to the chromosomes of the sesame genome (
Fig. 2). The accelerated orthologs showed a relatively even distribution across the chromosomes, with 15, 11, 19, 21, 12, 23, 11, 17, 20, 10, 13, 21, and 5 orthologs assigned to chromosomes 1 to 13, respectively. Except chromosome 13, on which only positively selected genes were located, the other chromosomes contained both positively selected orthologs and other accelerated orthologs. The distribution of these accelerated orthologs across the genome suggested that the branch model method we used here was reliable and these genes may play important roles in the development and domestication of sesame.
We performed a functional GO enrichment test for the accelerated genes and found 126 GO terms in three categories (Biological Process, Molecular Function, and Cellular Component) with 19 have
P-values < 0.05. In these terms, the cytoplasmic part and cytoplasm in Cellular Components have highest numbers of genes (37 and 41, respectively), while the response to oxidative stress and DNA metabolic processes in Biological Processes only covered five genes (
Fig. 3A). However, for the Molecular Function category, no significant GO term was found (
Supplementary Table S4). Using the Plant Gene Set Enrichment Analysis web server, the genes were enriched to curated gene sets (including PlantCyc gene sets, Kyoto Encyclopedia of Genes and Genomes (KEGG) gene sets, Plant Ontology gene sets, and References collected gene sets). Except for six genes (SIN_1022276, SIN_1017317, SIN_1002603, SIN_1002195, SIN_1015149, and SIN_1004833) that did not map some gene sets, most of the other (~50) contributed to the Plant Ontology gene sets (
Supplementary Fig. S3). The genes were related to the development of plant sperm cells, cytoplasmic parts, stems, carpels, leaves, roots, and seeds, indicating the important roles of these accelerated genes in sesame or other plants.
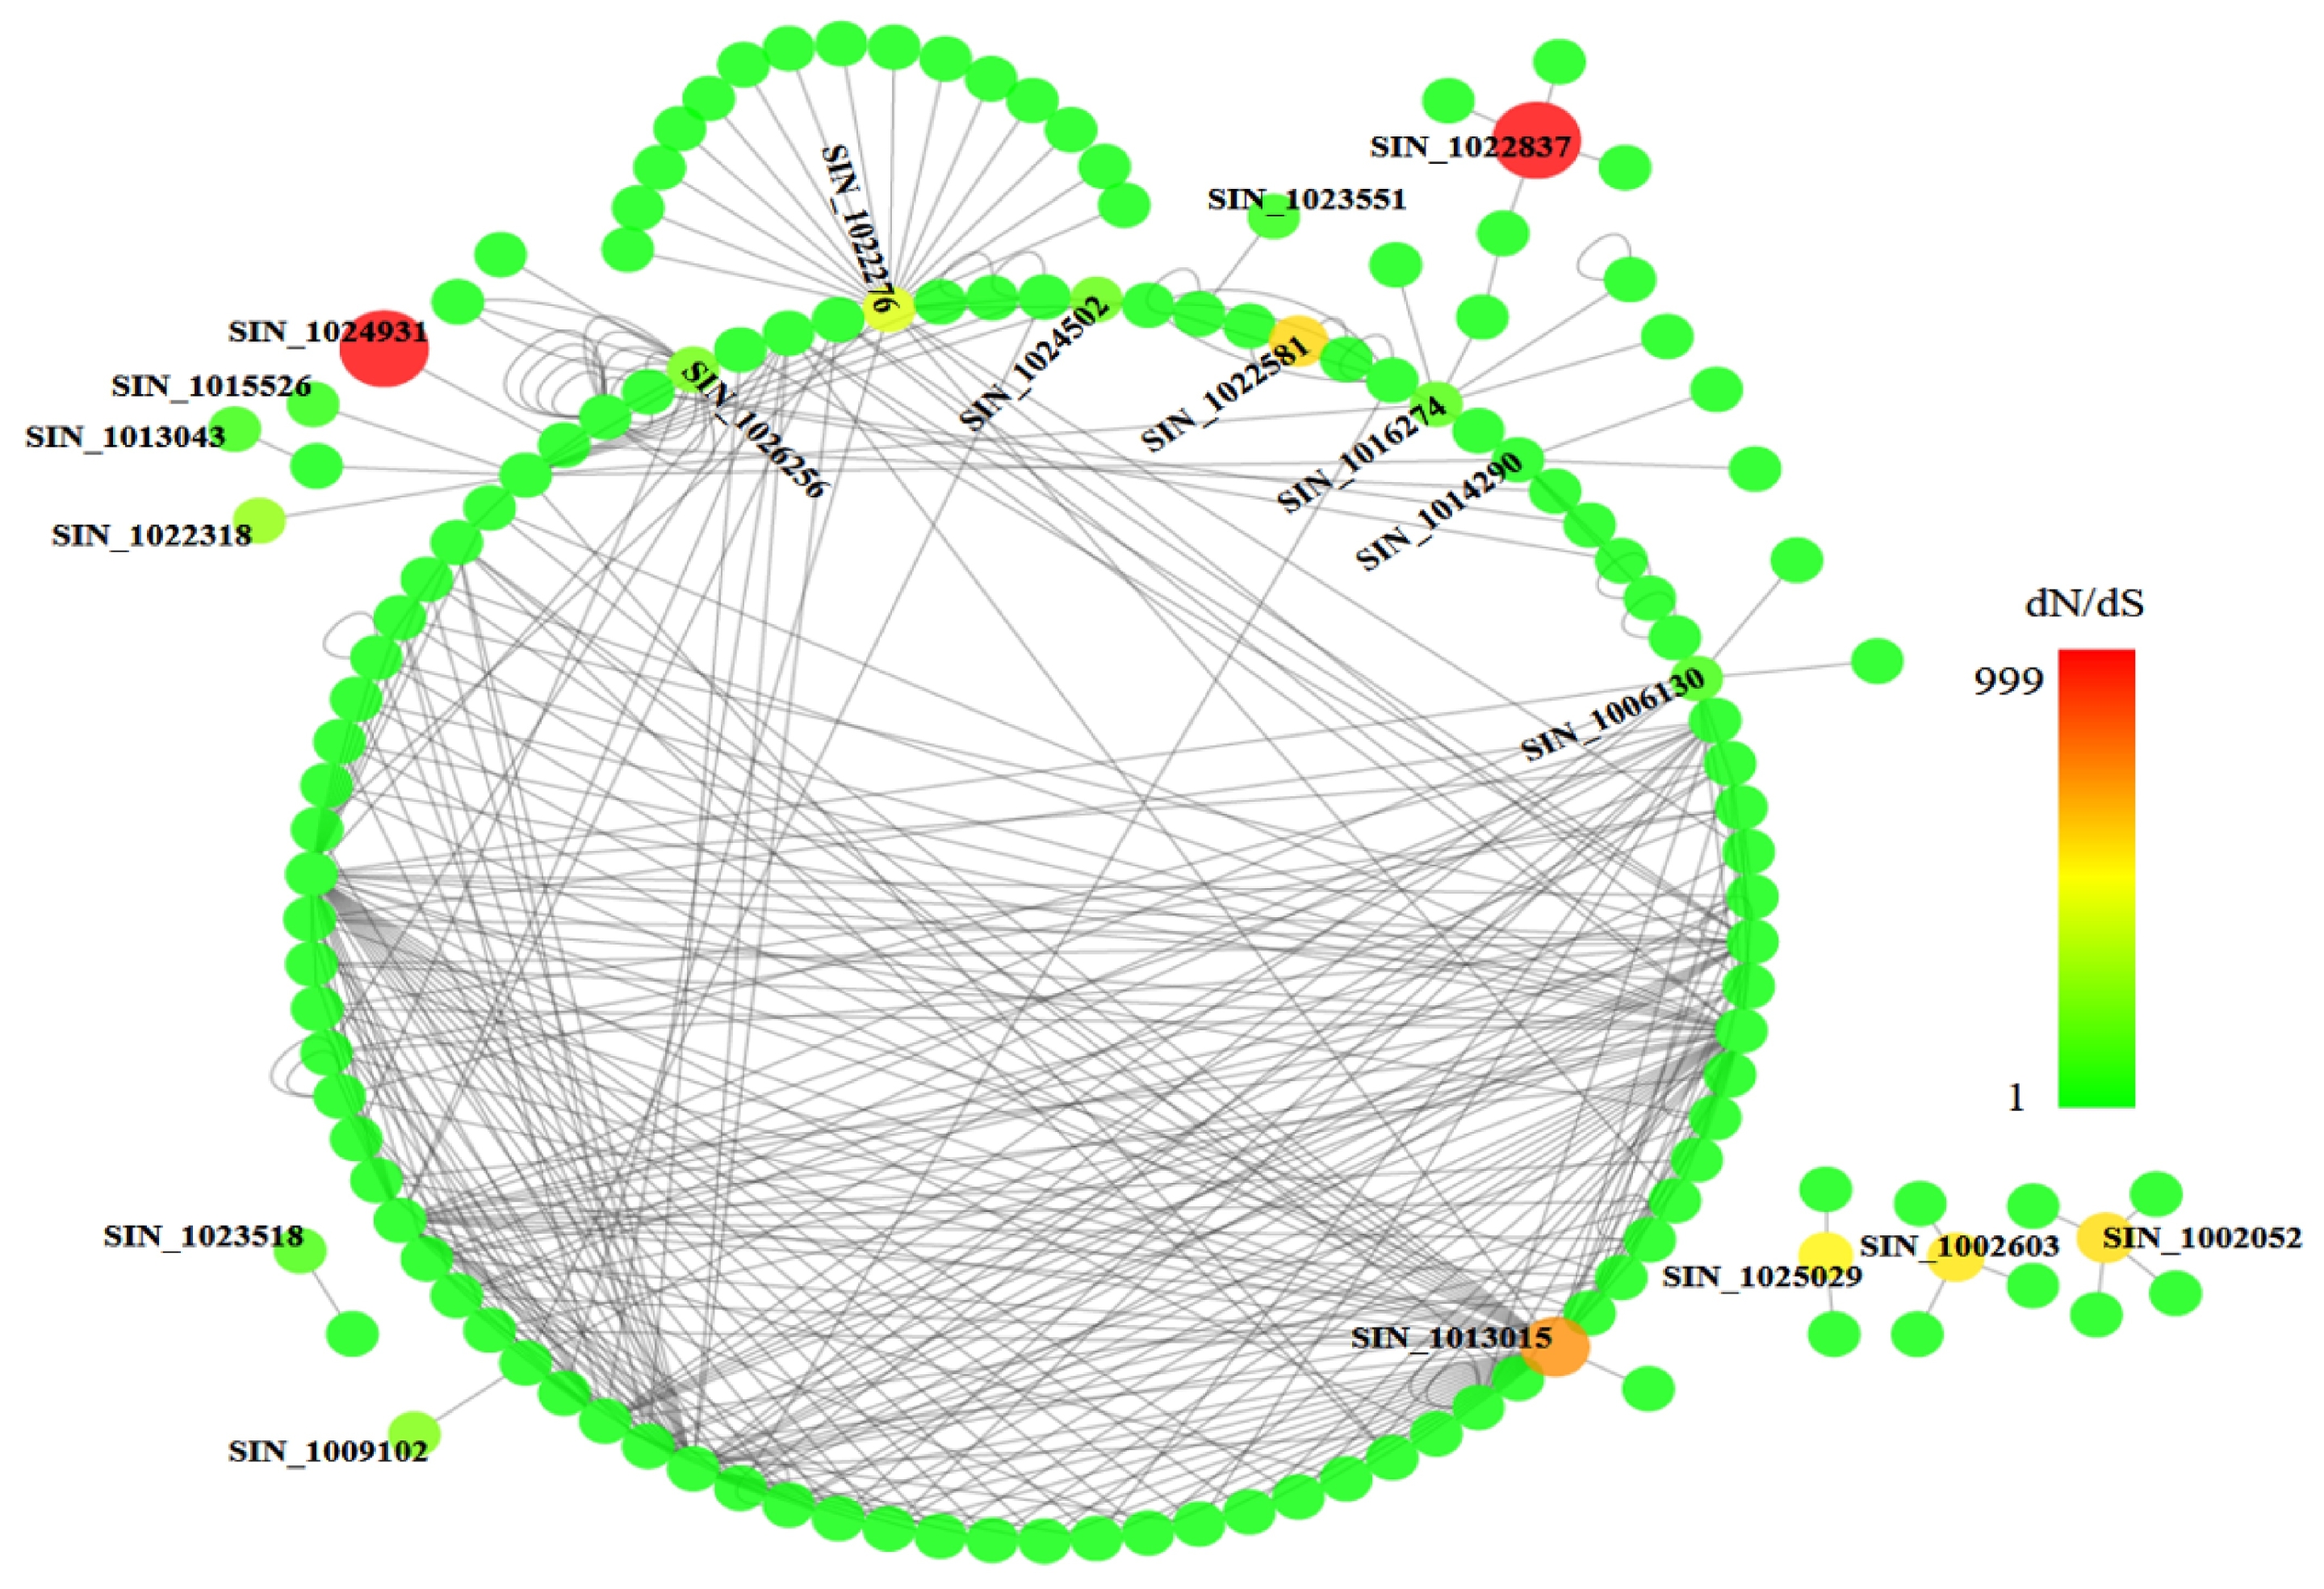
We then constructed a protein interaction network using the 66 positively selected genes as the nodes and protein-protein interaction data from the BioGRID database (
http://thebiogrid.org/download.php) as the edges. The network contained 139 nodes and 400 edges, as visualized using Cytoscape with
A. thaliana as the reference. Colors from green to red indicating dN/dS values from low to high in the network and the 19 positively selected genes with dN/dS values > 1 were indicated in
Fig. 4. Detail information and annotation for these 19 genes are listed in
Table 2. Many putative functions were characterized among these genes, including zinc ion binding, response to stress, membrane related, transferase activity, cytokinin-activated signaling pathway, fatty acid biosynthetic process, oxidation-reduction process, and abscisic acid-activated signaling pathway. It indicated that these positively selected genes could play important roles in the domestication of sesame for its specific characteristics like drought tolerance and high oil content.
In addition, we also mapped these genes to KEGG pathways (
http://www.genome.jp/kegg/pathway.html). Apart from some regular pathways, we found one gene (SIN_1024502) that mapped to
Arabidopsis orthologs in fatty acid metabolism and fatty acid elongation, which was also highlighted in the network analysis, and may contribute to the fatty acid biosynthetic process and oxidation-reduction process in sesame. The gene SIN_1022581(AT3G15150,
AtMMS21), which encodes E3 SUMO-protein ligase, may regulates drought tolerance in
Arabidopsis thaliana (
Zhang et al. 2013) was also highlighted here. Since sesame usually has a relative high level of drought resistance, this gene could be contributed to drought in sesame and positively selected in the domestication. Another gene SIN_1026256, which is a ortholog of
Arabidopsis SLAC1 that associated with stomatal closure, was also likely responsible for the difference of drought tolerance (
Imai et al. 2015). The gene SIN_1002052 (AT5G08650), which is the homolog of translation factor GUF1, is critical for chloroplast protein synthesis under suboptimal conditions in
Arabidopsis thaliana (
Ji et al. 2012). Overall, these results suggested that the genes identified may play important roles in the development and domestication of sesame.
DISCUSSION
In this study, we used a branch model method to identify evolutionarily accelerated orthologs in sesame based on deep resequencing. In case of a shortage of gene annotation in sesame, we first assigned the 1:1 orthologs between sesame and six other Pentapetalae species that were distributed in equilibrium phylogenetically with S. indicum. In total, 639 1:1 orthologs were characterized, and 198 accelerated orthologs were identified after a branch model-based maximum likelihood estimation of dN/dS. Among these accelerated orthologs, 66 genes were positively selected under a significance level test. Functional enrichment of the positively selected genes using several methods suggested that these genes may play important roles in plant development during the sesame domestication. To our knowledge, this case study provides the example for orthologs identification in species that lack gene annotations.
Supplementary Information
ACKNOWLEDGEMENTS
This work was supported by the Ministry of Education of the Republic of Korea and the National Research Foundation of Korea (No. NRF-2014R1A1A2057073).
ACKNOWLEDGEMENTS
This work was supported by the Ministry of Education of the Republic of Korea and the National Research Foundation of Korea (No. NRF-2014R1A1A2057073).
Fig. 1Branch model phylogenetic tree of 7 Pentapetalae plants and 5 Sesamum indicum accessions for the evolution analysis. Numbers in the brackets indicating the tested branches for adapted genes, (1) is for Sesamum indicum and (2)–(7) are for each core accessions. The grey color indicating the species tree.
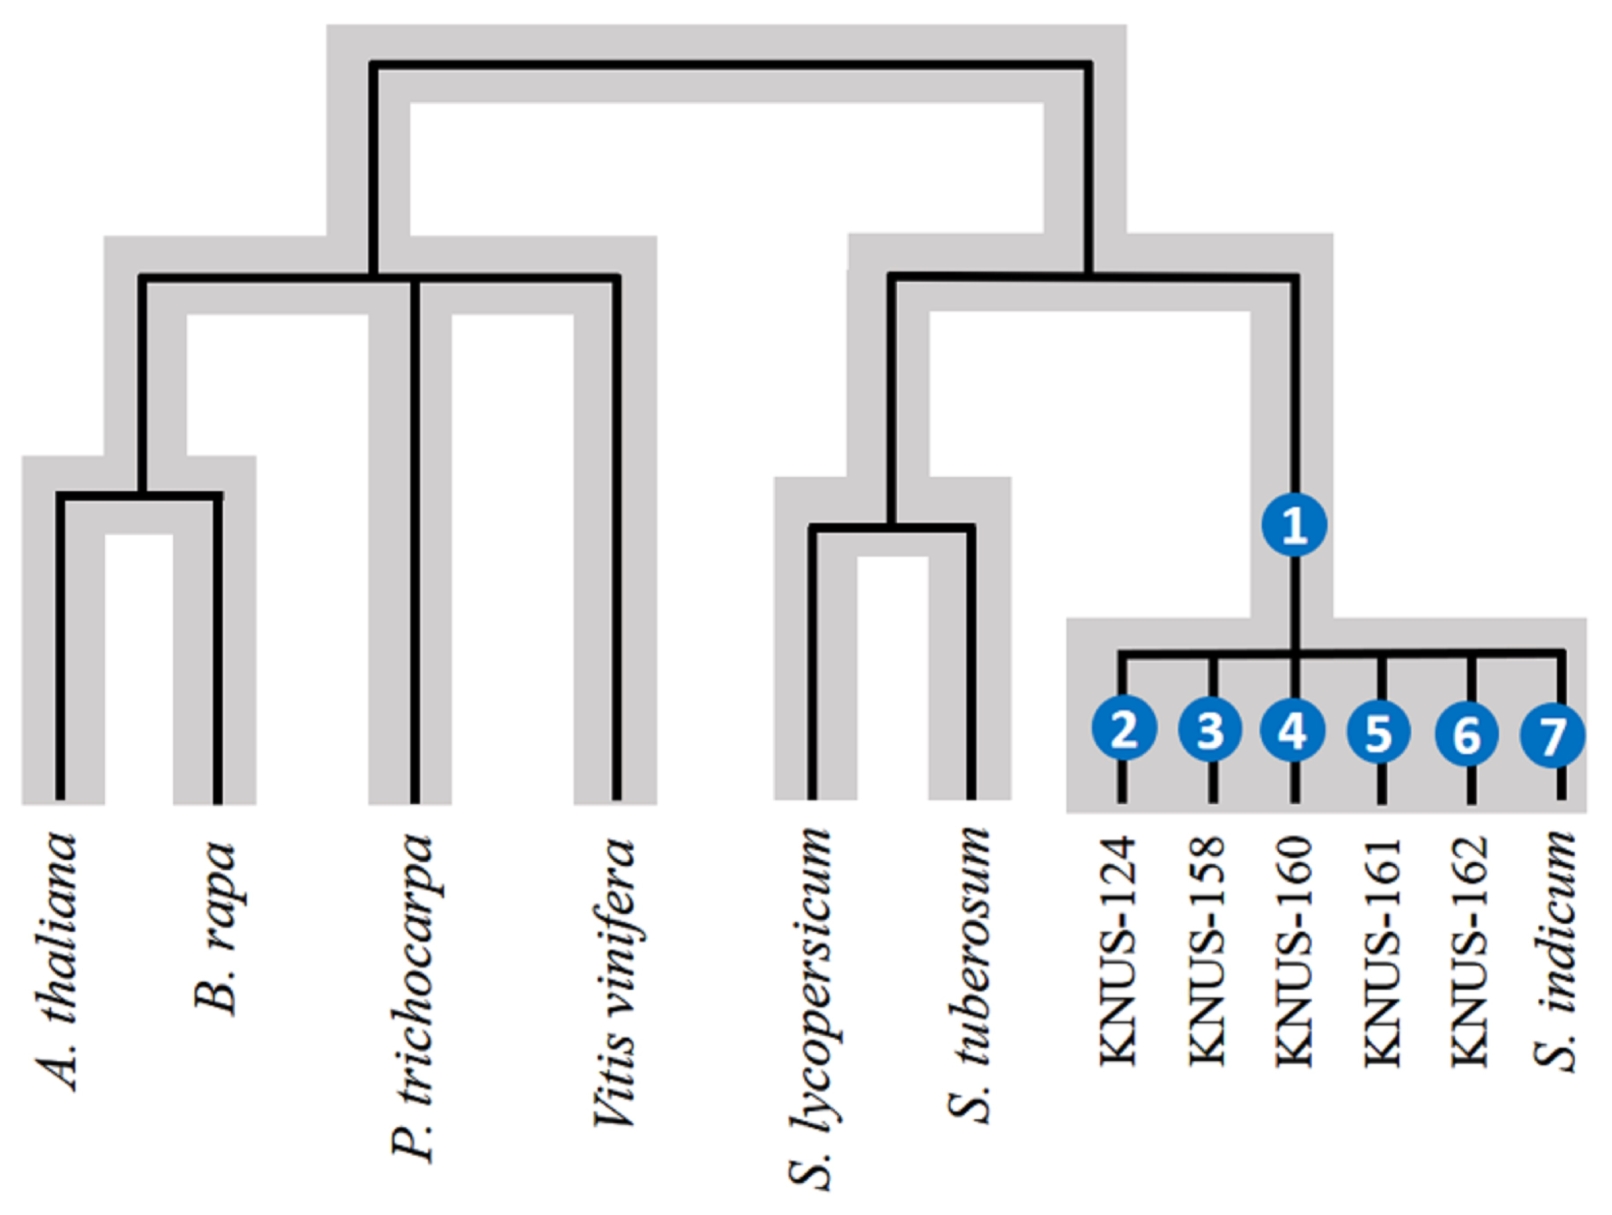
Fig. 2The location and distribution of all the accelerated orthologs and positively selected genes across the chromosomes of sesame. Each red or blue vertical bar represented one orthologs, and the red indicated the positively selected ones, and the blue indicated the other orthologs. LG01-LG13 represents the chromosomes, and the bold horizontal line indicates the length of each chromosome.
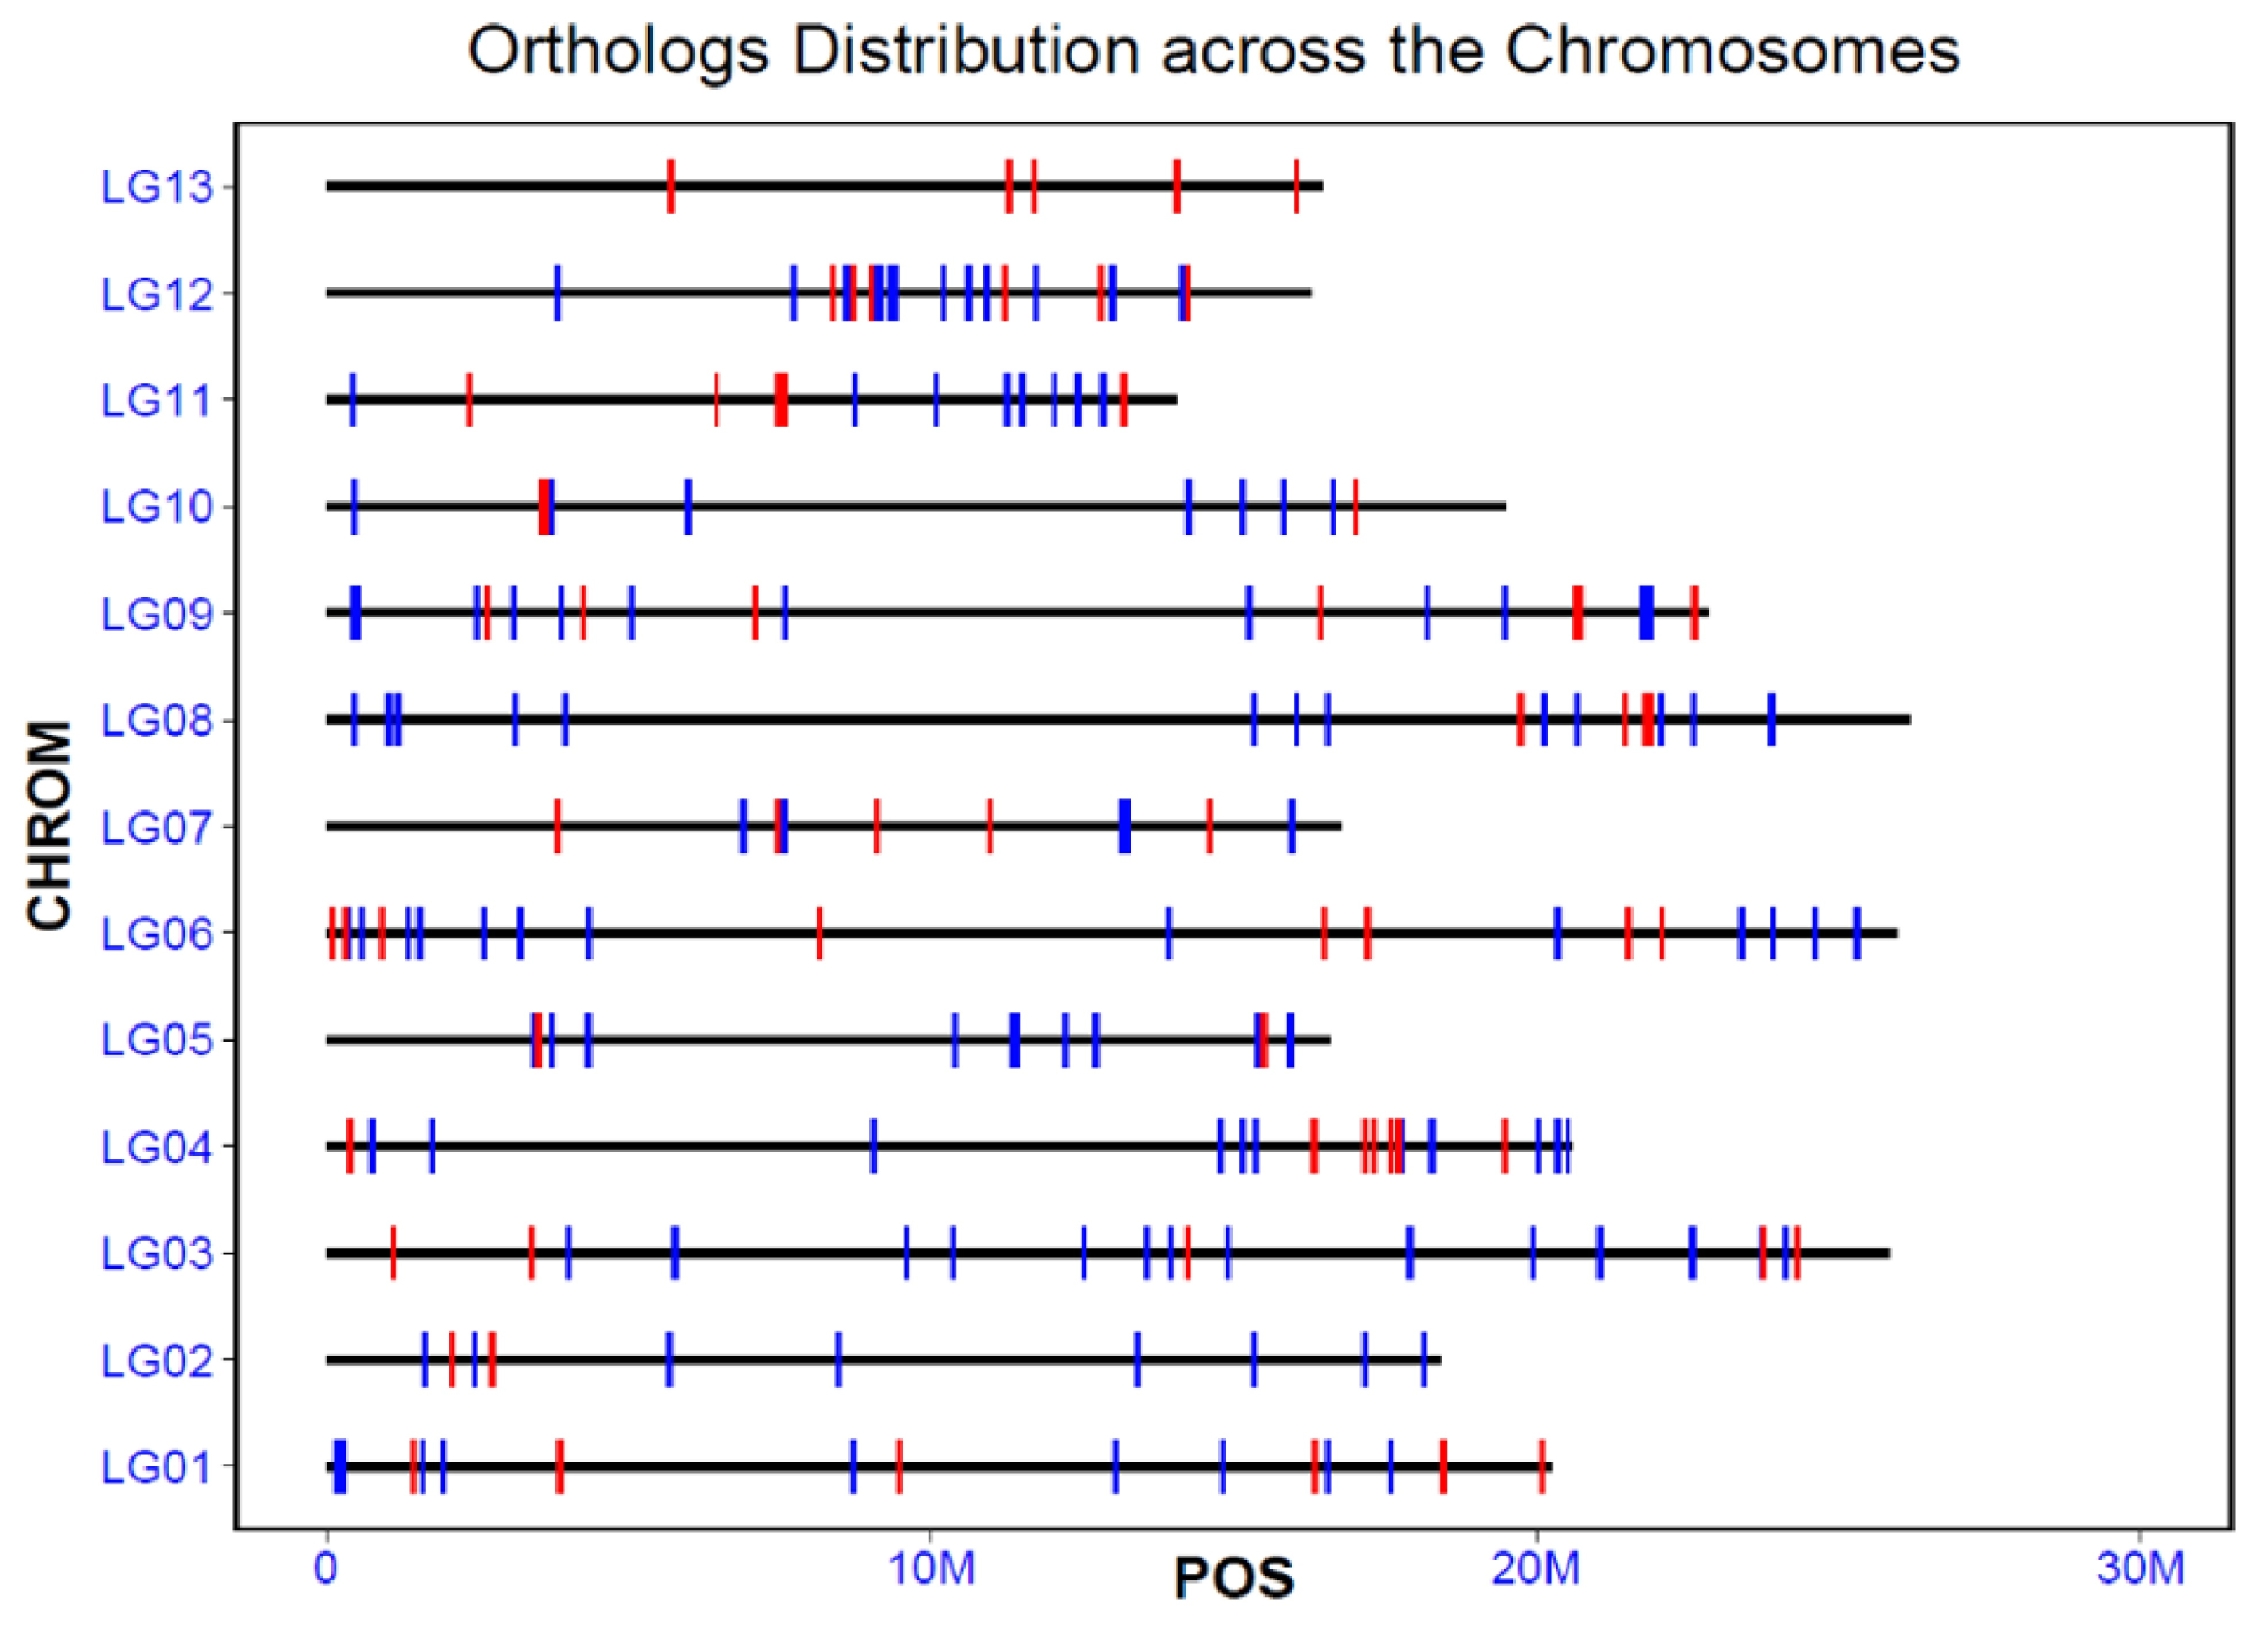
Fig. 3Functional enrichment analysis of positively selected orthologs. Yellow bar is accelerated selected genes, blue bar is the
Arabidopsis thaliana reference genome genes. GO enrichment analyses were performed using AgriGO (
http://bioinfo.cau.edu.cn/agriGO/) with
Arabidopsis thaliana as the background species.
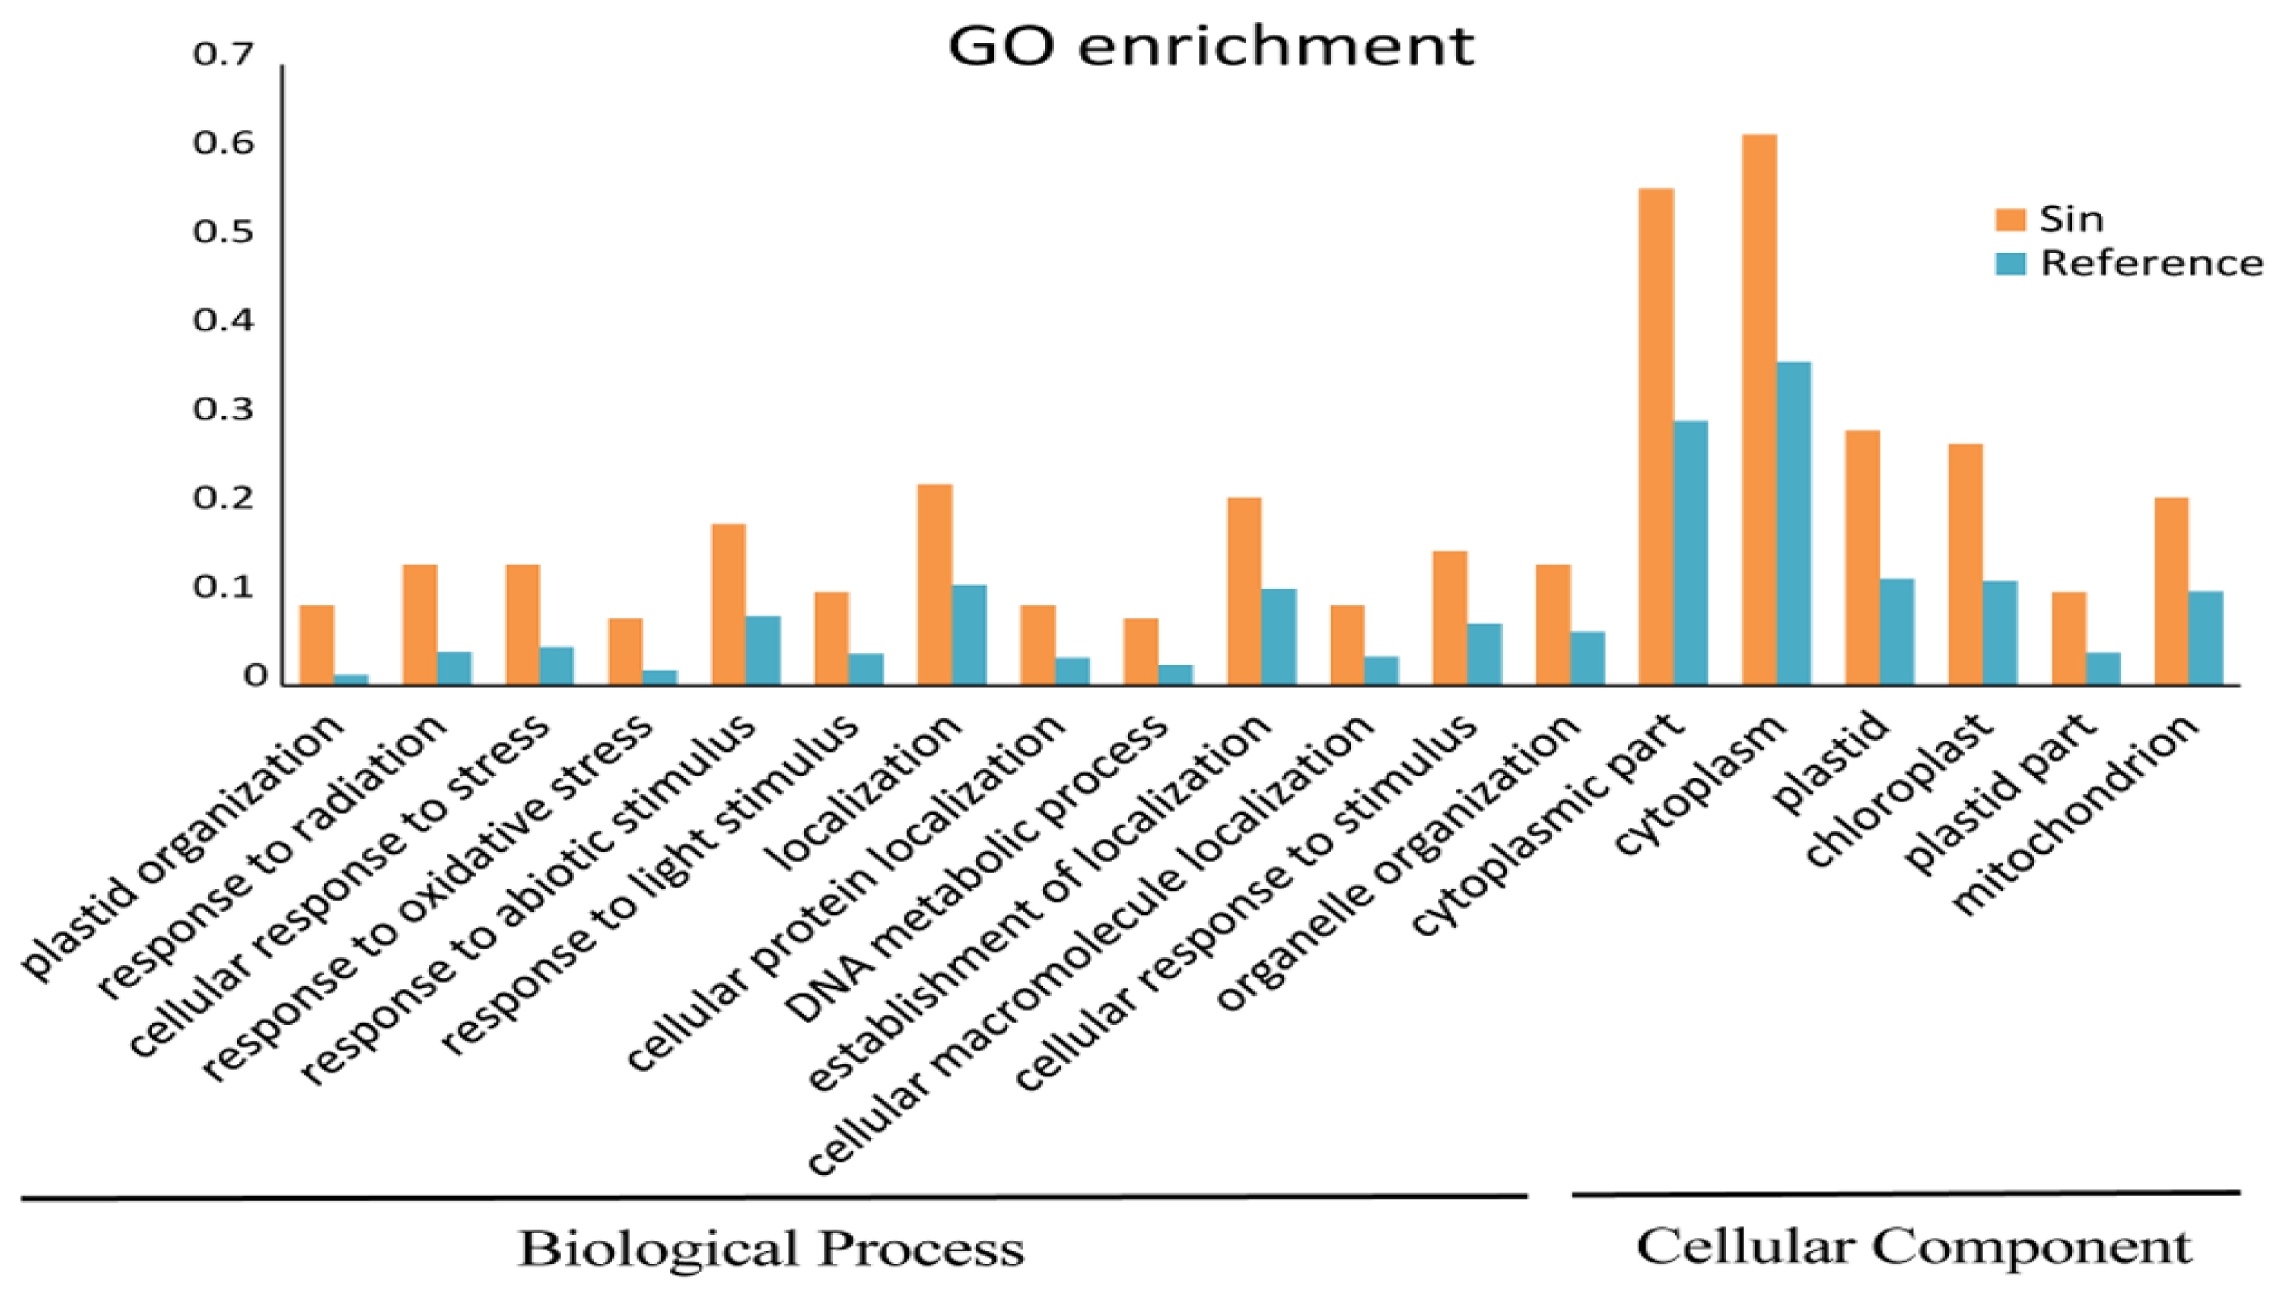
Fig. 4Cytoscape protein-protein interaction network of the positively selected genes using
Arabidopsis thaliana as reference (data from BioGRID). The color from green to red indicating the dN/dS value ranging from low to high. Total 19 positively selected genes that with dN/dS value more than 1 were marked and displayed in
Table 2.

Table 1Summary of the accessions and resequencing status based on the sesame reference genome.
Table 1
|
Accessions |
KNUS124 |
KNUS158 |
KNUS160 |
KNUS161 |
KNUS162 |
|
Name |
Heukseon |
SADOVO 1 |
Nevada |
Ansan |
Milsung |
|
Ecotypes |
S. indicum L. |
S. indicum L. |
S. indicum L. |
S. indicum L. |
S. indicum L. |
|
Origin |
Korea |
Korea |
Korea |
Korea |
Korea |
|
Flower color |
Light red |
Light red |
Pink |
White |
White |
|
Total raw reads |
51,928,276 |
68,070,228 |
60,951,160 |
53,119,468 |
63,775,198 |
|
Clean reads |
42,036,751 |
53,923,699 |
49,859,367 |
42,786,007 |
50,639,996 |
|
Mapped reads |
33,967,713 |
42,565,414 |
40,064,706 |
34,053,742 |
40,022,382 |
|
Mapping depth |
17.297 |
22.129 |
20.875 |
17.833 |
20.82 |
|
Mapping rate (%) |
80.8 |
78.94 |
80.36 |
79.59 |
79.03 |
Table 2Positively selected orthologs that were associated in the network analysis.
Table 2
|
Sesame |
A. thaliana
|
P-value |
FDR |
dN/dS |
Annotation |
|
SIN_1016274 |
AT4G15545 |
0.010602 |
0.035579 |
7.05644 |
Transmembrane transporter activity; integral component of membrane |
|
SIN_1013043 |
AT3G11460 |
0.00329 |
0.017394 |
4.79731 |
Zinc ion binding; mitochondrion; cytidine to uridine editing |
|
SIN_1022318 |
AT2G18760 |
0.005225 |
0.022633 |
13.07842 |
DNA or RNA binding; response to stress; cellular processes |
|
SIN_1006130 |
AT2G24220 |
3.49E-11 |
3.45E-09 |
5.48865 |
Purine nucleobase transport; integral component of membrane |
|
SIN_1014290 |
AT1G55740 |
1.53E-28 |
3.03E-26 |
1.12951 |
Carbohydrate metabolic processes; cytoplasm; hydrolase activity |
|
SIN_1023518 |
AT4G35910 |
0.000967 |
0.008707 |
6.29376 |
Transferase activity; lateral root formation; DNA or RNA binding; protein urmylation |
|
SIN_1015526 |
AT1G63660 |
0.008183 |
0.030544 |
3.61322 |
GMP synthase (glutamine-hydrolyzing) activity; ATP binding |
|
SIN_1024931 |
AT1G02160 |
0.000668 |
0.007786 |
999 |
Unknown molecular functions |
|
SIN_1022581 |
AT3G15150 |
1.62E-07 |
0.000008 |
182.0115 |
Cytokinin-activated signaling pathway; SUMO transferase activity; ligase activity |
|
SIN_1025029 |
AT2G44360 |
0.000897 |
0.008459 |
65.66277 |
Unknown molecular functions |
|
SIN_1013015 |
AT2G36305 |
0.000834 |
0.008256 |
464.5285 |
CAAX-box protein maturation; hydrolase activity |
|
SIN_1023551 |
AT3G13770 |
0.002761 |
0.017321 |
3.71444 |
Mitochondrion; zinc ion binding |
|
SIN_1024502 |
AT3G45770 |
0.003338 |
0.017394 |
8.71415 |
Fatty acid biosynthetic process; oxidation-reduction process |
|
SIN_1022837 |
AT2G02410 |
0.013785 |
0.042647 |
998.9973 |
Unknown molecular functions |
|
SIN_1009102 |
AT1G09850 |
0.002858 |
0.017321 |
11.21159 |
Extracellular; hydrolase activity |
|
SIN_1026256 |
AT1G12480 |
0.001418 |
0.010802 |
9.73025 |
Abscisic acid-activated signaling pathway |
|
SIN_1002052 |
AT5G08650 |
0.004158 |
0.020584 |
159.029 |
GTPase activity; nucleotide binding |
|
SIN_1022276 |
AT3G24660 |
0.011071 |
0.036536 |
19.87913 |
Protein serine/threonine kinase activity |
|
SIN_1002603 |
AT3G55760 |
0.003092 |
0.017394 |
126.5731 |
Chloroplast stroma |
References
- Ahn H, Kim K-W, Kim HJ, Cho S, Kim H. 2014. Differential Evolution between Monotocous and Polytocous Species. Asian-australas. J Anim Sci. 27: 464-470.
- Anilakumar KR, Pal A, Khanum F, Bawa AS. 2010. Nutritional, medicinal and industrial uses of sesame (Sesamum indicum L.) seeds-an overview. Agriculturae Conspectus Scientificus (ACS). 75: 159-168.
- Bandyopadhyay S, Sharan R, Ideker T. 2006. Systematic identification of functional orthologs based on protein network comparison. Genome Res. 16: 428-435.
- Bedigian D. 2003. Evolution of sesame revisited: domestication, diversity and prospects. Genet Resour Crop Evol. 50: 779-787.
- Bremer B, Bremer K, Chase M, Fay M, Reveal J, Soltis D, et al. 2009. An update of the Angiosperm Phylogeny Group classification for the orders and families of flowering plants: APG III. Bot J Linn Soc. 161: 105-121.
- Brudno M, Do CB, Cooper GM, Kim MF, Davydov E, et al. NISC Comparative Sequencing Program2003. LAGAN and Multi-LAGAN: efficient tools for large-scale multiple alignment of genomic DNA. Genome Res. 13: 721-731.
- Castresana J. 2000. Selection of conserved blocks from multiple alignments for their use in phylogenetic analysis. Molr Biol Evol. 17: 540-552.
- Chatr-Aryamontri A, Breitkreutz B-J, Oughtred R, Boucher L, Heinicke S, Chen D, et al. 2015. The BioGRID interaction database: 2015 update. Nucleic Acids Res. 43: D470-D478.
- Dalloul RA, Long JA, Zimin AV, Aslam L, Beal K, Blomberg LA, et al. 2010. Multi-platform next-generation sequencing of the domestic turkey (Meleagris gallopavo): genome assembly and analysis. PLoS Biol. 8: e1000475
- Du Z, Zhou X, Ling Y, Zhang Z, Su Z. 2010. agriGO: a GO analysis toolkit for the agricultural community. Nucleic Acids Res. 38: W64-W70.
- Fletcher W, Yang Z. 2010. The effect of insertions, deletions, and alignment errors on the branch-site test of positive selection. Mol Biol Evol. 27: 2257-2267.
- Hedges SB, Marin J, Suleski M, Paymer M, Kumar S. 2015. Tree of life reveals clock-like speciation and diversification. Mol Biol Evol. 32: 835-845.
- Hurst LD. 2002. The Ka/Ks ratio: diagnosing the form of sequence evolution. Trends Genet. 18: 486
- Imai H, Noda Y, Tamaoki M. 2015. Alteration of Arabidopsis SLAC1 promoter and its association with natural variation in drought tolerance. Plant Signal Behav. 10: e989761
- Ji DL, Lin H, Chi W, Zhang LX. 2012. CpLEPA is critical for chloroplast protein synthesis under suboptimal conditions in Arabidopsis thaliana. PLoS One. 7: e49746
- Katoh K, Kuma K, Toh H, Miyata T. 2005. MAFFT version 5: improvement in accuracy of multiple sequence alignment. Nucleic Acids Res. 33: 511-518.
- Kim KW, Burt DW, Kim H, Cho S. 2013. Identification of differentially evolved genes: an alternative approach to detection of accelerated molecular evolution from genome-wide comparative data. Evol Bioinform Online. 9: 285-299.
- Li H, Durbin R. 2009. Fast and accurate short read alignment with Burrows–Wheeler transform. Bioinformatics. 25: 1754-1760.
- Löytynoja A, Goldman N. 2005. An algorithm for progressive multiple alignment of sequences with insertions. Proc Natl Acad Sci USA. 102: 10557-10562.
- Mao F, Su Z, Olman V, Dam P, Liu Z, Xu Y. 2006. Mapping of orthologous genes in the context of biological pathways: An application of integer programming. Proc Natl Acad Sci USA. 103: 129-134.
- McKenna A, Hanna M, Banks E, Sivachenko A, Cibulskis K, Kernytsky A, et al. 2010. The Genome Analysis Toolkit: a MapReduce framework for analyzing next-generation DNA sequencing data. Genome Res. 20: 1297-1303.
- McPartland JM, Norris RW, Kilpatrick CW. 2007. Tempo and mode in the endocannaboinoid system. J Mol Evol. 65: 267-276.
- Muller NA, Wijnen CL, Srinivasan A, Ryngajllo M, Ofner I, Lin T, et al. 2016. Domestication selected for deceleration of the circadian clock in cultivated tomato. Nat Genet. 48: 89-93.
- Park JH, Suresh S, Cho GT, Choi NG, Baek HJ, Lee CW, et al. 2014. Assessment of molecular genetic diversity and population structure of sesame (Sesamum indicum L.) core collection accessions using simple sequence repeat markers. Plant Genet Resour. 12: 112-119.
- Roth C, Liberles DA. 2006. A systematic search for positive selection in higher plants (Embryophytes). BMC Plant Biol. 6: 12
- Sabeti PC, Schaffner SF, Fry B, Lohmueller J, Varilly P, Shamovsky O, et al. 2006. Positive natural selection in the human lineage. Science. 312: 1614-1620.
- Schwede T, Kopp J, Guex N, Peitsch MC. 2003. SWISS-MODEL: An automated protein homology-modeling server. Nucleic Acids Res. 31: 3381-3385.
- Shannon P, Markiel A, Ozier O, Baliga NS, Wang JT, Ramage D, et al. 2003. Cytoscape: a software environment for integrated models of biomolecular interaction networks. Genome Res. 13: 2498-2504.
- Wang L, Xia Q, Zhang Y, Zhu X, Zhu X, Li D, et al. 2016. Updated sesame genome assembly and fine mapping of plant height and seed coat color QTLs using a new high-density genetic map. BMC Genomics. 17: 31
- Wang L, Yu S, Tong C, Zhao Y, Liu Y, Song C, et al. 2014. Genome sequencing of the high oil crop sesame provides insight into oil biosynthesis. Genome Biol. 15: R39
- Wu F, Mueller LA, Crouzillat D, Pétiard V, Tanksley SD. 2006. Combining bioinformatics and phylogenetics to identify large sets of single-copy orthologous genes (COSII) for comparative, evolutionary and systematic studies: a test case in the euasterid plant clade. Genetics. 174: 1407-1420.
- Yang J, Liu D, Wang X, Ji C, Cheng F, Liu B, et al. 2016. The genome sequence of allopolyploid Brassica juncea and analysis of differential homoeolog gene expression influencing selection. Nat Genet. 48: 1225-1232.
- Yang Z. 2007. PAML 4: phylogenetic analysis by maximum likelihood. Mol Biol Evol. 24: 1586-1591.
- Yi DK, Kim KJ. 2012. Complete chloroplast genome sequences of important oilseed crop Sesamum indicum L. PLoS One. 7: e35872
- Yi X, Du Z, Su Z. 2013. PlantGSEA: a gene set enrichment analysis toolkit for plant community. Nucleic Acids Res. 41: W98-W103.
- Zhang S, Qi Y, Liu M, Yang C. 2013. SUMO E3 ligase AtMMS21 regulates drought tolerance in Arabidopsis thaliana. J Integr Plant Biol. 55: 83-95.