Abstract
We conducted transcriptome profiling analysis of O. glaberrima root using RNA-Seq at the control (OCR) and 100 mM NaCl treatment (OTR) at two time points (6 and 24 hours after treatment) to detect genes induced by salt stress. RNA-Seq analysis generated 102,690,698 sequence reads representing 30,388 predicted transcripts including 6,189 unannotated in Rice Annotation Project database. A total of 539 and 424 of differentially expressed genes (DEGs) were detected between OCR_6hours vs OTR_6hours and between OCR_24hours vs OTR_24hours, respectively (P < 0.001, q < 0.05). Among these DEGs, 262 genes showed constant differential expression at both 6 hours and 24 hours, and these included a bHLH containing protein, WRKY transcription factor, serine/threonine kinase, R2R3 MYB protein, and amino acid transporters. Interestingly, an enhanced seedling salt tolerant introgression line IL55 from a cross between a salt sensitive indica cultivar “Milyang23” and O. glaberrima harbors one DEG, Os02g0787300 encoding a mitogen activated protein kinase kinase (MAPKK) on chromosome 2. Analysis of the salt tolerance of the F2:3 lines from a cross between IL55 and Milyang23 indicated that the O. glaberrima segment on chromosome 2 containing the MAPKK gene was responsible for better shoot growth under salt stress at the seedling stage. The salt inducible genes will be evaluated in introgression lines (ILs) to understand whether the expression of these genes is associated with salt tolerance in ILs having the Milyang23 genetic background. Transcriptome sequence information in this study may be useful for developing DNA markers linked to salinity tolerance for MAS breeding.
-
Key words: Salt stress, RNA-seq, Rice, Quantitative trait loci, Differentially expressed genes
INTRODUCTION
Rice is highly sensitive to salt stress and the salt in reclaimed paddy fields has resulted in reduced rice production in Asia and Africa. Salt is one of the most serious environment stresses for rice cultivation, and many genetic studies have been conducted to increase salinity tolerance in rice (
Lee 1995). However, several reasons make breeding for salt tolerant
japonica rice varieties very challenging. First, there are very few donors of salt tolerance because most rice varieties are sensitive to salt except for some traditional
indica varieties (
Lee 1995;
Yeo et al. 1990). Second, salt tolerance is a complex trait, governed by actions and interactions of many quantitative trait loci (QTLs), thus understanding the mechanisms underlying salt tolerance is a significant challenge. Thirdly, it is very difficult to evaluate physiological traits related to salt tolerance (
Ashraf and Harris 2004).
African cultivated rice,
O. glaberrima, is limited to cultivation in West Africa (
Khush 1997).
O. glaberrima possesses many useful traits (e.g., weed competitiveness, salt and drought tolerance) and represents a rich reservoir of genes for diseases and pest resistance as well as tolerance to drought as well as excess water (
www.scienceinafrica. co.za/nerica.htm). Sterility barriers between
O. sativa and
O. glaberrima in early generations have limited transfer of useful genes between these species (
Jones et al. 1997). Nevertheless, several beneficial traits from
O. glaberrima have been successfully introgressed into adapted
O. sativa cultivars (
Jones et al. 1997;
Suh et al. 2005;
Kang et al. 2008).
Several QTL analyses of salt tolerance in rice were performed using F
2, RILs or DH (doubled haploid) populations.
Zhang et al. (1995) detected QTLs for 1,000 grain weight on chromosome 7 using an F
2 population under NaCl-stress conditions.
Prasad et al. (2000) identified QTLs for seedling traits such as seed germination, seedling root length, seedling dry weight, and seedling vigor under salt stress using a DH population derived from a cross between
indica and
japonica varieties. Several QTLs for physiological traits, Na
+ and K
+ uptake and Na
+: K
+ ratio in shoots and roots were mapped using an F
2:3 population derived from a cross between Koshihikari and Nona Bokra (
Koyama et al. 2001;
Lin et al. 2004).
Ren et al. (2005) isolated the
SKC1 gene on chromosome 1 that maintained K
+ homeostasis in the salt tolerant variety Nona Bokra under salt stress. However, our limited under-standing of the various salt tolerance mechanisms and genes involved in the functional polymorphism for the trait makes it difficult to employ marker-assisted breeding for salt tolerance. Also, the map-based cloning approach is time consuming, laborious, and expensive (
Salvi and Tuberosa 2005;
Price 2006).
Gene expression profiling is accelerating our progress towards a comprehensive understanding of the genetic mechanisms that control responses to environmental stress. Next-generation sequencing technologies have revolu-tionized transcriptomics by providing opportunities for multidimensional examinations of cellular tran-scriptomes in which high-throughput expression data are obtained at a single-base resolution. It has already been demonstrated that deep RNA sequencing (RNA-seq) is a powerful tool for comparing gene expression and discovering novel spice junctions, transcripts, alternative transcription start sites, and rare transcripts (
Cloonan et al. 2008;
Mortazavi et al. 2008;
Nagalakshmi et al. 2008;
Sultan et al. 2008;
Wilhelm et al. 2008;
Zhang et al. 2010; Kynd
et al. 2012).
Here, an RNA-Seq approach was applied to hydroponically grown rice to rapidly identify and analyze the whole transcriptome of O. glaberrima root tissue under salt stress. In parallel, the identification of genomic regions of QTLs underlining salt tolerance was performed using 55 introgression lines derived from a cross between the salt susceptible Oryza sativa cultivar Milyang23 as a recurrent parent and O. glaberrima as the donor parent. The objective of the present study was to identify functional polymorphisms of the candidate genes for salt tolerance derived from O. glaberrima by using QTL mapping and transcriptome profiling analysis. This work also contributes to the discovery of salt stress inducible transcripts.
MATERIALS AND METHODS
Plant materials
Previously, 55 BC
3F
10 lines derived from a cross between the Korean Tongil type cultivar Milyang23 and the African cultivated rice
O. glaberrima were developed and evaluated for agronomic traits (
Kang et al. 2008). These 55 introgression lines (ILs) with two parents were used for salt tolerance screening in this study. Among the 55 ILs, four lines with enhanced salt tolerance compared to Milyang23 were selected for further studies. To investigate the association of the
O. glaberrima introgression segment with salt tolerance, 54 F
2:3 lines were developed from a cross between the salt tolerant line IL55 and Milyang23.
Milyang23 and
O. glaberrima seeds were uniformly germinated in the dark at 30°C for 3 days and germinated seeds were placed in paper soaked with water for 7 days (
Fig. 1).
Ten days after germination, seedlings were moved to hydroponic culture tube filled with half strength Yoshida solution (
Yoshida et al. 1976) and three different concentrations of NaCl (50, 75 and 100 mM) at 14 days after germination. Half strength Yoshida solution without NaCl treatment was used as the control. Seedlings were grown in a growth chamber with 13 hours light at 28°C and 11 hours dark at 20°C. Seedlings were placed in a completely randomized design with four replications. The solution was changed every three days and NaOH and HCl were used to adjust pH (5.5-6.0). Phenotype evaluation was conducted at 5 days after salt treatment for shoot and root fresh weight, proline content, and electrolyte leakage. Fresh weight was estimated in the morning to avoid evaporation while weighing shoots and roots. Reduction rate of shoot and root weight, was calculated using the following equation:
R (%) = 100 (C - T) / C
where R is the reduction rate (%), and C and T are the trait values in the control and treated plots, respectively. Means of four plants were calculated for each trait and used in the data analysis. The procedure for proline extraction and its concentration followed the method of
Lin et al. (2002). Proline contents are expressed as nmol/
g FW. The procedure for measuring electrolyte leakage followed the method of
Lutts et al. (1996).
Seedlings of
O. glaberrima were grown for 14 days in half strength Yoshida solution with and without 100 mM of NaCl.
O. glaberrima roots from four plants grown under salt stress and control conditions were sampled at 6 hours and 24 hours (
O. glaberrima Control Root 6 hours: OCR_6hours,
O. glaberrima 100 mM NaCl stress Root: OTR_6hours,
O. glaberrima Control Root 24 hours: OCR_24hours, and
O. glaberrima 100 mM NaCl stress Root: OTR_24hours). Root samples were immediately frozen in liquid nitrogen for RNA extraction. For RNA extraction, four plants of each treatment group were collected and mixed to minimize the effect of transcriptome unevenness among plants. Total RNA was extracted using TRIzol reagent (Invitrogen, USA). Total RNA samples (10 ug) were subjected to cDNA con-struction for Illumina sequencing in accordance with the protocol for the mRNA-Seq sample preparation kit (Illumina, USA). Oligo(dT) magnetic beads were used to isolate poly(A) RNA from the total RNA samples. First-strand cDNA was synthesized using random hexamer primers for 10 minutes at 25°C, 50 minutes at 42°C, and 15 minutes at 70°C. After the first strand synthesis, dNTPs, RNaseH, and DNA polymerase I were added to synthesize second-strand DNA for 2.5 hours at 16°C. The double-stranded DNA was fragmented using dsDNA fragmentase for 30 minutes at 37°C. The ends of the double-stranded cDNA were repaired using T4 DNA polymerase and Klenow DNA polymerase and phosphorylated using T4 polynucleotide kinase. A single “A” base was added to the cDNA molecules using Klenow exo-nuclease, and the fragments were ligated to the PE adapters. cDNA fragments 200 ± 25 bp in size were collected. The purified cDNA was amplified by 15 cycles of PCR for 10 seconds at 98°C, 30 seconds at 65°C, and 30 seconds at 72°C using PE1.0 and PE2.0 primers. AMPure (Beckman Coulter, USA) procedure was performed for purification and size selection of samples. Quantitation and quality control of the sequencing library was calculated with a Bioanalyzer 2100 algorithm (
Supplementary Fig. S1). For each sample, two biological replicates were sequenced using an Illumina HiSeq2000.
Using a sliding window method, the reads obtained by sequencing were further trimmed according to their base qualities: with a specific base sliding window, if the average quality value for this window is higher than a threshold (phred score > 25,
P < 0.00316), then the window sliding continues, whereas, if it is lower than the threshold, then this stretches of sequence are trimmed out from the original read. The trimmed and filtered reads were further assembled and mapped to the
Oryza sativa subsp.
Japonica Nipponbare genome (IRGSP Build5 Pseu-domolecules;
http://rgp.dna.Affrc.go.jp/E/IRGSP/Build/Build5.html) by performing alignments using BWA software and default mismatch parameters. Reads that failed to be mapped were progressively trimmed off one base from the 3’-end and mapped to genome again until a match was found. For paired-ends reads, we set insert size between paired reads at 1bp-10kb to allow reads spanning introns of different size. To predict transcript, a series of programs-Bowtie, TopHat, and Cufflinks were used. The reads that did not align to the reference genome but that were mapped to these potential junctions by TopHat were considered to bridge splice junctions. Cufflinks construct gene models on the basis of the exon and bridging sequences predicted by Bowtie and TopHat. ORFs were predicted by BLASTX search against UniprotKB and Rice Annotation Project database. Expression values were calculated in units of FPKM (FPKM, fragments per kilobase of exon per million fragments mapped) with Cufflinks software (version 1.2.1, with parameters -u, -g, -G for cufflinks and -r for cuffcompare).
Gene Ontology analysis and GO enrichment were performed using the Singular Enrichment Analysis (SEA) of agriGO with Rice MSU6.0 as reference background. Hypergeometric test with Benjamini & Hochberg false discovery rate (FDR) were performed using the default parameters to adjust the P-value. Parametric Analysis of Gene Set Enrichment (PAGE) was also executed in agriGO. PAGE is based on differential gene expression level (Log2FC). The Benjamini and Hochberg FDR were determined using the default parameters to adjust the P-value.
Comparison of gene expressions between RNA-Seq by qRT-PCR
The transcript levels of nine genes which showed significant change in response to salt stress in the RNA-Seq experiment were confirmed by quantitative real-time PCR. qRT-PCR primers were designed on the basis of the annotation of the RAP-DB (
Supplementary Table S1). A total of 2 ug RNA was used first strand cDNA synthesis using the high-capacity cDNA reverse transcription kit (Applied Biosystems, USA). PCR was performed using 0.5 uL of cDNA with gene-specific primers. Relative quantitative qRT-PCR analysis was conducted using the comparative cycle threshold (Ct) method according to manufacturer’s protocol (Applied Biosystems) to examine the expression of four genes under the 100 mM NaCl stress condition in Milyang23 and
O. glaberrima. All qRT-PCR were performed with three technical replicates. qRT-PCR was executed using the following program: 95°C for 3 minutes; 32 cycles of 95°C for 15 seconds, melting temperature for 15 seconds, and 72°C for 45 seconds; and 72°C for 5 minutes. Relative quantity values (RQ) for each transcript were determined after normalization with the rice actin gene.
Student’s t-test was conducted to detect the difference for traits associated with salt tolerance between Milyang23 and O. glaberrima. Mean comparison of traits for salt tolerance among four selected ILs and Milyang23 and among genotypic classes in 54 F2:3 lines under salt condition was carried out using Duncan’s multiple range test using the Statistical Package for the Social Sciences (SPSS 12; SPSS Inc., Chicago, IL, USA).
RESULTS
Comparison of salt tolerance between Milyang23 and O. glaberrima
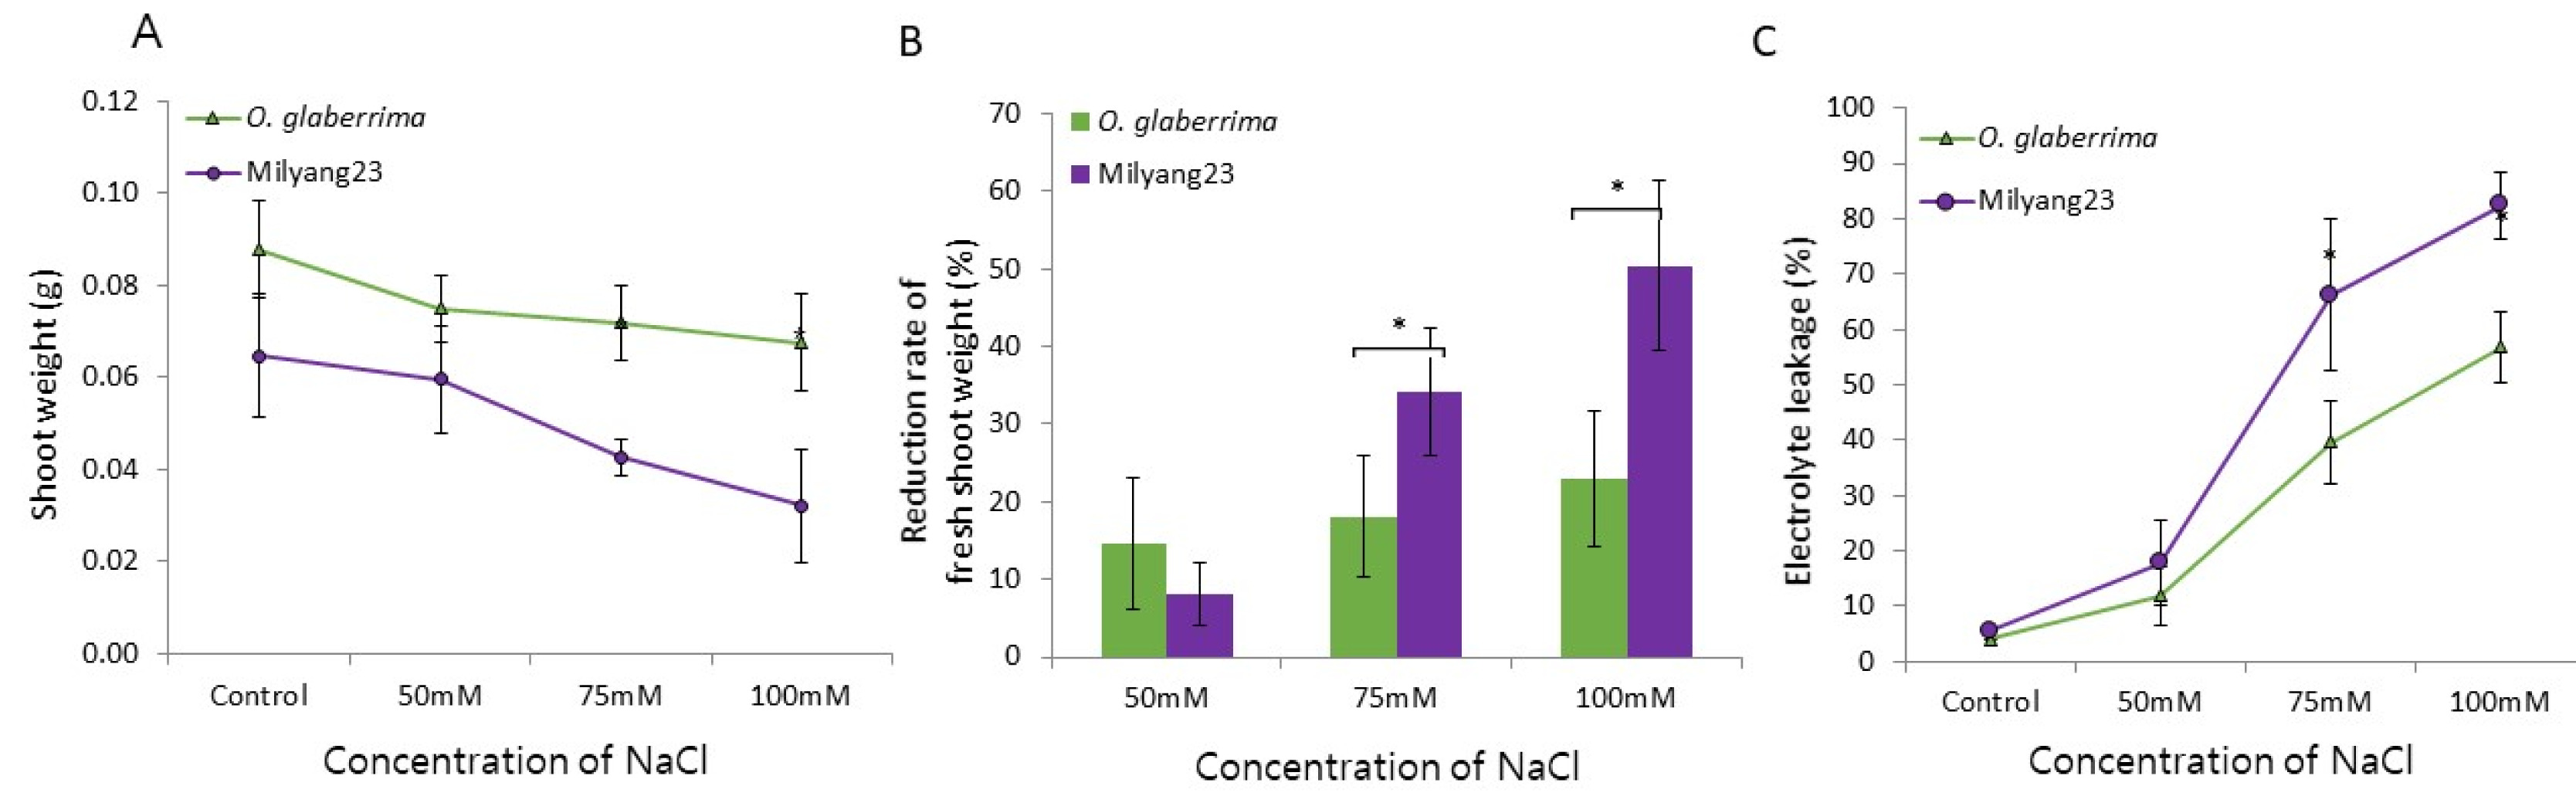
To select critical salt stress level between Milyang23 and
O. glaberrima, salt stress was imposed at four concentrations of NaCl (0, 50, 75 and 100 mM). Significant difference was observed at both 75 mM and 100 mM of NaCl between Milyang23 and
O. glaberrima in all traits whereas no significant differences in all traits were observed at 50 mM NaCl (
Fig. 2).
To confirm change of physiological traits in plant tissues by imposition of salt stress, seedlings from the NaCl stress and the control treatment were harvested for evaluation of plant height, shoot and root fresh weight, electrolyte leakage, and proline content. Under 100 mM NaCl treatment,
O. glaberrima showed better performances than Milyang23 in the four traits evaluated: lower reduction of shoot and root weight, lower electrolyte leakage, and higher proline content (
Fig. 3). These results suggest that the
O. glaberrima accession is a valuable resource for salt tolerance breeding.
Whole genome transcriptome analysis was conducted using eight root samples from the four treatments: OCR_ 6hours, OTR_6hours, OCR_24hours, and OTR_24hours (comprising eight cDNA libraries representing 2 biological replicates per sample). A total of 102,690,698 sequence reads 65-76 bp in length were generated, totaling 7.39 Gb of the sequence data (
Table 1). The number of sequence reads generated from OCR_6hours, OCR_24hours, OTR_6hours, and OTR_24hours were 43.3, 24.8, 25.0, and 25.7 million, respectively. The reads were aligned to the Nipponbare rice reference genome database because the public
O. glaberrima genome sequence was not released for the transcriptome analysis in this study. This might have affected the efficiency of mapping transcripts associated with the salt tolerance traits possibly due to the gene divergence between
O. sativa and
O. glaberrima. Of the total reads, 86.8% were mapped to the reference genome while the remaining 13.2% were unmapped.
Transcribed regions were identified on the basis of the piling up of mapped short reads through the programs Bowtie, TopHap, and Cufflinks. In the O. glaberrima root, 80,507 transcripts were predicted. Among these, 37,869 and 42,638 transcripts were categorized as known and new transcripts, respectively, based on Os-Nipponbare-Refe-rence-IRGSP-1.0 annotation. To predict the function of mapped and unmapped transcripts, BLASTX search was conducted using plant total protein from UniprotKB as a reference database. As a result of BLASTX best hit, 30,388 transcripts were annotated. Of these transcripts, 20.4% (6,189/30388) were not annotated in RAP-DB.
Gene ontology analysis using transcript expressed in O. glaberrima root
In total, 30,388 previously annotated rice loci were detected to be expressed in the data set (
Supplementary Table S2). All detected annotated transcripts were assigned to different functional categories using SEA in agriGO with Rice MSU6.0 as reference background. The annotations were verified manually and integrated using gene ontology (GO) classification. In each of the tree main categories (biological process, molecular function, and cellular component) of the GO classification, there were 259, 248, and 56 functional groups, respectively. Metabolic process with 9158 genes (GO:0008152) were dominant in the main category of biological process. Binding and nucleus with 12631 (GO:0005488) and 1952 (GO:0005634) genes, were dominant in the main categories of molecular function and cellular component, respectively.
To obtain statistical confirmation of the differences in gene expression between the control and the salt treated plot, Cuffdiff and CummeRbund were used. General similarities and specific outliers between Control and salt treated plot are shown (
Supplementary Fig. S2,
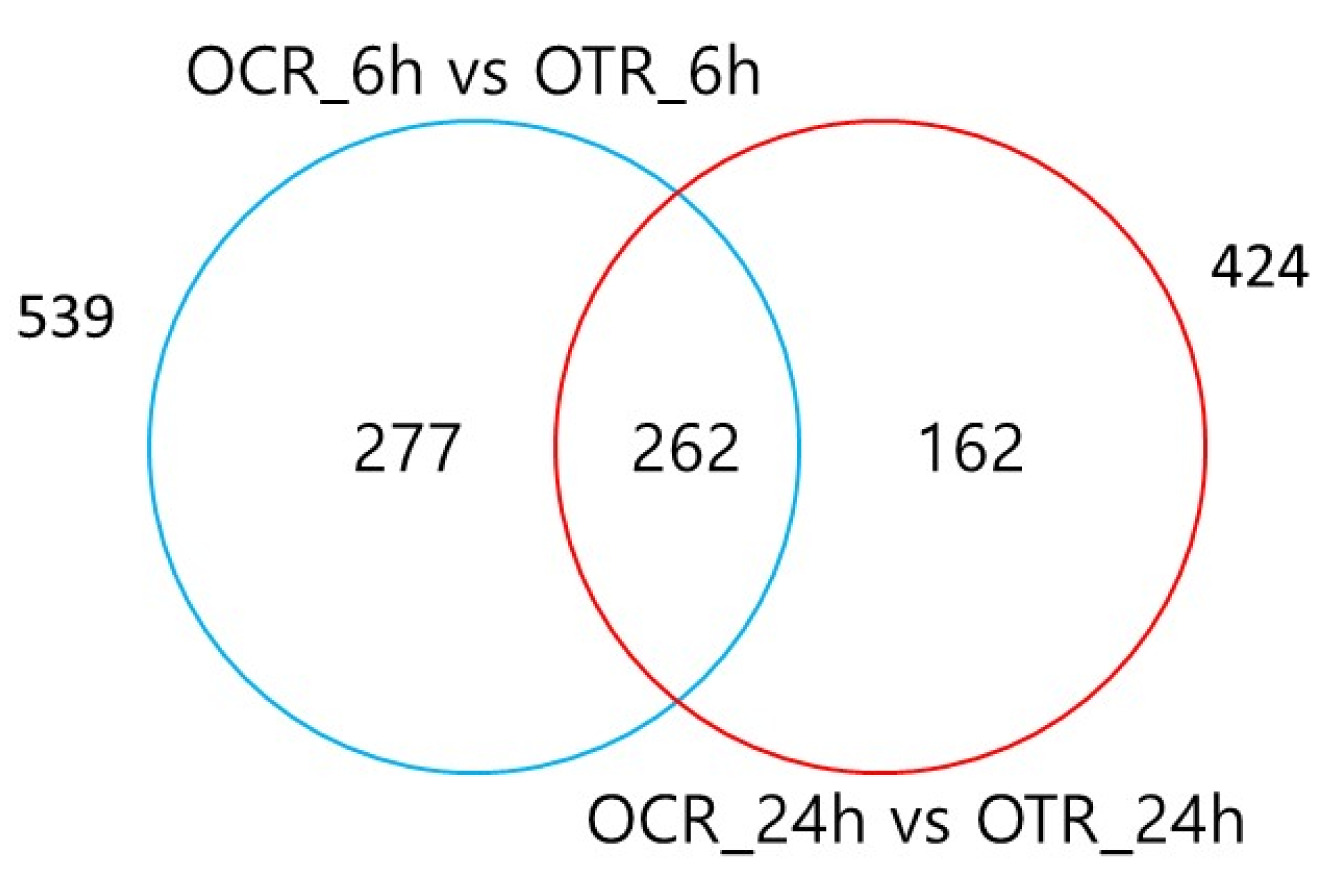
Supplementary Tables S3, S4). A total of 539 differentially expressed genes (DEGs, 220 annotated in RAP-DB + 319 unannotated in RAP-DB) were detected between OCR_6hours and OTR_6hours, with 513 genes up-regu-lated and 26 down-regulated (
Fig. 4,
Supplementary Fig. S3,
Supplementary Table S3). Between OCR_24hours and OTR_24hours, a total of 424 differential expressed genes (160 annotated in RAP-DB + 264 unannotated in RAP-DB) were detected, with 345 genes up-regulated and 79 down-regulated (
Fig. 4,
Supplementary Fig. S3,
Supplementary Table S4). The expression profiles in
O. glaberrima were further categorized into three patterns (
Fig. 4,
Supplementary Table S5), 6 hours specific genes (only significantly expressed at 6 hours), 24 hours specific genes (only significantly expressed at 24 hours), and constantly expressed genes (both significantly expressed at 6 hours and 24 hours). There are 277 and 162 significantly changed genes in specific at 6 hours and 24 hours, respectively, and 262 genes were differentially expressed at both 6 hours and 24 hours. This shows that the differentiation of expressed genes between OCR_6hours and OTR_6hours is larger than that between OCR_24hours and OTR_24hours). Among the DEGs, highly expressed genes such as basic helix-loop-helix (bHLH) containing protein, WRKY transcription factor, serine/threonine kinase, R2R3 MYB protein, and amino acid transporter were detected at both two time points samples, OCR_6hours vs OTR_6hours and OCR_24hours vs OTR_24hours.
Functional analysis of DEGs based on RNA-seq data
GO analysis was conducted to classify the function of the DEGs during imposition of salt stress. Based on sequence homology, 539 genes from OCR_6hour vs OTR_6hours could be categorized into 141 groups. In three main categories of the GO classification, 70 (biological process), 25 (cellular component), and 46 (molecular function) functional groups were identified (Supple-mentary Fig. S4). A total of 424 genes from OCR_24hours vs OTR_24hours could be categorized into 105 groups with 39 (biological process), 22 (cellular component), and 44 (molecular function) functional groups (
Supplementary Fig. S5). Among the two sample groups, the term metabolic process (GO:0008152), binding (GO:0005488), and cell (GO:0005623) were dominant in each of the three main categories.
Technical and biological variation of the data was checked by performing qRT-PCR of four, two, and three randomly chosen DEGs showing constitutive, 6 hours- and 24 hours- specific expression, respectively. Comparison between the results from mRNA-seq and qRT-PCR analysis of these genes is shown in
Table 2. Three genes showing 24 hours-specific expression displayed 2.1-3.0 fold increase at 24 hours compared with 6 hours. Expression of the 6 hours-specific
Os02g0191300 gene was also higher at 6 hours than 24 hours. However, the four genes with constitutive expression at 6 hours and 24 hours based on RNA-seq showed differential expression with 1.4-4.2 fold increase at 24 hours than 6 hours using qRT-PCR indicating that the qRT-PCR result is not consistent with that of the RNA-seq. Analysis of more genes is needed to know the possible application of the sequence-based approach as a gene expression profiling for detection of salt induced genes.
Introgression lines derived from advanced backcross population are very effective for identifying and confirming QTL. To detect the chromosomal region associated with salt tolerance, 55 introgression lines were evaluated for physiological traits related to salt tolerance (
Supplementary Fig. S6). Among 55 lines, four lines (IL4, IL39, IL42, and IL55) showing apparently improved salt tolerance compared to Milyang23 in response to 100 mM NaCl at the seedling stage were selected (
Supplementary Fig. S7,
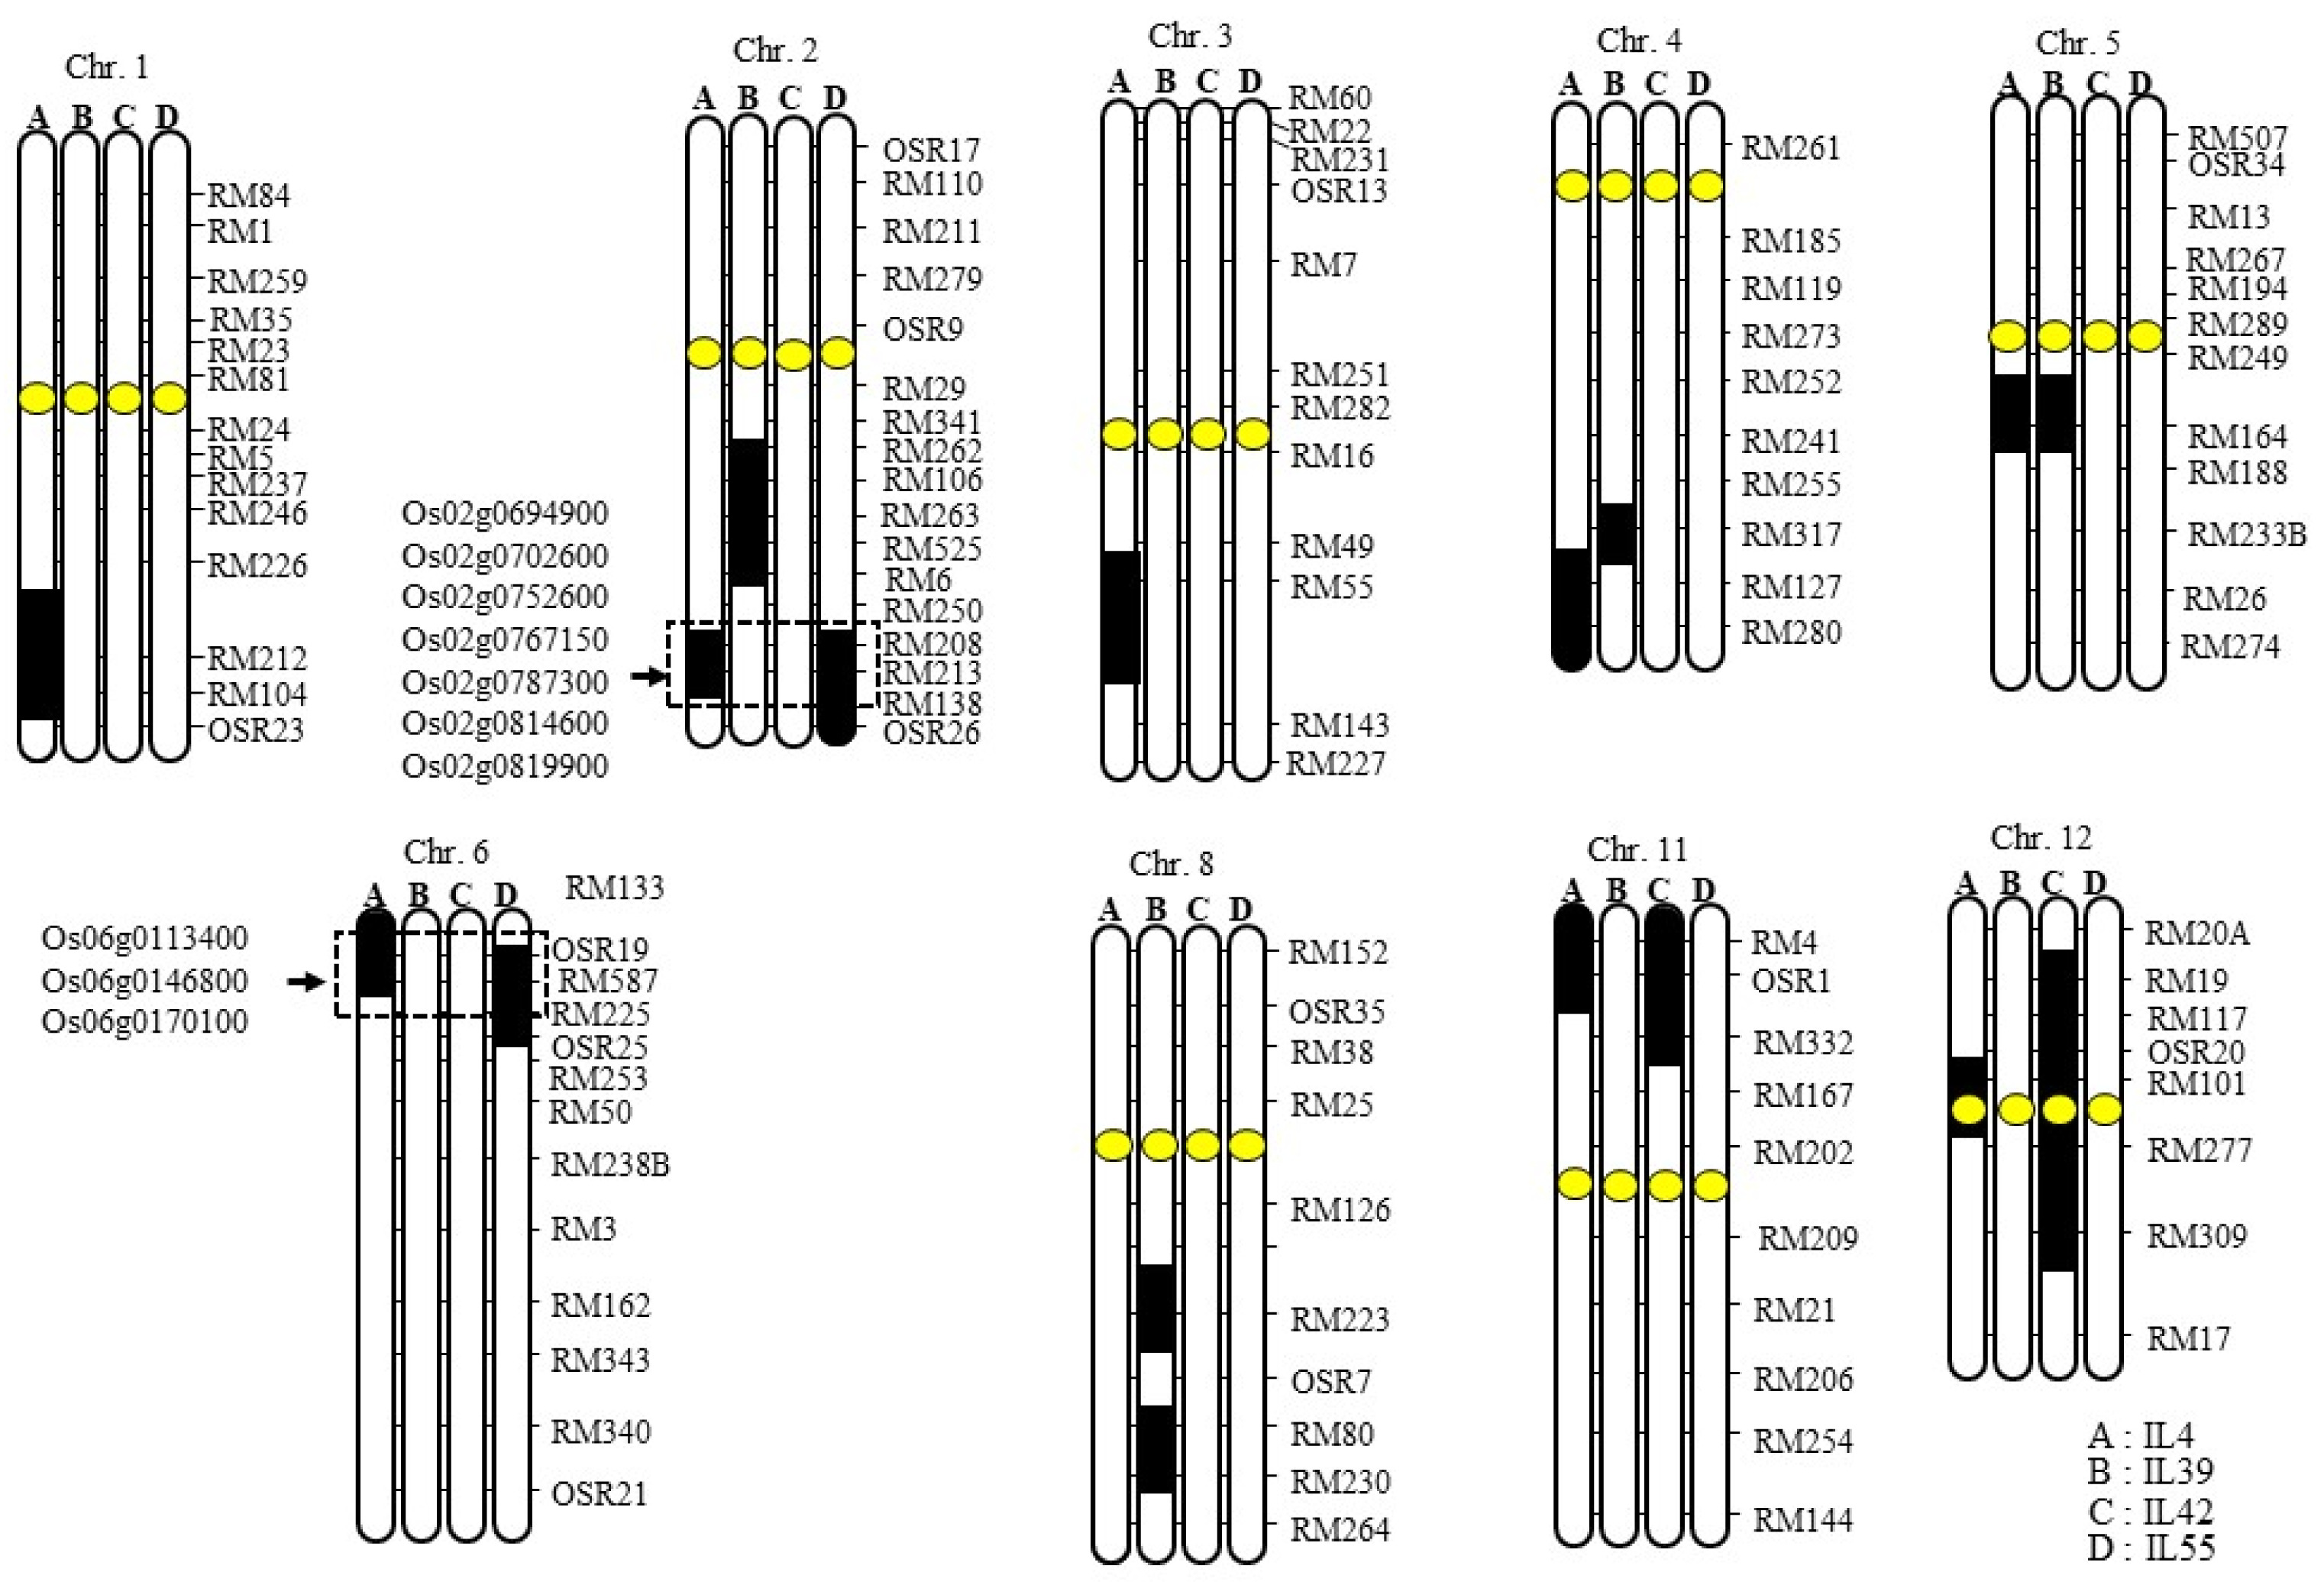
Table 3). IL4, IL39, IL42, and IL55 have eight, five, two and two homozygous
O. glaberrima segments in the Milyang23 background, respectively (
Fig. 5). The segments on chromosomes 2, 4, 5, 6, 11, and 12 were shared by at least two of the four lines. The four lines performed better than Milyang23 in four traits measured: fresh shoot and root weight under the treated condition, reduction rate of fresh shoot and root weight (
Table 3). We compared the location of genes showing differential expression between the control and 100 mM NaCl-treated plots with the QTL detected in the ILs. Seven DEGs were co-located in the region flanked by two SSR markers RM250-RM213 on chromosome 2 and two ILs, IL4 and IL55, shared the
O. glaberrima introgressed segment (
Fig. 5). These seven DEGs include
Os02g0694900,
Os02g 0702600,
Os02g0752600,
Os02g0767150,
Os02g0787300,
Os02g0814600,
Os02g0819900 and
Os02g0787300 encodes a mitogen activated protein kinase kinase (MAPKK). Further evaluation is needed to determine the relationship between the expression of these salt-inducible genes in the QTL region and salt tolerance.
To confirm the effect of the chromosome 2
O. glaberrima segment on salt tolerance, we generated an F
2 population (n = 54) from a cross between IL55 and Milyang23. The markers RM208 and OSR19, located on the
O. glaberrima introgression segments on chromosome 2 and 6, respectively, were used to genotype the F
2 population. For RM208 on chromosome 2, the F
2 plants segregated into three genotypes: 11 Milyang23 homozygous, 10
O. glaberrima homozygous, and 33 heterozygous (
Table 4). For OSR19 on chromosome 6, the F
2 plants segregated into two genotypes: 51
O. glaberrima homozygous and three heterozygous plants. The lack of Milyang23 homozygotes for OSR19 might be due to the segregation distortion caused by the
S-5 gene (
Rao et al. 2021). F
2:3 lines from the F
2 population were generated and grown under control and 100 mM NaCl-treated conditions. Reduction rate of shoot and root fresh weight of the F
3 lines and the parents IL55 and Milyang23 were measured. Means of two traits among four groups which are MM (Milyang23 homozygote at RM208), OO (
O. glaberrima homozygote at RM208), MO (heterozygote at RM208), and Milyang23 were compared using Tukey’s test (
Table 5). There was a difference (
P ≤ 0.1) between group MM and group OO in the reduction rate of shoot fresh weight whereas all three groups, MM, OO and MO were significantly lower than Milyang23 in the reduction rate of root fresh weight. The failure of QTL detection for the root trait on chromosome 2 might be possibly due to the small size and the small effect of the QTL in this region. Also, the QTL might be located in the
O. glaberrima segments which were not detected in the Milyang23 background due to the lack of polymorphism between two parents.
DISCUSSION
Recent advances in sequencing technologies and assembly algorithms have facilitated the reconstruction of entire transcriptomes by deep RNA sequencing. mRNA sequencing should be useful in identifying unannotated transcripts related to salt tolerance in rice on the basis of piling up mapped reads. African cultivated rice, O. glaberrima possesses many useful traits such as weed competitiveness and abiotic stress. However, a transcriptome study using O. glaberrima has rarely been performed for exploiting genes related to salt tolerance. To explore beneficial genes for salt tolerance from O. glaberrima, Milyang23 and O. glaberrima were evaluated under control and salt stress conditions. Under 100 mM NaCl stress, O. glaberrima performed better than Milyang23 in all evaluated traits suggesting that O. glaberrima harbors favorable alleles for salt tolerance. To monitor whole transcriptomes induced by salt stress, RNA-seq using O. glaberrima root tissue was carried out. The results presented herein describe the gene-level transcriptome of rice root tissue under salt stress at two time points (6 hours and 24 hours after imposition of 100 mM NaCl). RNA-seq generated a total of 102.7 million reads of 65-75 bp in length and the piling up of mapped reads revealed 539 and 424 DEGs in OCR_6hours vs OTR_6hours and OCR_24hours vs OTR_24hours, respectively.
Four WRKY transcription factors (
Os02g0181300,
Os11g0116600,
Os11g0117500, and
Os12g0116700) were identified among the transcripts that were differentially expressed between the control and 100 mM NaCl stress condition. Several studies have shown that WRKY transcription factors play important roles in plant defense responses (
Wu et al. 2005;
Tao et al. 2011;
Li et al. 2012).
Li et al. (2012) reported that
ZmWRKY33 was induced by salt stress, and an
Arabidopsis transgenic line overexpressing
ZmWRK33 showed improved salt tolerance. We noticed that these four DEGs encoding
WRKY transcription factors were constantly up-regulated at both time points after imposition of salt stress.
Mitogen activated protein kinase genes (
MAPK) are involved in directing cellular responses to a diverse array of stimuli, such as mitogens, and osmotic stress. Several mitogen-activated protein kinase genes known as serine/threonine/tyrosine-specific protein kinases were found to be involved in growth, development, and various stresses (
Zhang and Klessig 2001). Among several salt-inducible
MAPKs reported in rice, the biotic and abiotic stress inducible
MAPKs, the
OsMAPK5 over-expressing rice lines exhibited increased tolerance to salt, drought, and cold stress with increased kinase activity (Xiong
et al. 2003). Five
MAPK and one
MAPKK (mitogen activated protein kinase kinase) were found to be differentially expressed in the present study. For example, mRNA levels of three
MAPKs (
Os02g0819900,
Os10g0157400, and
Os10g0351500) were significantly higher in OTR_6hours than in OCR_6hours, and two
MAPK (
Os02g0120100 and
Os07g0678600) and one
MAPKK (
Os02g0787300) were significantly up-regulated in OTR_24hours compared to OCR_24hours.
RNA-seq provided information on the whole transcribed regions without the need to rely on annotation, whereas the array technology relies on the sequence information of annotated genes or previously identified ESTs to design probes. In this study, 6,198 transcripts unannotated in the RAP-DB have been identified. Of the unannotated transcripts, 319 (OCR_6hours vs OTR_6hours) and 264 (OCR_24hours vs OTR_24hours) were differentially expressed in response to salt stress. Among these unannotated transcripts, some transcripts encode proteins associated with functions such as serine/threonine kinase activity, ATP biosynthetic process in response to salt stress, electron carrier activity, and glutathione transferase activity.
Csiszar et al. (2011) reported that glutathione transferases are involved in the maintenance of the redox state of cells and improving the salt tolerance of tomato.
Kawasaki et al. (2001) also confirmed that the expression of a transcript homologous with glutathione S-transferase was up-regulated in the salt tolerant rice variety, Pokkali. Further studies are needed to shed more light on the function and the potential role of these unannotated genes in the response to salt stress.
QTL mapping approach has facilitated identification of hundreds of chromosomal regions associated with complex traits such as salt tolerance in crop plant. Several QTL analyses of salt tolerance in rice were performed using F
2, RILs or doubled haploid populations (
Zhang et al. 1995;
Prasad et al. 2000;
Koyama et al. 2001;
Lin et al. 2004). Identification of genes for quantitative traits such as salt tolerance is difficult by using any single approach due to the complex inheritance of the trait and limited resolving power of individual techniques (
Pandit et al. 2010). The value of combining genetic mapping with expression profiling to narrow down the number of candidate genes for a complex trait was demonstrated by
Wayne and McIntyre (2002). Recently, combining QTL mapping and transcriptome profiling has been used in plants to identify genes associated with drought tolerance traits in maize (
Marino et al. 2009).
In the previous study, 55 BC
3F
10 lines derived from a cross between Milyang23 and
O. glaberrima were devel-oped and evaluated for agronomic traits (
Kang et al. 2008). Among 55 lines, four lines showing apparently improved salt tolerance compared to Milyang23 were selected in this study. Some
O. glaberrima introgression segments on chromosomes 2, 4, 5, 6, 11, and 12 were shared by at least two of the four lines. It is noteworthy that the
O. glaberrima segment on chromosome 2 (RM208-RM213) was reported to harbor QTLs associated with salt tolerance traits such as yield components under the salt condition (
Xing et al. 2002;
Takehisa et al. 2004). We also noticed that seven DEGs detected by RNA-seq were located between RM208 and RM213. Among the seven genes,
Os02g0819900 and
Os02g0787300 encode
MAPK and
MAPKK, respectively, which are associated with salt tolerance.
Analysis of the salt tolerance of the F
2:3 lines derived from crossing IL55 (chromosome 2 and 6 introgressions from
O. glaberrima) and Milyang23 indicated that the
O. glaberrima segment on chromosome 2, containing seven DEGs detected by RNA-seq, was associated with an increase in seedling shoot growth under salt stress. The effect of the
O. glaberrima segment on chromosome 6 for salt tolerance could not be determined because no Milyang23 homozygous F
2 plant for that introgression was observed. This might be due to the segregation distortion (SD) gene S5 on chromosome 6 or other unknown gene(s) near the
O. glaberrima segment (
Aluko et al. 2004;
Rao et al. 2021). In this study, the detection power of the gene associated with salt tolerance was probably lowered due to SD and small population size.
Courtois et al. (2003) reported that QTL for root dry weight was detected on chromosome 6 using RILs under normal condition.
Champoux et al. (1995) also identified QTLs for root traits under drought stress condition. These QTLs from a number of reports share the same or similar regions with the
O. glaberrima segment on chromosome 6 in the IL55. Considering that the mean value of 54 F
3 lines either
O. glaberrima homozygous or heterozygous at OSR19 on chromosome 6 was significantly lower in the root weight reduction compared to Milyang23, it is rational to infer that this interval harbors genes/QTLs controlling root growth under the salt stress condition.
Expression patterns of the salt inducible genes located on the chromosome 2 O. glaberrima segment will be evaluated using introgression lines to check whether these genes are effectively expressed in the Milyang23 genetic background. Also, the sequence of transcriptome will be useful for developing DNA markers linked to salinity tolerance for MAS breeding.
Supplemental Materials
ACKNOWLEDGEMENTS
This work was carried out with the support of “Cooperative Research Program for Agriculture Science and Technology Development (Project No. PJ015757)” Rural Development Administration, Republic of Korea.
Fig. 1Seed preparation and germination (A), transfer of seedlings to hydroponic culture tube filled with half strength Yoshida solution (B) and plants in a growth chamber (C).
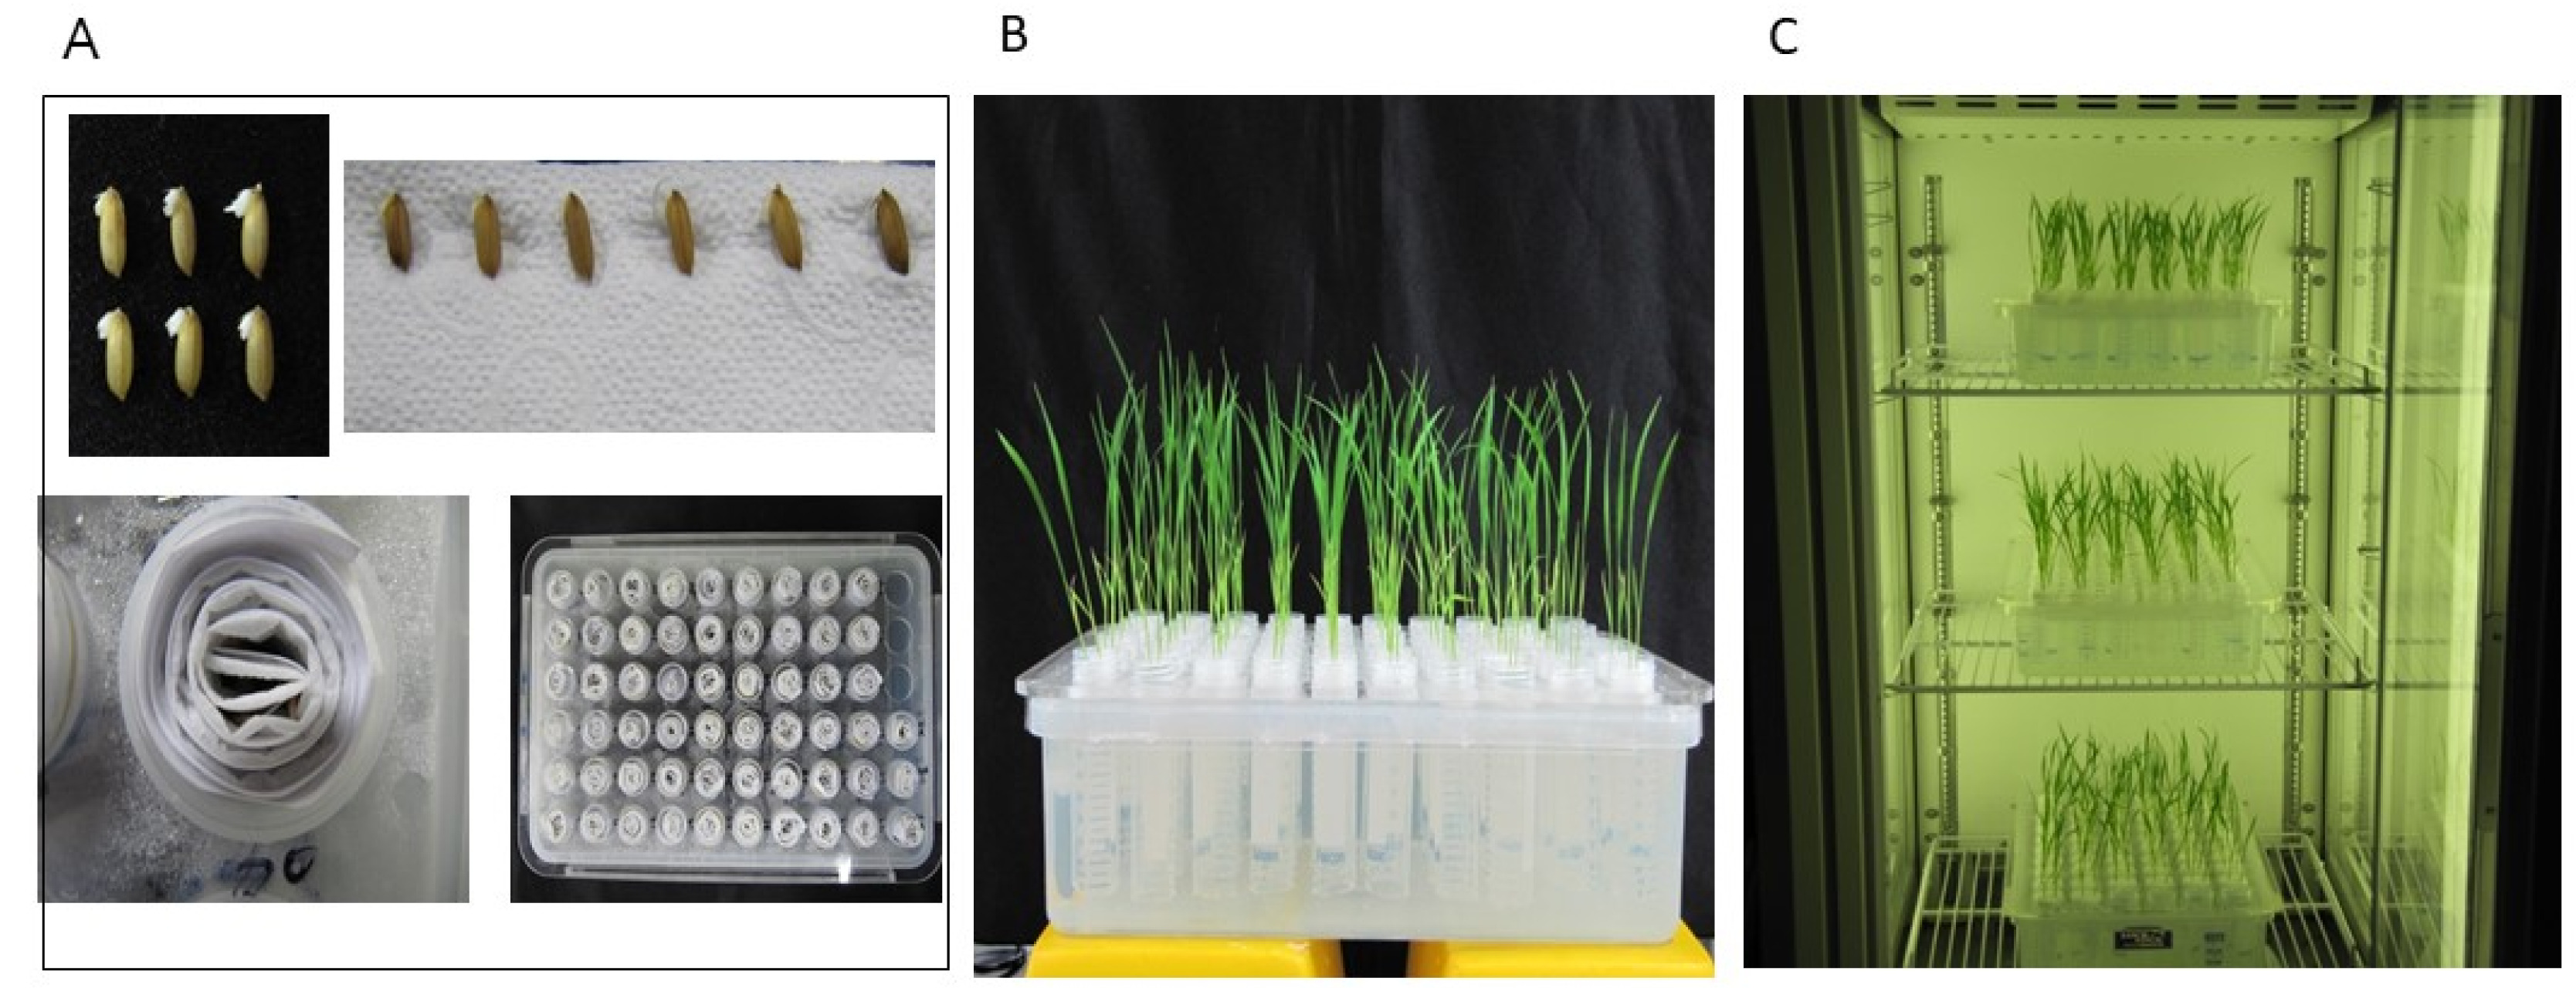
Fig. 2Comparison of physiological traits in Milyang23 and O. glaberrima at different concentrations of NaCl. * indicates significant difference based on the Student’s t-test at P < 0.05. (A) Shoot weight, (B) Reduction rate of shoot weight (C) Electrolyte leakage.

Fig. 3Comparison of five traits between Milyang23 and O. glaberrima at three time points after 100 mM NaCl treatment. Error bars indicate standard deviation of the means. * indicates significant difference at P < 0.05 based on the one-way ANOVA. (A) Reduction of seedling height, (B) Reduction rate of shoot weight (C) Reduction rate of root weight, (D) Electrolyte leakage and (E) Proline content.
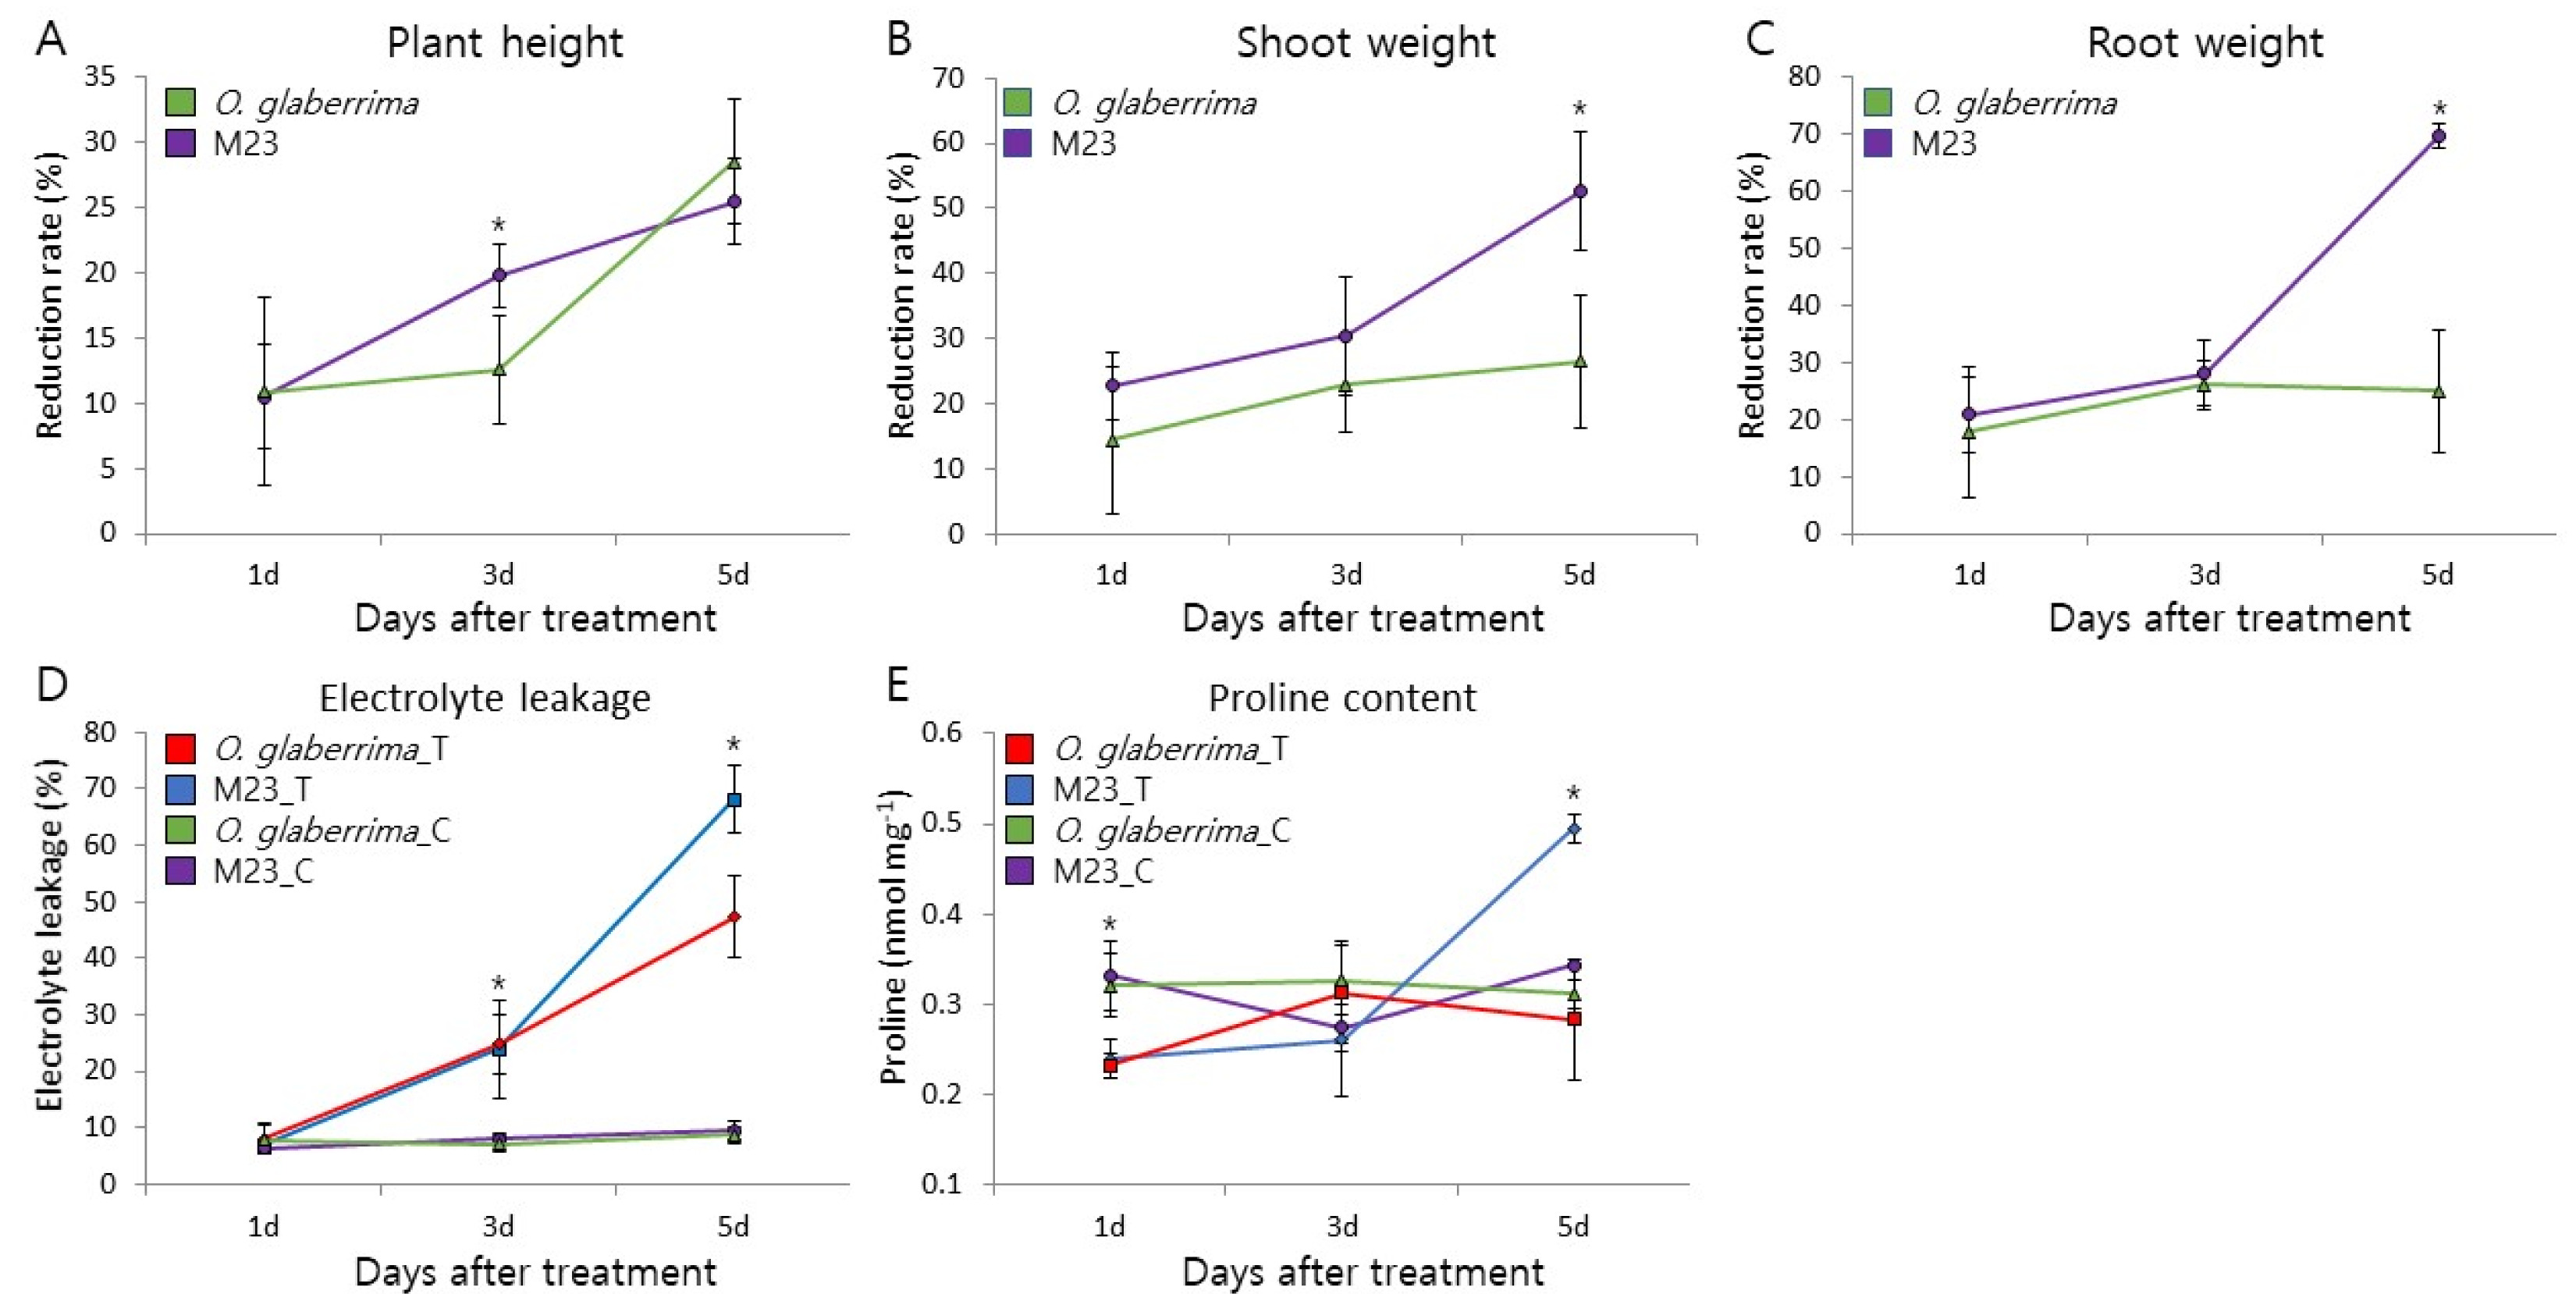
Fig. 4Venn diagram showing the differentially expressed genes detected from each of two time points.

Fig. 5Graphical genotypes of four salt tolerant introgression lines derived from a cross between Milyang23 and O. glaberrima. White and black regions indicate Milyang23 and O. glaberrima chromosomal seg-ments, respectively. Yellow circles indicate centromeres. The chromosomes with the O. glaberrima segments in four ILs are shown. DEGs are shown in the O. glaberrima segments on chromosomes 2 and 6.

Table 1Summary of read numbers based on the mRNA-Seq data from O. glaberrima root.
Table 1
|
Sample |
Total filtered reads |
Mapped reads (%) |
Unmapped reads (%) |
|
OCR_6hours |
43,282,521 |
36,282,425 (84.6) |
6,680,096 (15.4) |
|
OCR_24hours |
24,809,587 |
22,001,512 (88.7) |
2,808,075 (11.3) |
|
OTR_6hours |
24,985,701 |
21,349,071 (85.5) |
3,636,630 (14.5) |
|
OTR_24hours |
25,699,935 |
22,737,690 (88.5) |
2,962,245 (11.5) |
Table 2Experimental validation using qRT-PCR of nine genes randomly chosen from three categories based on their time point-specific expression.
Table 2
|
Category |
Locus |
Description |
RNA-Seq Log10 (FPKM) |
|
qRT-PCR (RQ+) |
|
6 hours |
24 hours |
|
6 hours |
24 hours |
|
Stable |
Os02g0181300 |
Similar to WRKY transcription factor |
6.1 |
6.1 |
|
15 |
21 |
|
Os05g0132700 |
Similar to R2R3 Myb-like protein |
8.3 |
8 |
|
19.1 |
79.8 |
|
Os06g0258000 |
Similar to R2R3 Myb-like protein |
4.3 |
5.3 |
|
4.3 |
7.6 |
|
Os12g0116700 |
Similar to WRKY transcription factor 64 |
4.6 |
4.7 |
|
23.1 |
78.9 |
|
6 h specific |
Os03g0417900 |
Similar to ARE1-like protein |
4.4 |
N.S.# |
|
2.6 |
N.S. |
|
Os02g0191300 |
Similar to Amino acid transporter-like protein |
4.2 |
N.S. |
|
10.4 |
4.2 |
|
24 h specific |
Os02g0120100 |
Similar to Serine/threonine protein kinase |
N.S. |
5.2 |
|
12.6 |
37.1 |
|
Os07g0678600 |
Similar to Serine/threonine protein kinase |
N.S. |
4.9 |
|
1.2 |
2.5 |
|
Os02g0787300 |
Similar to MAP kinase kinase |
N.S. |
7.6 |
|
1.8 |
5.4 |
Table 3Mean comparison of salt tolerance traits among Milyang23 and four selected ILs.
Table 3
|
Line |
Traitx
|
|
FSWT (g) |
FRWT (g) |
RFSW (%) |
RFRW (%) |
|
Milyang23 |
0.155by
|
0.08c |
44.6b |
28.9b |
|
IL4 |
0.209a |
0.123b |
23.1a |
16.5a |
|
IL39 |
0.221a |
0.116bc |
18.2a |
22.7ab |
|
IL42 |
0.196a |
0.137a |
22.7a |
13.4a |
|
IL55 |
0.178ab |
0.124b |
14.8a |
13.3a |
Table 4Allele frequencies at two markers in 54 F2 plants.
Table 4
|
Marker |
Chr. |
Genotypex
|
X2
(1:2:1) |
Probability |
|
MM |
MO |
OO |
|
RM208 |
Chr. 2 |
11 |
33 |
10 |
2.7 |
0.1 < P < 0.5 |
|
OSR19 |
Chr. 6 |
0 |
3 |
51 |
139 |
P < 0.005 |
Table 5Mean comparison of two traits related to salt tolerance based on the genotype at RM208 among three groups and Milyang23.
Table 5
|
Linex)
|
Trait (Mean ± s.d.) |
Reduction of
shoot wt. (%) |
Reduction of
root wt. (%) |
|
Milyang23 |
49 ± 8.2 cy)
|
61 ± 9.2 b |
|
MM |
38 ± 7.2 b |
38 ± 5.8 a |
|
OO |
33 ± 6.1 a |
38 ± 6.1 a |
|
MO |
42 ± 6.9 b |
39 ± 8.9 a |
References
- Aluko G, Martinez C, Tohme J, Castano C, Bergman C, Oard JH. 2004. QTL mapping of grain quality traits from the interspecific cross Oryza sativa x O. glaberrima. Theor. Appl. Genet.. 109: 630-639.
- Ashraf M, Harris PJC. 2004. Potential biochemical indicators of salinity tolerance in plant. Plant Sci.. 166: 3-16.
- Champoux MC, Wang G, Sarkarung S, Mackill DJ, O'Toole JC, Huang N, et al. 1995. Locating genes associated with root morphology and drought avoidance in rice via linkage to molercular markers. Theor. Appl. Genet.. 90: 969-981.
- Cloonan N, Forrest AR, Kolle G, Gardiner BB, Faulkner GJ, Brown MK, et al. 2008. Stem cell transcriptomeprofiling via massive-scale mRNA sequencing. Nat. Methods.. 5: 613-619.
- Courtois B, Shen L, Petalcorin W, Carandang S, Mauleon R, Li Z. 2003. Locationg QTLs controlling constitutive root traits in the rice population IAC X Co39. Euphytica. 134: 335-345.
- Csiszar J, Vary Z, Horvath E, Galle A, Tari I. 2011. Role of glutathione transferases in the improved acclimation to salt stress in salicylic acid-hardened tomato. Acta Biol. Szeged.. 55: 67-68.
- Jones MP, Dingkuhn M, Aluko GK, Semon M. 1997. Interspecific Oryza sativa L. X O. glaberrima Steud. progenies in upland rice improvement. Euphytica. 94: 237-246.
- Kang JW, Suh JP, Kim DM, Oh CS, Oh JM, Ahn SN. 2008. QTL mapping of agronomic traits in an advanced backcross population from a cross between Oryza sativa L. cv. Milyang 23 and O. glaberrima. Korean J. Breed. Sci. 40: 243-249.
- Kawasaki S, Borchert C, Deyholos M, Wang H, Brazille S, Kawai K, et al. 2001. Gene expression profiles during the initial phase of salt stress in rice. The Plant Cell. 13: 889-905.
- Koyama ML, Levesley A, Koebner RMD, Flowers TJ, Yeo AR. 2001. Quantitative trait loci for component physiological traits determining salt tolerance in rice. Plant Physiol. 125: 406-422.
- Khush GS. 1997. Origin, dispersal, cultivation and variation of rice. Plant Mol Biol.. 35: 25-34.
- Kyndy T, Denil S, Haegeman A, Trooskens G, Meyer TD, Criekinge WV, et al. 2012. Transcriptome analysis of rice mature root tissue and root tips in early development by massive parallel sequencing. J. Exp. Bot.. 63: 2141-2157.
- Lee KS. 1995. Variability and genetics of salt tolerance in japonica rice (Oryza sativa L.). Ph. D. Thesis. 1-112.. University of the Philippines. Los Banos.
- Li H, Gao Y, Wu H, Dai Y, Deng D, Chen J. 2012. ZmWRKY33, a WRKY maize transcription factor conferring enhanced salt stress tolerance in Arabidopsis. Plant Growth Regul.. 70: 207-216.
- Lin CC, Hsu YT, Kao CH. 2002. The effect of NaCl on proline accumulation in rice leaves. Plant Growth Regul.. 36: 275-285.
- Lin HX, Zhu MZ, Yano M, Gao JP, Liang ZW, Su WA, et al. 2004. QTLs for Na+ and K+ uptake of the shoots and roots controlling rice salt tolerance. Theor. Appl. Genet.. 108: 253-260.
- Lutts S, Kinet JM, Bouharmont J. 1996. NaCl-induced Senescence in Leaves of Rice (Oryza sativa L.) Cultivars Differing in Salinity Resistance. Ann. Bot.. 78: 389-398.
- Marino R, Ponnaiah M, Krajewski P, Frova C, Gianfranceschi L, Pe EM, et al. 2009. Addressing drought tolerance in maize by transcriptional profiling and mapping. Mol. Genet. Genom.. 218: 163-179.
- Mortazavi A, Williams BA, McCue K, Schaeffer L, Wold B. 2008. Mapping and quantifying mammalian transcriptomes by RNA-Seq. Nat. Methods.. 5: 621-628.
- Nagalakshmi U, Wang Z, Waern K, Shou C, Raha D, Gerstein M, et al. 2008. The transcriptional landscape of the yeast genome defined by RNA sequencing. Science. 320: 1344-1349.
- Pandit A, Rai V, Bal S, Shinha S, Kumar V, Chauhan M, et al. 2010. Combining QTL mapping and transcriptome profiling of bulked RILs for identification of functional polymorphism for salt tolerance gene in rice (Oryza sativa L.). Mol. Genet. Genom.. 284: 121-136.
- Prasad SR, Bagali PG, Hittalmani S, Shashidhar HE. 2000. Molecular mapping of quantitative trait loci associated with seedling tolerance to salt stress in rice (Oryza sativa L.). Curr. Sci.. 78: 162-164.
- Price A. 2006. Believe it or not, QTLs are accurate! Trends Plant Sci. 11: 213-216.
- Rao J, Wang X, Cai Z, Fan Y, Yang J. 2021. Genetic Analysis of S5-Interacting Genes Regulating Hybrid Sterility in Rice. Rice. 14: 11
- Ren AH, Gao JP, Li LG, Cai XL, Huang W, Chao DY, et al. 2005. A rice quantitative trait locus for salt tolerance encodes a sodium transporter. Nat. Genet.. 37: 1141-1146.
- Salvi S, Tuberosa R. 2005. To clone or not to clone plant QTLs: present and future challenges. Trends Plant Sci.. 10: 297-304.
- Suh JP, Ahn SN, Cho YC, Suh HS, Hwang HG. 2005. Mapping of QTLs for Yield Traits Using an Advanced Backcross Population from a Cross between Oryza sativa and O. glaberrima. Korean J. Breed. Sci.. 37: 214-220.
- Sultan M, Schulz MH, Richard H, Magen A, Klingenhoff A, Scherf M, et al. 2008. A global view of gene activity and alternative splicing by deep sequencing of the human transcriptome. Science. 321: 956-960.
- Takehisa H, Shimodate T, Fukuta Y, Ueda T, Yano M, Yamaya T, et al. 2004. Identification of quantitative trait loci for plant growth of rice in paddy field flooded with salt water. Field Crops Res.. 89: 85-95.
- Tao Z, Kou Y, Liu H, Li X, Xiao J, Wang S. 2011. OsWRKY45 alleles play different roles in abscisic acid signaling and salt stress tolerance but similar roles in drought and cold tolerance in rice. J. Exp. Bot.. 62: 4863-4874.
- Wayne ML, McIntyre LM. 2002. Combining mapping and arraying: an approach to candidate gene identification. Proc. Natl. Acad. Sci. U.S.A.. 99: 14903-14906.
- Wilhelm BT, Marguerat S, Watt S, Schubert F, Wood V, Goodhead I, et al. 2008. Dynamic repertoire of a eukaryotic transcriptome surveyed at single-nucleotide resolution. Nature. 453: pp. 1239-1243.
- Wu Y, Wang Q, Ma Y, Chu C. 2005. Isolation and expression analysis of salt up-regulated ESTs in upland rice using PCR-based subtractive suppression hybridization method. Plant Sci.. 168: 847-853.
- Xiong L, Yang Y. 2003. Disease resistance and abiotic stress tolerance in rice are inversely modulated by an abscising acid inducible mitogen activated protein kinase. The Plant Cell. 15: 745-759.
- Xing YZ, Tan YF, Hua JP, Sun XL, Xu CG, Zhang Q. 2002. Charaterization of the main effects, epistatic effects and their environmental interactions of QTLs on the genetic basis of yield traits in rice. Theor. Appl. Genet.. 105: 248-257.
- Yeo AR, Yeo ME, Flower SA, Flowers TJ. 1990. Screening of rice (Oryza sativa L.) genotypes for physiological characters contributing to salinity resistance, and their relationship to overall performance. Theor. Appl. Genet.. 79: 377-384.
- Yoshida S, Forno DA, Cock JH, Gomez KA. 1976. Laboratory Manual for Physiological Studies of Rice. 3rd ed. IRRI. Manila..
- Zhang GJ, Guo GW, Hu XD, Zhang y, Le Q, Li R, et al. 2010. Deep RNA sequencing at single base-pair resolution reveals high complexity of the rice transcriptome. Genome Res.. 20: 646-654.
- Zhang GY, Guo Y, Chen SL, Chen SY. 1995. RFLP tagging of a salt tolerance gene in rice. Plant Sci.. 110: 227-234.
- Zhang S, Klessig D. 2001. MAPK cascades in plant defense signaling. Trends Plant Sci.. 6: 520-527.