Abstract
Germplasm screening is time-consuming, labor-intensive, and expensive. Therefore, it is important to develop the most effective selection method for plant breeding and genetic studies. Herein, experiments were conducted to determine the optimal growth stage and application dose of bentazone based on the response of soybeans. The influence of soybean accessions, application doses (0X, 1X and 2X), and growth stages (VC, V1, V2) on plant injury and growth performance was examined. Leaf injury and growth performance were significantly influenced by accession, dose, and growth stage. There was a substantial difference of 2%-3% and 23%-31% in leaf necrosis between the tolerant and susceptible groups, respectively. The mean leaf necrosis and visual scores for the VC, V1, and V2 stages showed a similar pattern, with a non-significant difference. The effect of accessions on plant height, fresh weight, and dry weight reduction had no significant difference in all growth stages. No significant differences in necrosis were found in the tolerant accessions across bentazone doses, while significant differences were found in the susceptible accessions. The leaf necrosis from 2X bentazone was almost double that of 1X treatment. However, there was no difference in visual scores between the 1X and 2X doses. In addition, the visual scores showed no difference between the 1X and 2X doses within the growth stages. The application of 1X dose bentazone at the V1 stage is suitable to determine tolerant and susceptible soybeans. This result can help determine the genotypes for breeding and genetic studies.
-
Key words: Bentazone, Growth stage, Herbicide, Leaf necrosis, Soybean
INTRODUCTION
Chemical herbicides are the cheapest and the most straightforward and successful method used to control weed invasion compared to other traditional and contemporary tactics (
Fartyal et al. 2018). Herbicide-tole-rant or resistant crops can be a key resource, as they allow for post-emergent (POST) herbicide application in crops with less risk for crop injury. In addition, they provided an alternative mode of action to control the weeds that emerge alongside or following crop emergence (
Carter et al. 2007;
Byker et al. 2017). The introduction of herbicide-resistant crops has extended the scope of herbicide application and resulted in a major shift in how herbicides are used in many crops (
Nakka et al. 2019). The main benefit of her-bicide-resistant crops is the avoidance of damage caused by herbicides. Additional advantages include improved weed management, which results in higher yield stands, reduced costs, and fewer application limitations (
Samal et al. 2020).
There are several effective POST herbicides for soybeans available on the market (
Byker et al. 2017). Imazethapy, imazamox, acifluorfen, fomesafen, metola-chlor, and bentazone are some POST alternatives that may be used in soybean fields (
Oliveira et al. 2017;
Ali et al. 2020). Among them, bentazone [3-isopropyl-1H-2,1,3-be-nzo-thia-diazin-4(3H)-one 2,2-dioxide] is an effective herbicide used for POST application against several broadleaf weeds and sedges in soybeans (
Ali et al. 2020;
Kato et al. 2020). Compared to other broadleaf herbicides, the application of bentazone produces less leaf injury and yield reduction in soybeans (
Ali et al. 2020). Bentazone responses to soybean plants were classified into three types: tolerant, moderately sensitive, and highly sensitive (
Tachibana et al. 2006). While bentazone application causes minor injuries in tolerant soybean cultivars, plants gradually recover with growth, resulting in a marginal reduction in yield (
Kapusta et al. 1986).
Several previous studies reported the varying effects of bentazone according to the growth stages of soybeans.
Wax et al. (1974) studied the effects of bentazone application on a tolerant soybean cultivar ‘Beeson’ to evaluate the injury at three developmental stages: unifoliate (VC), first trifoliate (V1), and second trifoliate (V2) in the field and discovered that VC and V1 suffered more visual damage compared to the V2 stage. At V2-3 trifoliate and V5-6 trifoliate stages, the responses of 24 soybean cultivars to bentazone were examined to evaluate the initial phytotoxicity and growth or yield in the field, and it was concluded that earlier stages are more susceptible (
Tachibana et al. 2006). In another field experiment, bentazone was sprayed on soybeans at four different developmental stages (V3, V6, V7, and V9) to determine the optimal time to spray herbicides to control broadleaf weeds. It was discovered that spraying at V3 was more effective than spraying at V9 (
Ishibashi et al. 2013). According to Anderson
et al. (1974), the POST application of bentazone on soybeans and weeds at the VC, V1, and V2 stages showed that the V1 stage was the most effective to have a higher yield performance and to suppress the growth of broadleaf weeds.
In field tests, soybeans were assayed at various growth stages for bentazone response.
Wax et al. (1974) evaluated the phytotoxicity of bentazone to 338 U.S. and Canadian soybean germplasms, including several others, at the V1 stage. The impact of bentazone treatment on 114 cultivars and 145 RIL of soybean was evaluated using bentazone treatment at V3 to V4 stages (
Kato et al. 2020).
Ali et al. (2020) tested 410 cultured soybeans, 384 wild soybeans (
Glycine soja Sieb. and Zucc.), and 1,300 mutant lines at the V2 stage to identify tolerant and sensitive lines.
Few information is available about bentazone dose-in-duced soybean injury at different growth stages. To determine the reaction of genotypes in soybean breeding, it is necessary to determine the growth stage and bentazone doses through various traits with repeated tests. The objectives of this study were to investigate the performance of tolerant and susceptible soybean accessions in terms of growth stages and bentazone doses on foliar injury and growth performance and to determine the optimal growth stage and application dose of bentazone.
MATERIALS AND METHODS
Experiment 1 (Evaluation of screening state of bentazone reaction)
Soybean accessions and bentazone doses
Experiments were conducted at the Kyungpook National University, Daegu, Republic of Korea in 2020 to 2021. Six soybean accessions were chosen from a prior bentazone screening of 430 Korean core collections of cultivated soybeans, including two tolerant accessions (CMJ091 and CMJ416), two moderately tolerant accessions (Daepung and Williams 82), and two susceptible accessions (CMJ169 and Hannam). The six accessions were planted in two replication in a 50-hole plastic tray (10 holes long, five rows wide) containing horticulture soil (Hanareum, Shinsung Mineral, South Korea). Each seed of accessions was planted in the five holes of a row at a depth of 2 cm and thinned to a single seedling after germination. These five plants of each accession in a row represent one replication. The experimental design was a complete block design with three factors: soybean accessions, bentazone doses, and growth stages. Bentazone, Basagran
® (a.i. bentazone 40%), was sprayed to soybean plants at a standard field-recommended rate (1X, 1200 grams a.i. per ha) and doubled rate (2X) throughout the VC, V1, and V2 developmental stages (
Fehr et al. 1971). The 0X treatment as control was used as distilled water to each genotype in experiment 1. Within each replication, a control was included to serve as a basis for comparison. The herbicide was sprayed on the top of the plants using a handheld manual sprayer (Sumato compression sprayer, MJ Korea Co., Ltd.).
Visual score and leaf necrosis measurement
The visual injury was scored at five days after treatment (DAT) when there was a maximum injury symptom on the leaves of the reference sensitive genotypes (Suwon 98 and PI 97150) (
Ali et al. 2020). The visual scoring scale was based on the area of leaf burns. A phenotypic scoring scale (1-5) was used to evaluate the tolerance of the accessions (
Fig. 1).
On this scale, the represented scores were: 1, no apparent burn spots; 2, few burn spots appeared on the plant leaves, but the plant displayed an average growth; 3, less than half of the plant leaves showed prominent burn spots, and plant growth was slightly affected; 4, more than half of the plant leaves showed noticeable burn spots, and plant growth was seriously affected; and 5, the plant leaves of the whole soybean showed large areas of burn spots and withered.
The average leaf scorch score for each accession was calculated using the following formula:
Average leaf injury = ∑ (LSSi) (Number of plants)/Total number of plants per replication, where LSSi is the level of leaf injury score. Accessions with a visual score of < 2.0, 2.0-3.5, and > 3.5 were considered tolerant, moderately tolerant, and sensitive, respectively.
Following the visual assessment on five DAT, one unifoliate leaf at the VC stage, the first trifoliate leaf from V1 stage, and the second trifoliate leaf from each plant at the V2 stages were taken to generate digital images for leaf necrosis estimation (
Fig. 2-
4). Leaf samples were collected from each of the five plants in each replication of each accession. The leaves were scanned using a flatbed scanner (Samsung SCX-3405 Laser Multifunction) as soon as they were collected to create digital photographs. The percentage leaf necrosis of the bentazone-treated and control plants was analyzed from the digital images using an open-source software, “Leaf necrosis classifier” (Leaf necrosis classifier,
https://lnc.proteomics.ceitec.cz/tutorial). This software worked in a two-step process. The first phase was the creation of a data set using the treated plant's leaf images by indicating the healthy leaf area, damaged leaf area, and image background. The second phase was called the training and evaluation phase, where all images were evaluated based on the previously generated data set in the first phase. It was capable of automatically analyzing a collection of images and providing a quantitative assessment of the percentage of healthy and affected leaves in the samples, as well as a paired output of the original image and segregated out the affected areas overlapped with a red color (
Fig. 2-
4).
Plant height and above-ground fresh weight were measured at 14 DAT from both the control and treated plants. A ruler was used to measure the height of the plants from the ground to the base of the latest fully developed node. The fresh weight of each plant was measured using an electric balance (Sartorius BS2202S, Germany). To determine the dry weight of the plants, samples were dried in an electric oven. To get reliable results, three independent experiments were conducted in May 2020, May 2021, and June 2021.
Experiment 2 (Validation test)
A validation test was conducted in August 2021 to confirm the growth stage and bentazone dose for reactions of tolerant, moderately tolerant, and susceptible accessions. Ten soybean accessions of each category (tolerant, moderately tolerant, and susceptible) (Supplementary
Table 1) were planted in a plastic tray in two replications. A control was included in each replication to serve as a basis for comparison. The planting methods and design were the same as that described in experiment 1. At the V1 growth stage, the plants in each responsive group were treated with 1X bentazone. Leaf necrosis analysis, visual scoring, and other growth characteristics measurements were identical to those in the previous experiment.
Statistical analysis
Analysis of variance was done for all the parameters using SAS 9.4 with PROC GLM (SAS Institute, Cary, NC, USA, 20132013). With the “LSD.test” function in R, a least significant difference analysis was performed to determine whether there were significant differences across the genotypes, doses, and growth stages for the assessed traits. The Pearson correlation coefficient was calculated and visualized in R using the “Performance Analytics” package (Carl
et al. 2010;
https://CRAN. R-project.org/package=PerformanceAnalytics).
RESULTS
In this study, the visual injury observed from bentazone doses includes chlorosis, necrosis, and drying of leaves. The severity of leaf injury in this study was influenced by soybean accessions, bentazone doses, and growth stages. The testing time was not significant for leaf necrosis and visual scores, but it was significant for plant height, fresh weight, and dry weight (Supplementary
Table 2). The accessions, bentazone doses, and growth stages had significant (
P < 0.001) effects for all the measured phenotypes. The analysis of variance revealed a significant interaction (
P < 0.05) between accessions and growth stages, accessions and bentazone doses, and growth stages and bentazone doses for all the measured traits, except for fresh weight in growth stages by bentazone dose interaction.
The analysis of variance showed a significant effect of accessions, bentazone doses, and their interaction to all characteristics examined (
P < 0.0001). The accessions influenced the leaf necrosis, and there was a substantial difference between the tolerant and susceptible groups. The average necrosis of the tolerant accessions due to bentazone doses was 2.4% to 3.5%, compared to 4.8%-5.7% for the moderately tolerant and 22.8%-30.7% for the sensitive accessions (
Table 1). For all the accessions, leaf injury from 2X bentazone was almost double that of treated with 1X bentazone. No significant differences in necrosis in the tolerant accessions from all bentazone doses were found. Still, Williams 82, a moderately tolerant accession, had non-significant differences between the control and 1X dose, but there was a significant difference between the 1X and 2X doses. Another moderately tolerant accession, Daepung, had non-significant differences among the doses. However, the susceptible accessions had significant differences among all bentazone doses.
In comparison to the control, tolerant and moderately tolerant accessions, except Williams 82, had no significant difference in leaf injury from the doses; however, the susceptible accessions had more damage when exposed to 2X than those exposed to 1X dose. Overall, the 2X dose caused almost 10 times and twice more necrosis than the control and 1X dose, respectively.
The visual score of the susceptible accessions (3.5) was higher than that of the moderately tolerant (2.1 to 2.2) and tolerant groups (1.1 to 1.2). A significant difference in visual score was present when the 1X and 2X doses were applied to the CMJ091 (tolerant) and Williams 82 (moderately tolerant) accessions, while non-significant differences existed for susceptible accessions (
Table 1). The visual score index indicated that the tolerant genotypes had slightly increased visual scores than the control, whereas the moderately tolerant and sensitive genotypes had nearly triple and fivefold the visual scores of the control, respectively. Plant height reduction also increased with the increase in herbicide doses in all the accessions, irrespective of their tolerance. The plant height reduction for the tolerant, moderately tolerant, and susceptible accessions was 8%-14%, 7%-14%, and 11%-24%, respectively. Biomass production was also affected by the herbicide doses. Like the other traits, the biomass production of the herbicide-treated tolerant accessions was not significantly different from that of the control. However, a substantial difference was found in the sensitive accessions, especially when the herbicide dose was doubled (2X). The reduction in the fresh weight of the tolerant, moderately tolerant, and susceptible accessions was 7-18%, 15%-33%, and 30%-58%, respectively. The dry weight reduction also showed a similar pattern, with an order of susceptible > moderately tolerant > tolerant. The tolerant accessions had more average biomass compared to the susceptible accession.
The interaction of the accessions and growth stages was evaluated (
Table 2).
The leaf necrosis at the VC, V1, and V2 stages for the tolerant, moderately tolerant, and susceptible accessions showed a similar pattern, with non-significant differences among the three stages within an accession. However, the susceptible accessions had significantly higher leaf necrosis than the tolerant and moderately tolerant accessions in all growth stages. Average over bentazone doses and accessions, all three stages showed no difference in leaf necrosis; however, the V2 stage, which resulted in 13.4% leaf necrosis, showed a relatively higher score than the other stages (
Table 2). The tolerant accessions had the lowest visual scores (1.1 to 1.2), whereas the susceptible accessions had the highest (3.5), and the moderately tolerant accessions were in the intermediate (2.1 to 2.2).
The relative indices were 87, 84, and 89 for plant height, 66, 76, and 75 for fresh weight, and 66, 66, and 71 for dry weight for VC, V1, and V2, respectively. There was no significant difference in plant height reduction, fresh weight reduction, and dry weight reduction among the growth stages for overall means and within an accession.
Interaction effects of growth stages and herbicide bentazone doses
A significant interaction (
P < 0.01) was found between the growth stages and doses for all the traits studied, except fresh weight (Supplementary
Table 2). There was no significant difference in the mean leaf necrosis among the growth stages (
Table 2). Across the application stages, higher doses resulted in more leaf injury values. No differences were recognized between 1X and 2X doses for all the parameters measured within a growth stage. The plants treated with 1X bentazone exhibited a 12.2% leaf damage in the VC stage, whereas the leaf injury increased to 20.5% when 2X bentazone was used (
Table 3). The plants treated with 1X bentazone had necrosis levels that were nine, three, and seven times higher than those of the control plants at the VC, V1, and V2 stages, respectively. The plants treated with 2X rate had necrosis levels that were 15, 7, and 12 times higher than those of the control. No significant differences in visual scores and plant height persisted between the 1X and 2X doses for all the stages. The reduction in height increased with bentazone doses throughout the stage, with height reductions of 9% and 16% at the VC stage, 14% and 18% at the V1 stage, and 9% and 12% at the V2 stage for 1X and 2X doses, respectively (
Table 3). The fresh weight and dry weight also had a similar pattern of response for the growth stages by dose interaction.
The highest biomass values were observed in the control plants (0X) under the three developmental stages, followed by those in plants treated with 1X and 2X doses (
Table 3). No significant differences in fresh weight and dry weight were found within all the growth stages treated with 1X and 2X doses. The index for fresh weight and dry weight of plants treated with 1X and 2X doses at the V1 and V2 stages had a similar pattern. Throughout the stages, the dry weight of plats treated with 2X dose was decreased by around 10% compared to that of plants treated with 1X dose.
Based on experiment 1, it was suggested that 1X dose at the V1 stage would be optimal to screen the reaction of bentazone to soybeans. To validate the performance of the 1X treatment at the V1 stage that may be used to screen the reactions of soybeans to bentazone, a similar study was conducted using previously selected 30 soybean accessions composed of 10 from each category (tolerant, moderately tolerant, and susceptible) (Supplementary
Table 1).
The performance of 10 1X bentazone-treated tolerant accessions varied for all the traits studied. The leaf necrosis ranged from 0.6% to 4.3%, with a mean of 2.0%, for the tolerant group, 6.3% to 19.9%, with a mean of 10.7%, in the moderately tolerant group, and 23.4% to 48.0%, with an average of 35.8%, in the susceptible group. The average leaf necrosis in the tolerant group was significantly lower than that in the other two groups.
There was a significant difference in visual scores among the three groups. The visual scores of the tolerant, moderately tolerant, and susceptible accessions were 1.1 (1.0 to 1.3), 3.1 (2.6 to 3.7), and 4.6 (4.0 to 5.0), respectively.
The relative plant height compared with the control for the tolerant, moderately tolerant, and susceptible group was 92% (80% to 106%), 92% (81% to 99%), and 69% (55% to 89%), respectively. The mean reduction in plant height among the three groups was significantly different (
Table 4). Three accessions, CMJ342, CMJ091, and CMJ377, in the tolerant group showed less plant height reduction, while Nuriol, Pureun, and Pungsannamul of the moderate group had less reduction in plant height.
In the case of fresh weight, a significant difference was also recognized among the three groups. The mean changes in fresh weight were 80% (52%-146%) for the tolerant group, 64% (47%-91%) for the moderately tolerant group, and 29% (15%-88%) for the susceptible group.
Dry weight changes also showed a similar result. The mean changes in dry weight were 77% (51%-176%) for the tolerant group, 64% (47%-85%) for the moderately tolerant group, and 29% (18%-53%) for the susceptible group. Two accessions, CMJ342 and CMJ091, showed less biomass reduction in the tolerant group, and Nuriol, Pureun, and Pungsannamul also showed less reduction in biomass in the moderate group.
Correlation
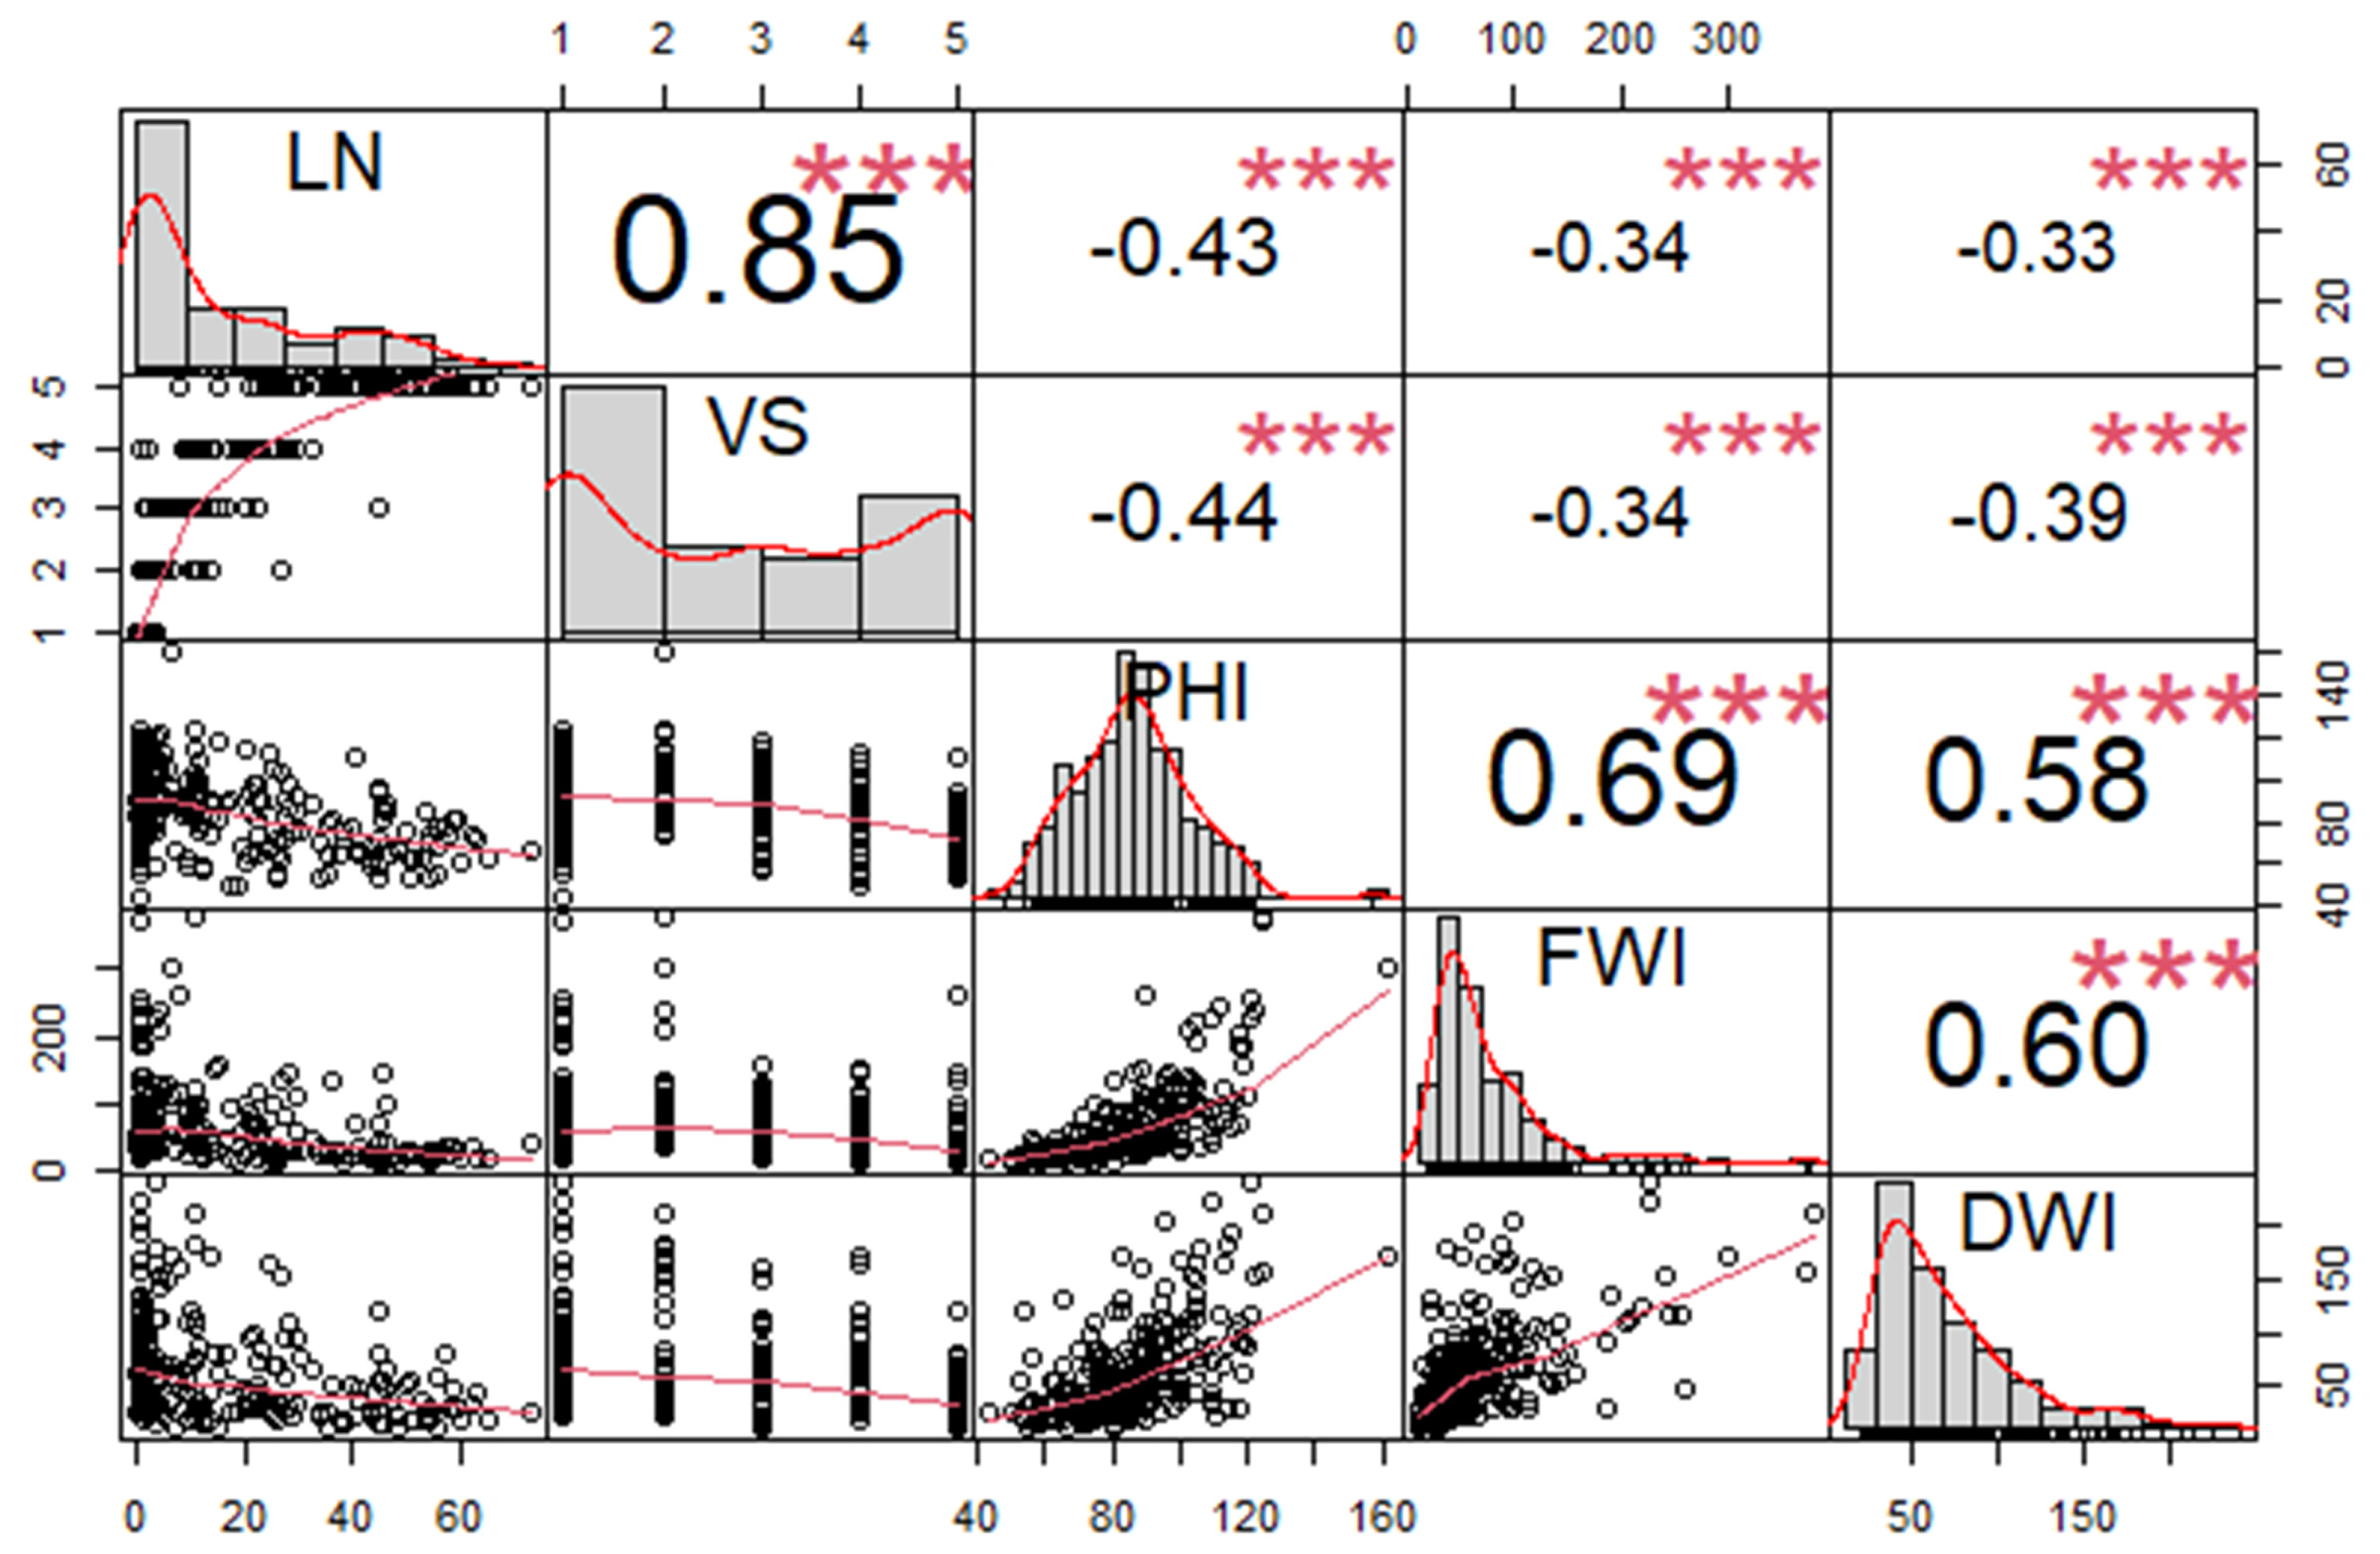
A correlation analysis was done to determine the degree to which the characteristics examined was related
(
Fig. 5). Leaf necrosis was significantly (r = 0.85,
P < 0.001) positively correlated with visual scores, but it was significantly negatively correlated with the remaining traits. Visual scores have a significant negative correlation with plant height indices (r = ‒0.44,
P < 0.001), fresh weight indices (r = ‒0.34,
P < 0.001), and dry weight indices (r = ‒0.39,
P < 0.001). Plant height indices showed a significantly positive correlation with fresh weight indices (r = 0.69,
P < 0.001) and dry weight indices (r = 0.58,
P < 0.001). The fresh and dry weight indices were also significantly (r = 0.60,
P < 0.001) positively correlated. Moreover, the results of the correlation indicate a good agreement of leaf injury with other measurements.
DISCUSSION
The determination of bentazone reaction among soybean accessions is needed to develop soybean accessions with bentazone tolerance. Germplasm screening is time-consuming, labor-intensive, and expensive; therefore, it is very important to develop the most effective selection method for plant breeding and genetic studies. Here, an experiment was conducted to suggest a suitable screening stage and bentazone dose with agronomic traits and leaf injury from image analysis. In the selection breeding lines and in the discrimination of tolerant and susceptible accessions, visual scoring is the most commonly used (Anderson
et al. 1974;
Wax et al. 1974;
Tachibana et al. 2006;
Lee et al., 2008;
Ishibashi et al., 2013;
Oh et al. 2018;
Ali et al. 2020).
Image analysis is a quantitative technique used to assess plant health that may be compared to appropriate controls. The image analysis-based method was utilized to categorize a wide range of biotic and abiotic foliar stressors in soybean leaflets, thus minimizing the possibility of visual phenotypic misclassification. This practice has gained popularity due to its high accuracy, low instrumentation cost, and less labor-intensive nature. Nowadays, imaging-based phenotyping is extensively employed to detect stress-resistant plants early and to precisely phenotype a large number of individuals to find the underlying genes for stress tolerance (
Khirade and Patil 2015;
Begum et al. 2020;
Kim et al. 2021).
Correlation analysis was conducted to see the relationship among the traits (
Fig. 5). Leaf necrosis was significantly correlated (r = 0.85,
P < 0.001) with visual scores. Leaf necrosis and visual scores were also significantly correlated to plant height and biomass traits. These results meant that leaf necrosis based on image analysis and visual scoring can be used for the discrimination of bentazone reactions in soybeans.
Leaf necrosis varied with the herbicide dose, growth stage, and soybean accessions. Accession by dose showed a significant interaction (
P < 0.0001) on leaf necrosis at five DAT. The leaf necrosis from 2X dose was almost twice that from 1X dose for tolerant, moderately tolerant, and susceptible accessions (
Table 1). Tolerant and moderately tolerant accessions between 1X and 2X doses showed no difference in leaf necrosis; however, susceptible accessions showed an abundance of leaf necrosis occurrences as the dose of bentazone increased. Most tested accessions in 1X and 2X doses showed similar visual scores. Therefore, based on leaf necrosis and visual scores, 1X bentazone was toxic enough to induce foliar damage, and it can be used to distinguish tolerant and susceptible accessions.
Other researchers also reported that higher doses produced more leaf injury when soybean plants were treated with dicamba and metribuzin (
McCown et al. 2018;
Stephenson et al. 2018). The influence of genotypes on the injury was also significant because tolerant accessions produce significantly less necrosis than sensitive accessions. A similar finding was also reported when glyphosate was used with other POST herbicide tank mixtures on soybeans; tolerant accessions exhibit less visual damage than sensitive crops (
Nelson and Renner 2001).
There was no difference in leaf necrosis and visual scores among the growth stages within the accessions (
Table 2), and no difference was also recognized between 1X and 2X doses within the growth stages for leaf necrosis and visual scores. This result means that any early stages can be used to screen tolerance and susceptible genotypes. However, the VC stage only shows two unifoliate leaves (
Fehr et al. 1971), and sometimes, seeds could not produce normal unifoliate. Therefore, to observe enough symptoms from bentazone, using at least V1 stage soybeans is recommended.
Based on the dose-response and growth stage interaction results, it was concluded that 1X bentazone at V1 stage was enough to see proper symptoms for selection. To confirm this, a validation test was conducted (
Table 4). Soybean accessions with known reactions to bentazone based on our previous screening with visual scoring were used (not published data). The visual scores ranged from 1.0 to 1.2 for the tolerant group, 2.9 to 3.7 for the moderate group, and 4.0 to 5.0 for the susceptible group. This was well-matched with our criteria; the accession with a visual score of < 2.0, 2.0-3.5, and > 3.5 was considered tolerant, moderately tolerant, and sensitive, respectively. Based on visual scores, leaf necrosis mostly showed lower values in the tolerant group than that in the moderately tolerant and susceptible groups. However, four accessions (Jungmo3009, Dagi, Heugmi, and Uram) in the moderately tolerant group did not show a difference with those in the tolerant group. For example, Jungmo3009 showed no difference with CMJ042, CMJ377, CMJ091, Namhae, and Socheong for leaf necrosis. This result suggested that it is desirable to use leaf necrosis and visual scores to determine the bentazone reactions in soybeans.
The leaf necrosis in tolerant accessions from experiment 1 varied between 2.4% and 3.5% (
Table 1), which falls within the range (0.6%-4.3%) of tolerant accessions from our validation study (
Table 4). However, the percent leaf necrosis of moderately tolerant and sensitive accessions ranges from 6.3% to 19.9% and 23.4% to 48.0%, respectively, which were higher than the necrosis in a preliminary study. These differences may be due to the differential responses of the different genotypes and environmental conditions in the two experiments. Compared to the preliminary stage test, there was a little high temperature and humidity during the validation study, especially from the days of bentazone treatment to visual scoring and leaf necrosis analysis. This may result in a slight rise in visual scores and plant height in all three groups of soybean accessions. Several previous studies also reported that herbicidal activity increases with increasing temperature and humidity (
Wichert et al. 1992;
Park et al. 2021). The biomass production of all three genotypes in the validation test was in the same range as that in the preliminary test.
In conclusion, the treatment with 1X bentazone at the V1 growth stage is suitable to screen soybean accessions for bentazone reaction. This result can be used to determine accessions and improve the efficiency of breeding and genetic studies for bentazone reactions.
ACKNOWLEDGMENTS
This research was supported by Kyungpook National University Development Project Research Fund, 2018.
Supplemental Materials
Fig. 1Visual scoring scale for phenotypic evaluation of the bentazone reaction of soybean; 1-no apparent burn spots; 2-a few burn spots appeared on the leaves of the plant, but the plant displayed average growth; 3-less than half of the plant leaves had prominent burn spots, and the plant growth was slightly affected; 4-more than half of the plant leaves showed noticeable burn spots, and plant growth was seriously affected; 5-plant leaves of the whole soybean line showed large areas of burn spots and withered.
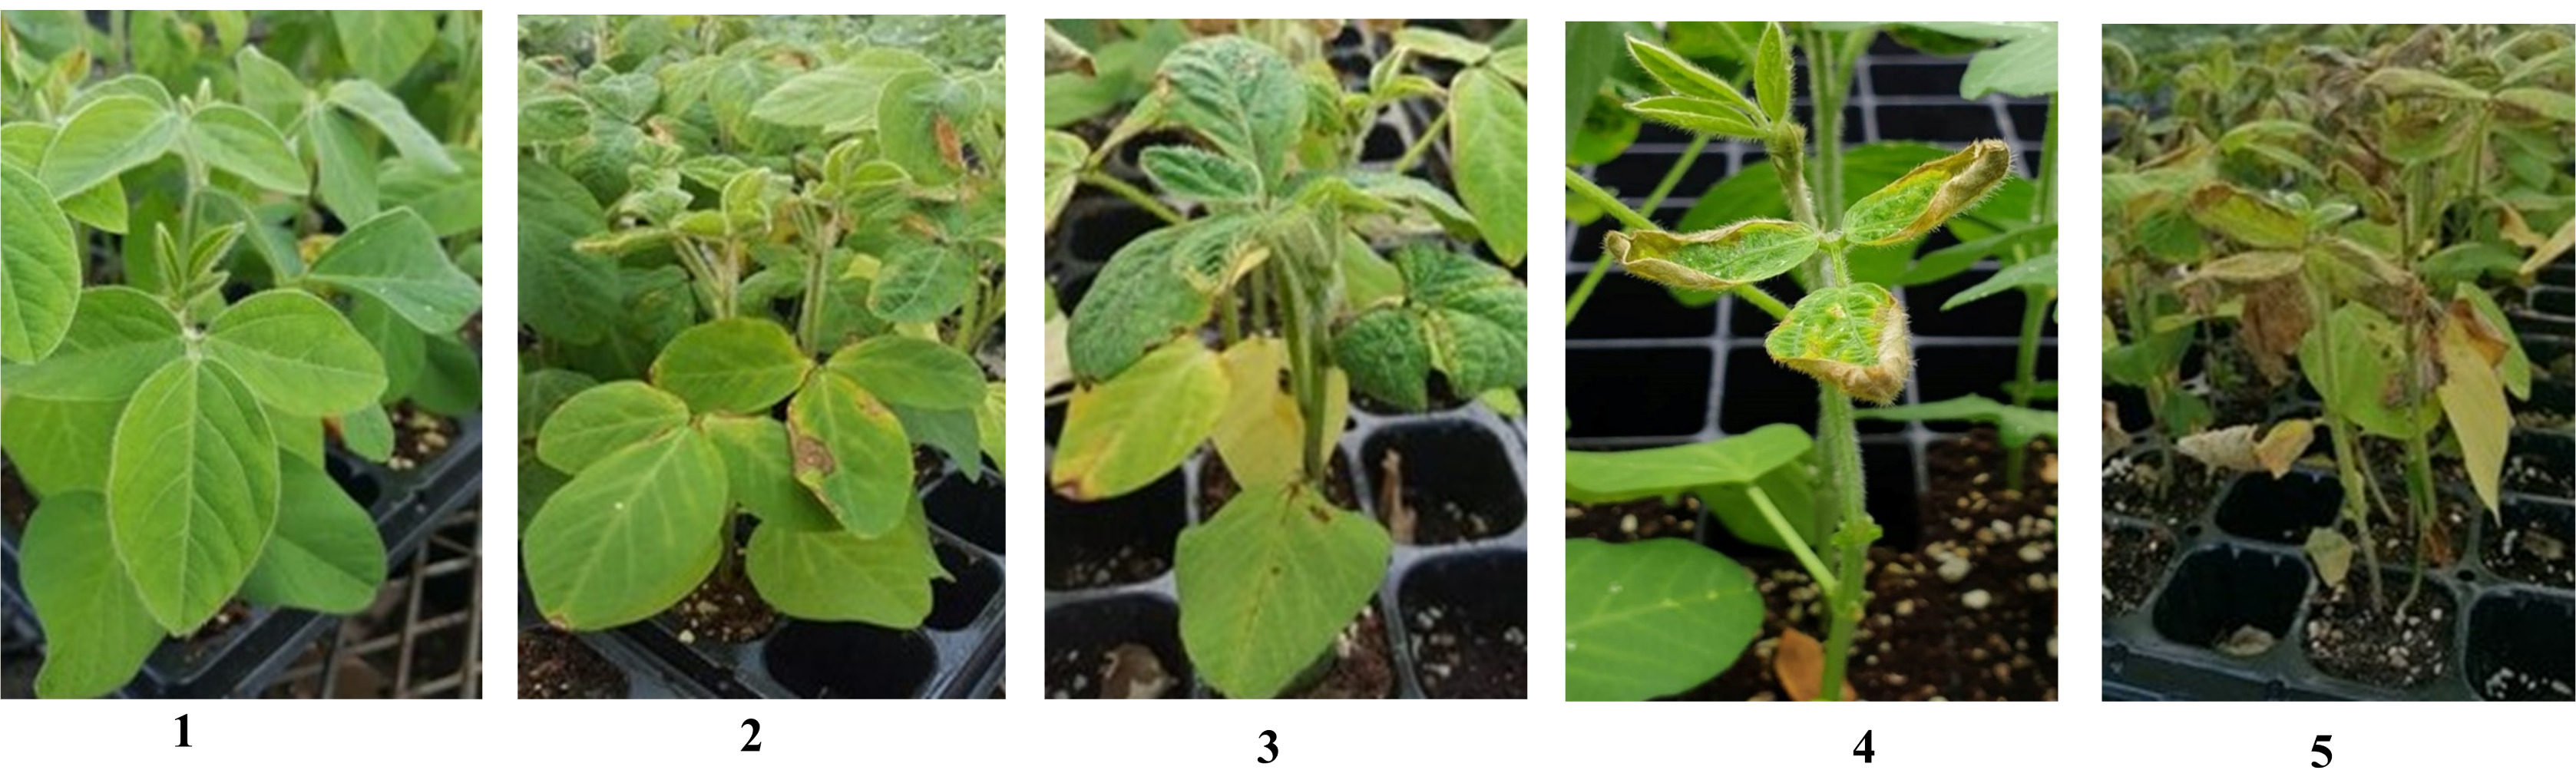
Fig. 2Image of leaf necrosis of bentazone treated soybean accessions at the VC growth stage. The digit inside the box indicates percent necrosis of that specific leaf. The leaflet pairs in each box represent scanned leaf images with bentazone injury symptoms before segmentation (upper one) and the damaged area segmented (lower one) by the leaf necrosis classifier. The red area indicates the necrotic region of the leaf. T, MT and S stand for soybean accession with tolerant, moderately tolerant and susceptible, respectively.
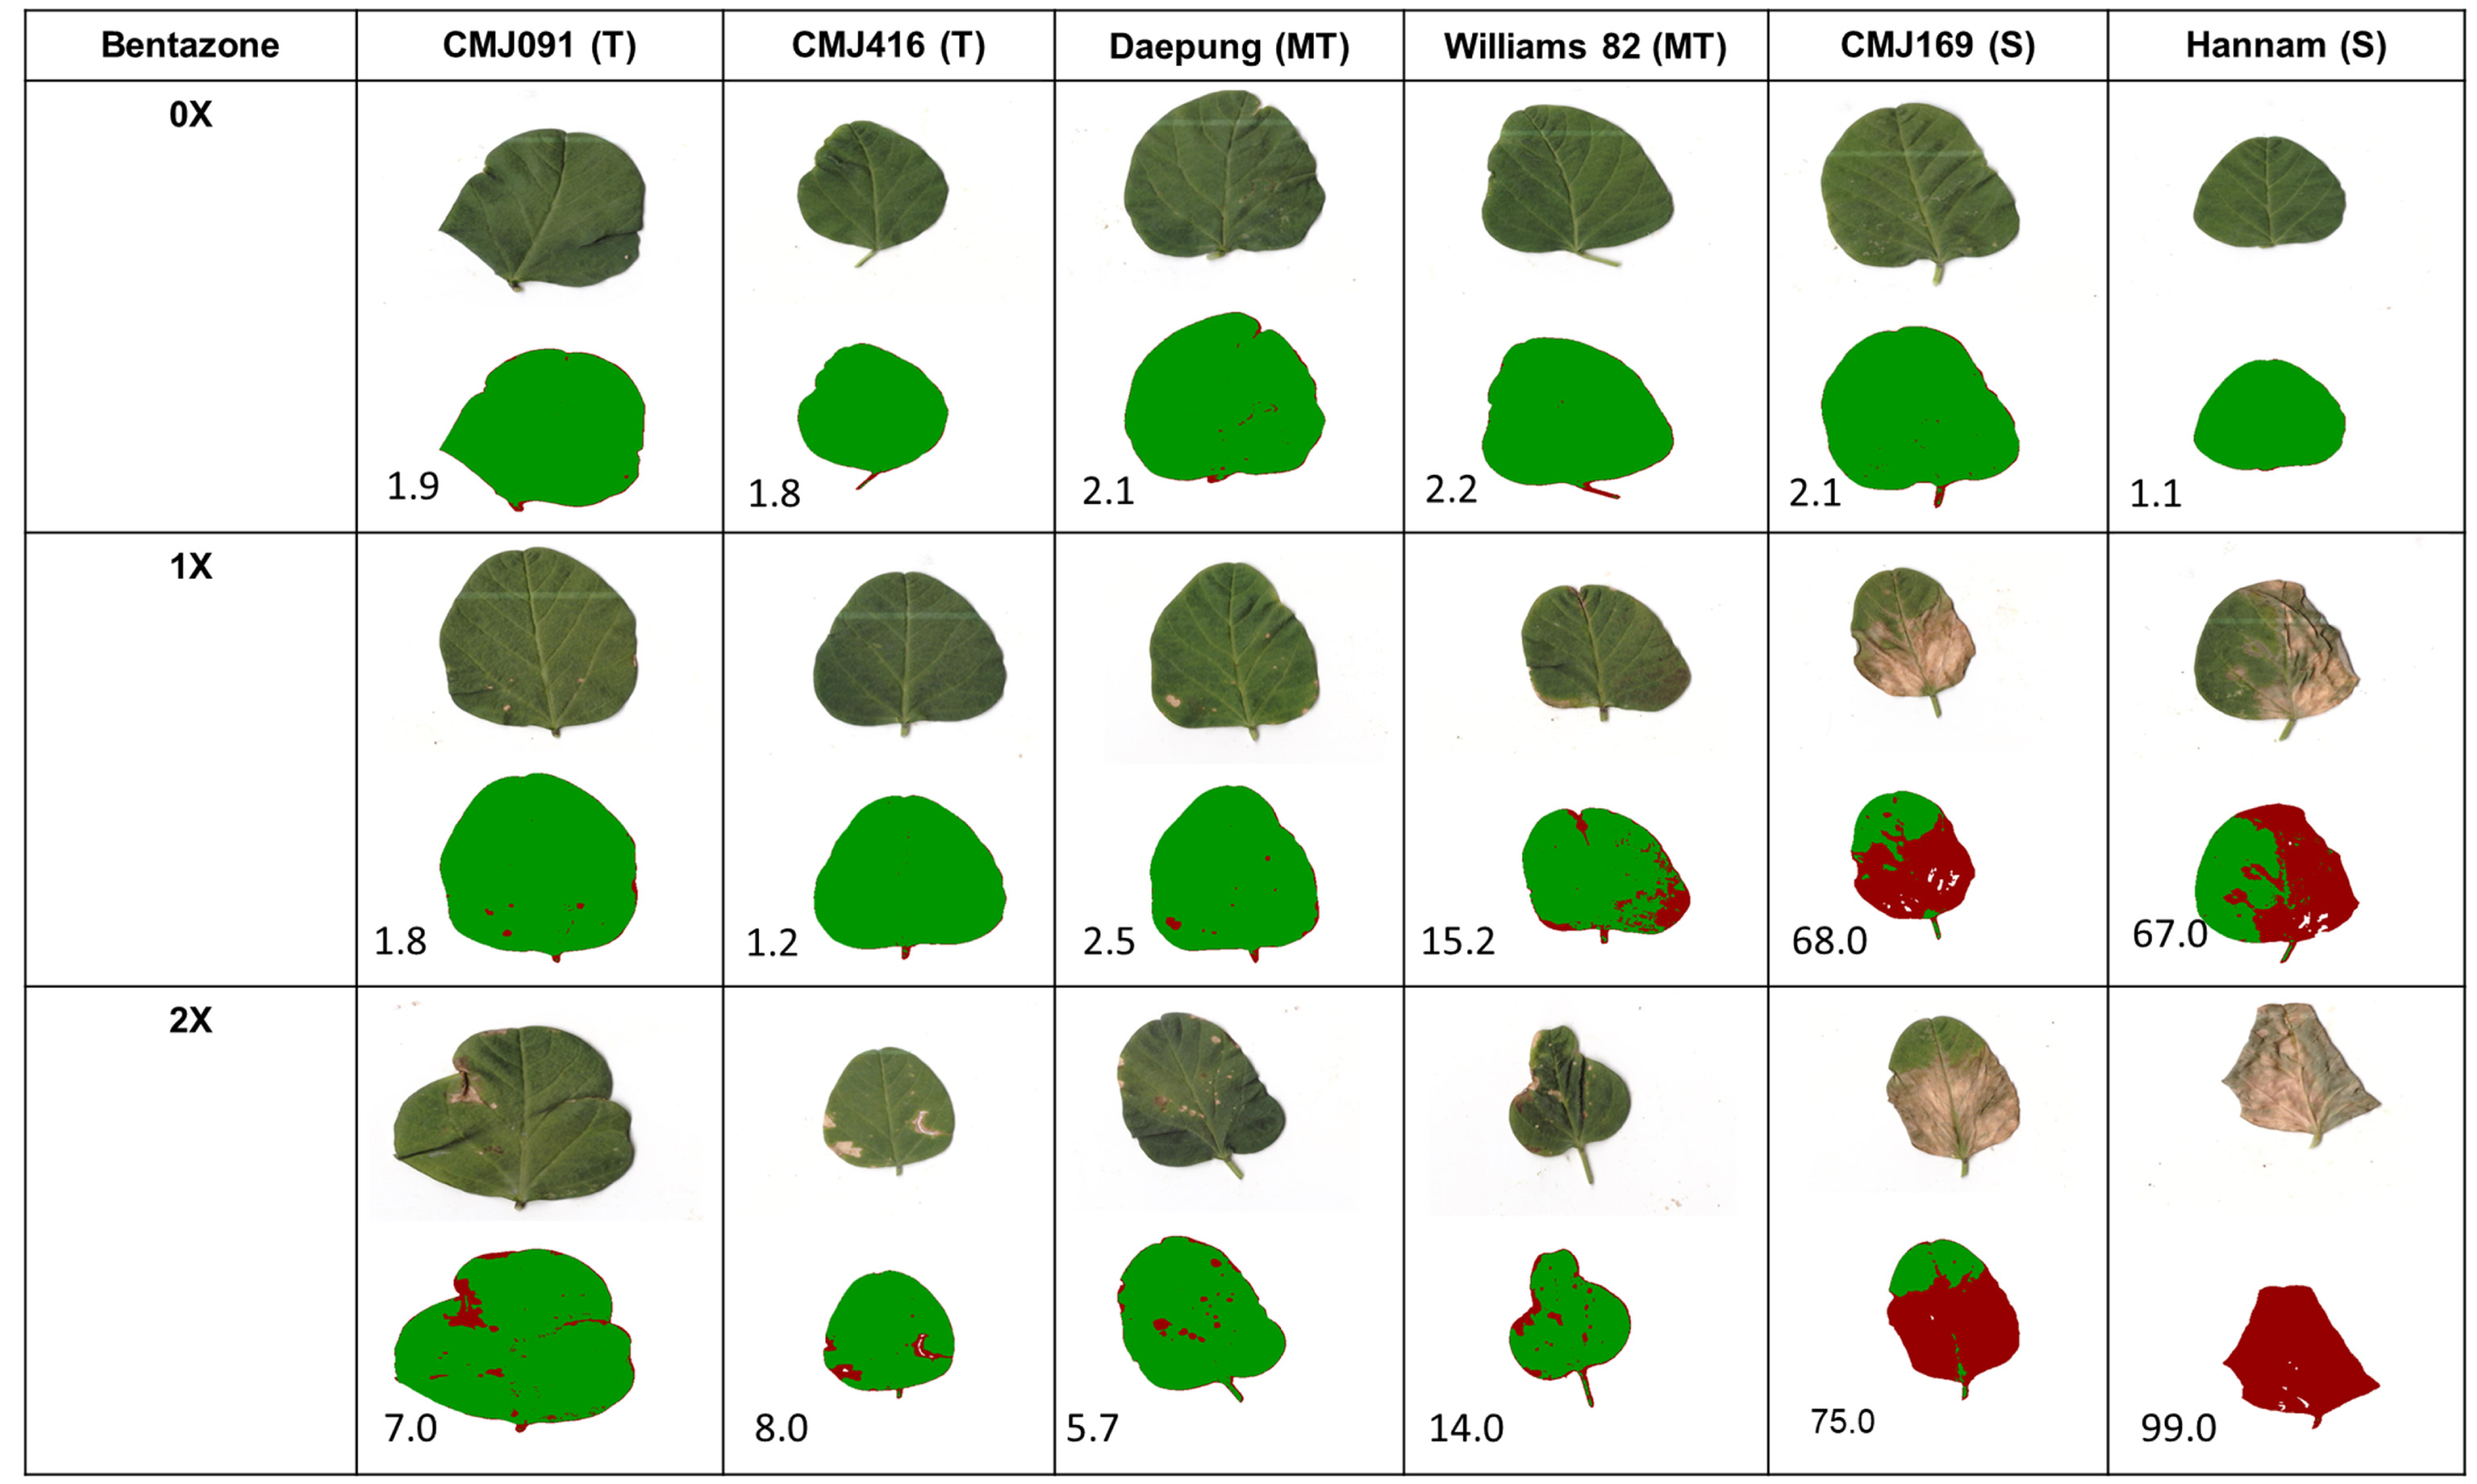
Fig. 3Image of leaf necrosis of bentazone treated soybean genotypes at the V1 growth stage. The digit inside the box indicates percent necrosis of that specific leaf. The leaflet pairs in each box represent scanned leaf images with bentazone injury symptoms before segmentation (upper one) and the damaged area segmented out (lower one) by leaf necrosis classifier. The red area indicates the necrotic region of the leaf. T, MT and S stand for soybean accession with tolerant, moderately tolerant and susceptible, respectively.
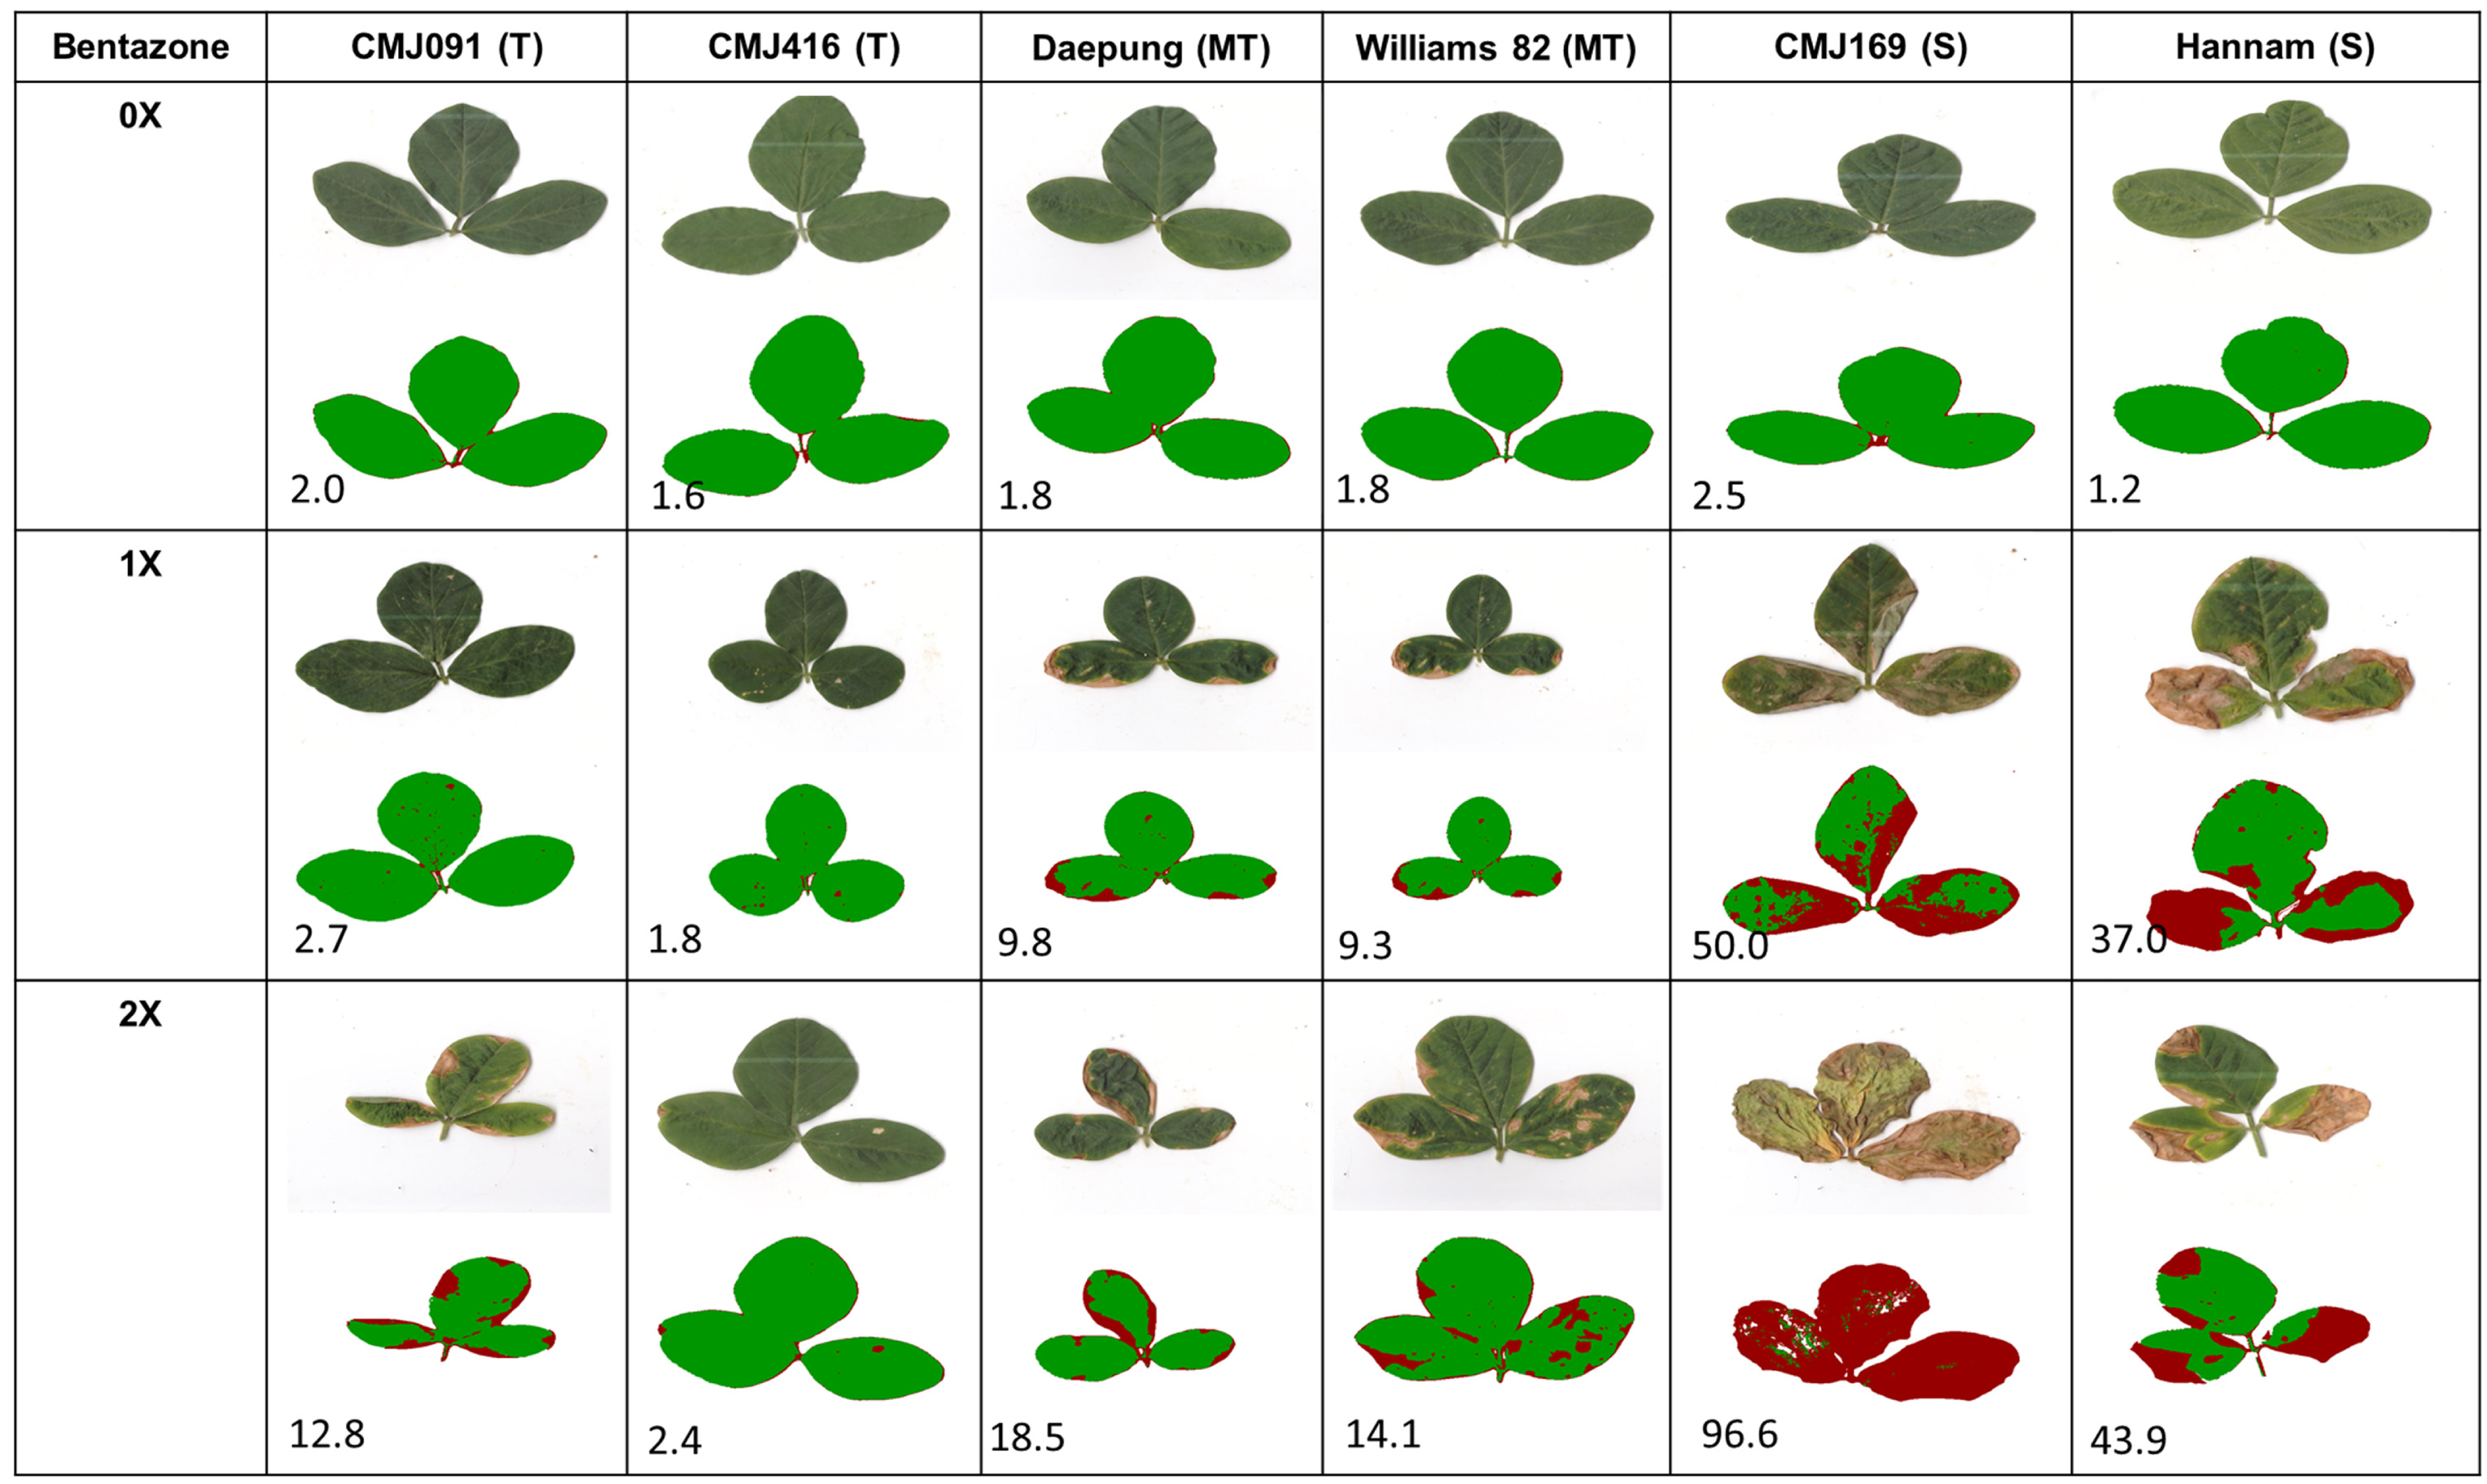
Fig. 4Image leaf necrosis of bentazone treated soybean genotypes at the V2 growth stage. The digit inside the box indicates percent necrosis of that specific leaf. The leaflet pairs in each box represent scanned leaf images with bentazone injury symptoms before segmentation (upper one) and the damaged area segmented out (lower one) by leaf necrosis classifier. The red area indicates the necrotic region of the leaf. T, MT and S stand for soybean accession with tolerant, moderately tolerant and susceptible, respectively.
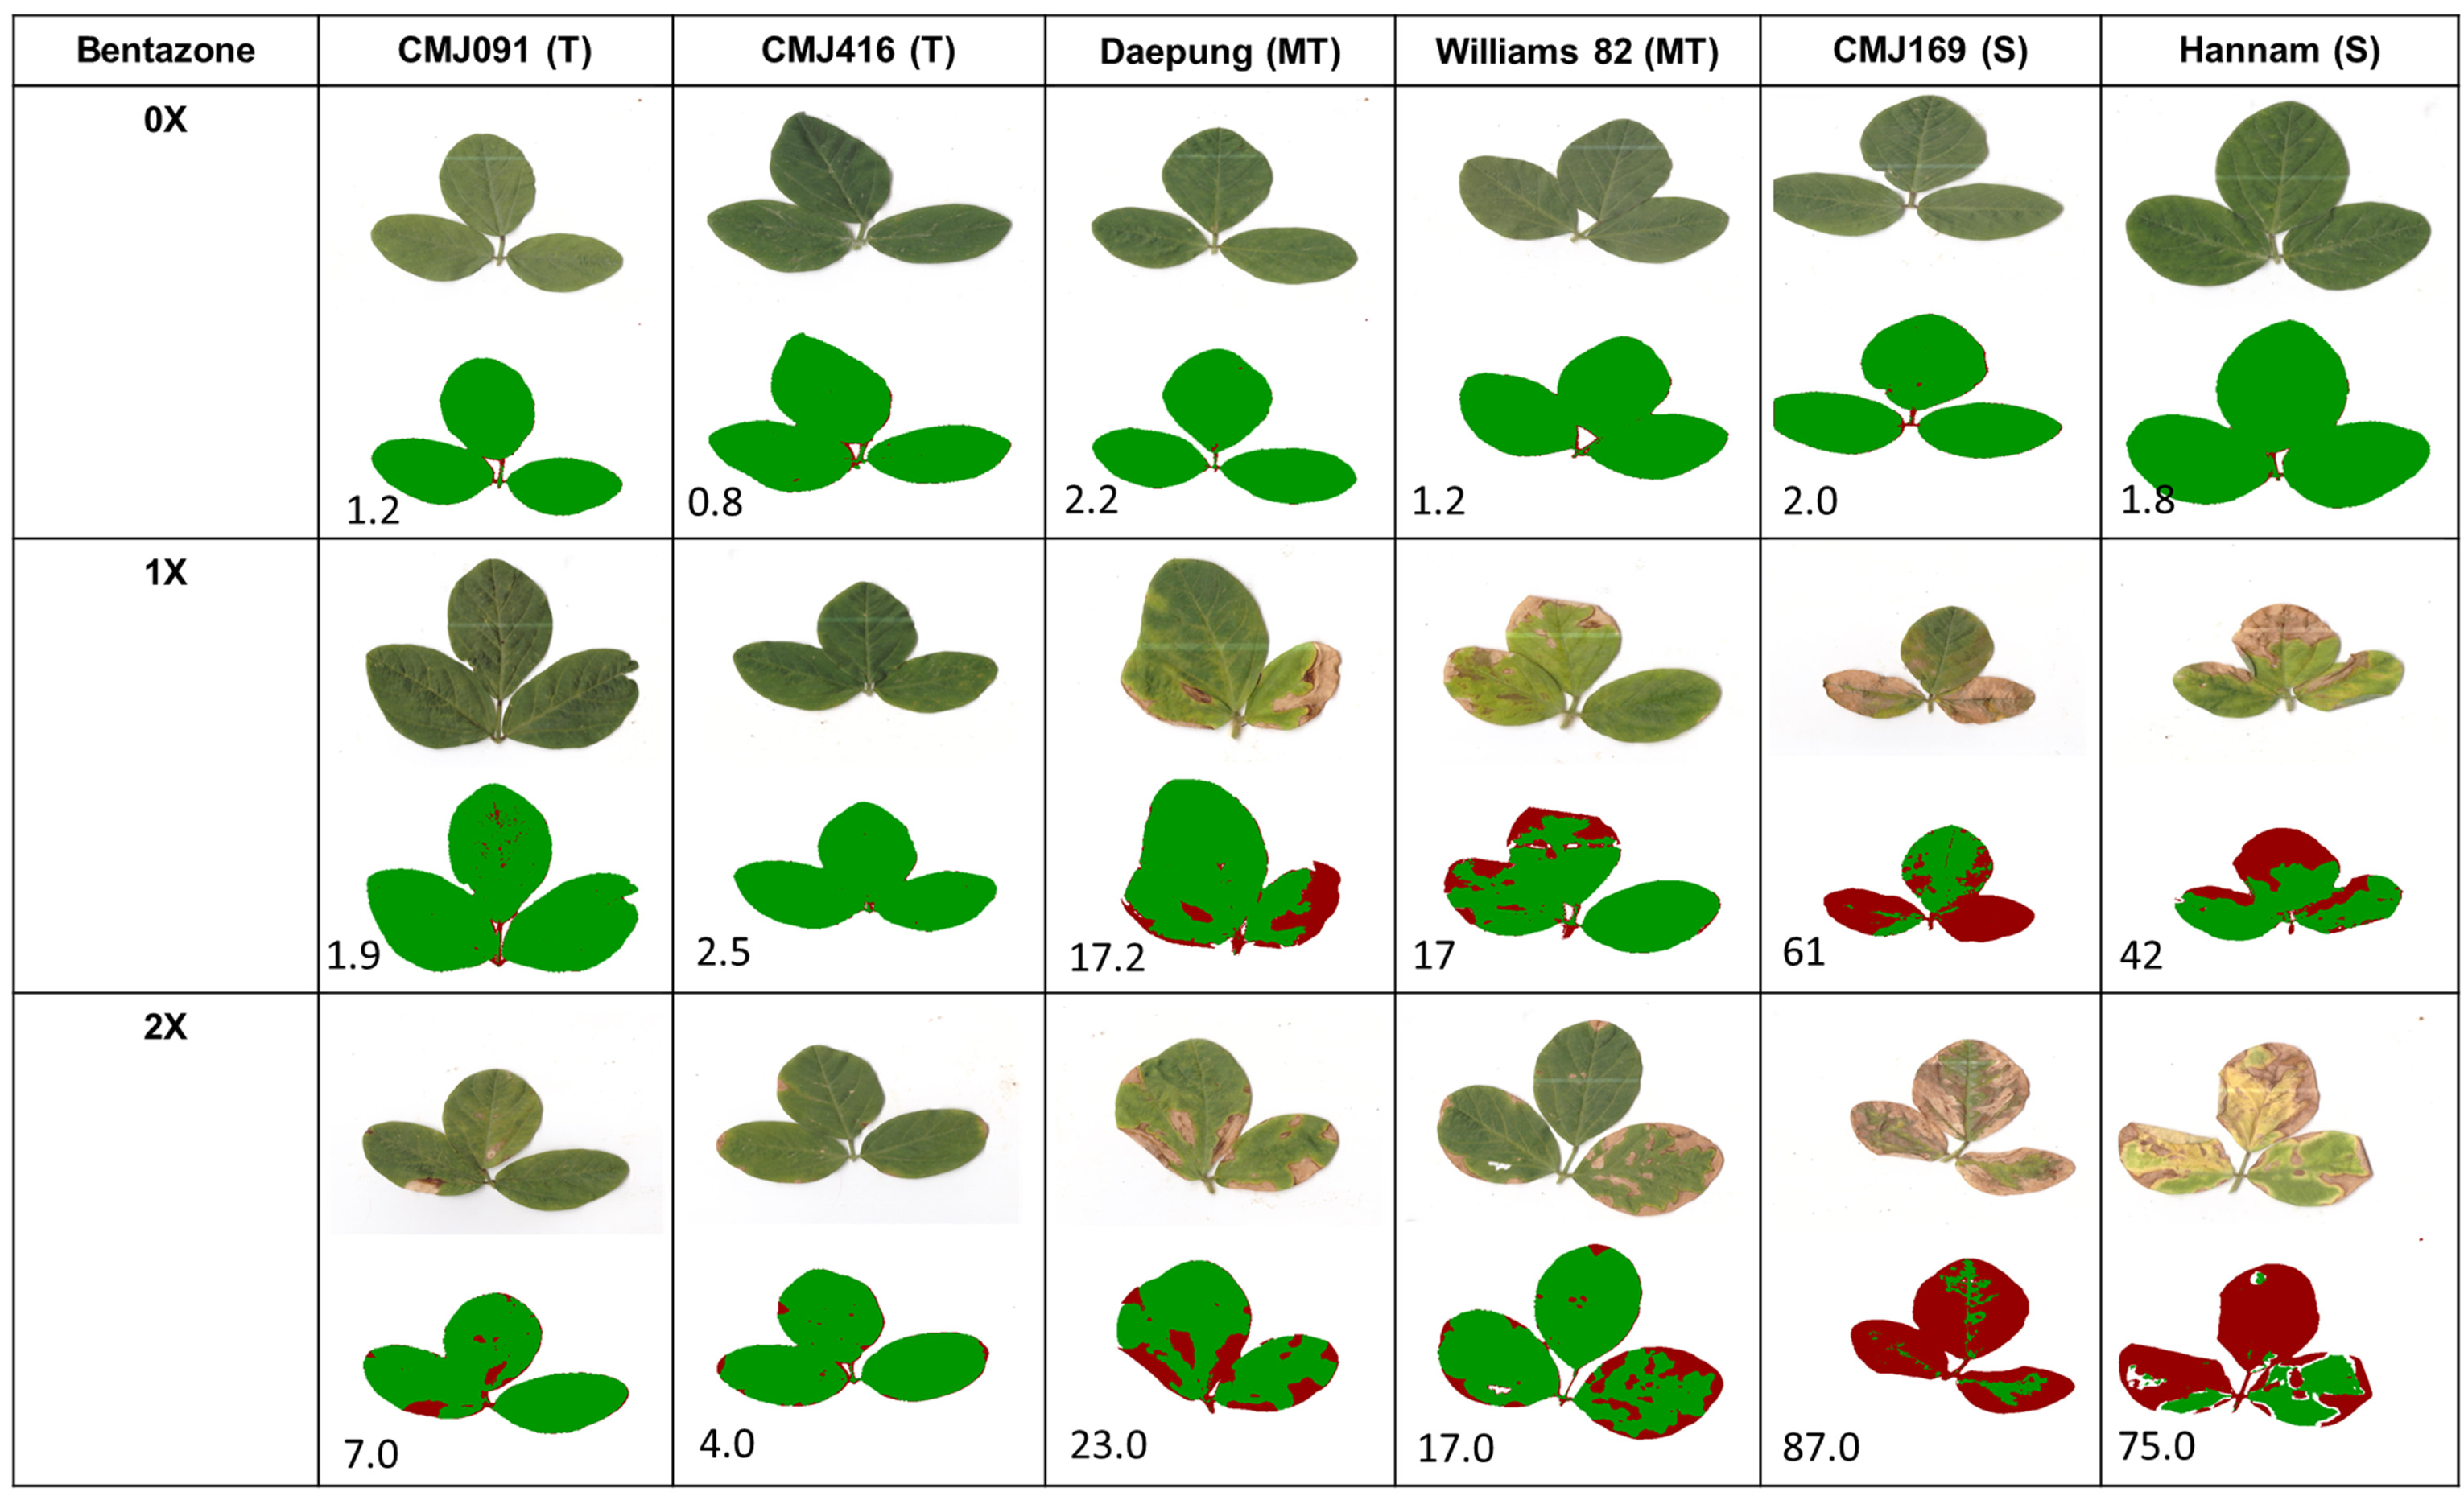
Fig. 5Pearson’s correlation coefficients (r) describing associations of leaf necrosis (LN), visual score (VS), plant height index (PHI), fresh weight index (FWI), and dry weight index (DWI) of bentazone-treated plants. The diagonal line shows the distribution of the five traits. The bivariate scatters plot with fitted lines is displayed below the diagonal line. The correlation coefficient and significant difference are shown above the diagonal line, and the higher the correlation coefficient, the bigger the numerical number. The *** indicates a significant difference at P < 0.001.

Table 1The interaction effects of soybean accessions and bentazone doses on leaf necrosis, visual score, plant height, fresh weight, and dry weight of soybean.
Table 1
|
Genotype |
Bentazone
dose |
Leaf necrosis |
|
Visual score |
|
Plant height |
|
Fresh weight |
|
Dry weight |
|
(%) |
Indexw)
|
(1-5)v)
|
Index |
(cm) |
Index |
(g) |
Index |
(g) |
Index |
|
CMJ091 |
0X |
2.1dez)
|
100 |
|
1.0g |
100 |
|
19.4a |
100 |
|
3.80a |
100 |
|
0.98a |
100 |
|
1X |
2.5de |
116 |
|
1.4f |
140 |
|
17.8ab |
92 |
|
3.28abc |
86 |
|
0.83abc |
85 |
|
2X |
5.8de |
275 |
|
1.4e |
136 |
|
17.0ab |
86 |
|
3.13abc |
82 |
|
0.76abc |
78 |
|
Mean |
3.5 |
|
|
1.2 |
|
|
18.1 |
|
|
3.40 |
|
|
0.86 |
|
|
CMJ416 |
0X |
1.6e |
100 |
|
1.0g |
100 |
|
17.0ab |
100 |
|
2.89abcde |
100 |
|
0.69abcd |
100 |
|
1X |
1.6e |
105 |
|
1.2f |
117 |
|
15.6bc |
92 |
|
2.69abcde |
93 |
|
0.57bcdef |
83 |
|
2X |
4.1de |
263 |
|
1.1fg |
112 |
|
14.7bcd |
87 |
|
2.39cdefg |
83 |
|
0.52cdef |
75 |
|
Mean |
2.4 |
|
|
1.1 |
|
|
15.8 |
|
|
2.66 |
|
|
0.59 |
|
|
Daepung |
0X |
2.3de |
100 |
|
1.0g |
100 |
|
17.1ab |
100 |
|
3.65ab |
100 |
|
0.84a |
100 |
|
1X |
3.4de |
152 |
|
2.8c |
276 |
|
15.9bc |
93 |
|
3.09abcd |
85 |
|
0.66bcde |
79 |
|
2X |
8.3de |
366 |
|
2.7cd |
267 |
|
15.2bc |
89 |
|
2.59abcdef |
71 |
|
0.57bcdef |
68 |
|
Mean |
4.8 |
|
|
2.1 |
|
|
16.1 |
|
|
3.11 |
|
|
0.69 |
|
|
Williams 82 |
0X |
2.0de |
100 |
|
1.0g |
100 |
|
16.9abc |
100 |
|
3.80a |
100 |
|
0.82abc |
100 |
|
1X |
4.8de |
235 |
|
3.0b |
296 |
|
14.9bc |
88 |
|
3.15abc |
83 |
|
0.71abcd |
87 |
|
2X |
10.4d |
513 |
|
2.6d |
261 |
|
14.6bcd |
86 |
|
2.56bcdefg |
67 |
|
0.57bcdef |
70 |
|
Mean |
5.7 |
|
|
2.2 |
|
|
15.4 |
|
|
3.17 |
|
|
0.70 |
|
|
CMJ169 |
0X |
2.2de |
100 |
|
1.0g |
100 |
|
17.8ab |
100 |
|
3.25abc |
100 |
|
0.81abc |
100 |
|
1X |
36.8b |
1,680 |
|
4.8a |
479 |
|
14.7bcd |
83 |
|
1.81efg |
56 |
|
0.37ef |
46 |
|
2X |
52.8a |
2,409 |
|
4.7a |
474 |
|
13.5cd |
76 |
|
1.35g |
42 |
|
0.26f |
32 |
|
Mean |
30.7 |
|
|
3.5 |
|
|
15.3 |
|
|
2.13 |
|
|
0.47 |
|
|
Hannam |
0X |
2.0de |
100 |
|
1.0g |
100 |
|
11.4de |
100 |
|
2.67abcde |
100 |
|
0.62bcde |
100 |
|
1X |
22.4c |
1,109 |
|
4.8a |
478 |
|
10.1e |
89 |
|
1.87defg |
70 |
|
0.41def |
66 |
|
2X |
44.1b |
2,182 |
|
4.8a |
480 |
|
9.3e |
82 |
|
1.37fg |
51 |
|
0.27f |
44 |
|
Mean |
22.8 |
|
|
3.5 |
|
|
10.6 |
|
|
1.97 |
|
|
0.43 |
|
|
Mean |
0X |
2.0 |
100 |
|
1.0 |
100 |
|
16.6 |
100 |
|
3.35 |
100 |
|
0.79 |
100 |
|
1X |
11.9 |
587 |
|
2.9 |
293 |
|
14.8 |
89 |
|
2.65 |
79 |
|
0.59 |
75 |
|
2X |
20.9 |
1,030 |
|
2.9 |
288 |
|
14.0 |
85 |
|
2.23 |
67 |
|
0.49 |
62 |
|
LSD (0.05)y)
|
4.1 |
|
|
0.3 |
|
|
1.0 |
|
|
0.32 |
|
|
0.08 |
|
|
LSD (0.05)x)
|
5.1 |
|
|
0.4 |
|
|
1.1 |
|
|
0.44 |
|
|
0.11 |
|
Table 2The interaction effects of soybean accession and growth stage as well as the main effect of growth stage on leaf necrosis, visual score, plant height, fresh weight, and dry weight.
Table 2
|
Genotype |
Growth stage |
Leaf necrosis (%) |
Visual score (1-5)x)
|
Plant height (cm) |
|
Fresh weight (g) |
|
Dry weight (g) |
|
Control |
Treatment |
Indexw)
|
Control |
Treatment |
Indexw)
|
Control |
Treatment |
Indexw)
|
|
CMJ091 |
VC |
2.5dz)
|
1.2c |
16.6bcd |
14.7def |
89a |
|
3.23abc |
2.59bcdefg |
80a |
|
0.78abcd |
0.61bcdefg |
78a |
|
V1 |
4.2cd |
1.2c |
20.0ab |
17.2bcd |
86a |
|
3.7abc |
2.88bcdefg |
78a |
1.00abc |
0.76abcd |
76a |
|
V2 |
3.7cd |
1.1c |
21.7a |
20.3a |
93a |
|
4.47ab |
4.15a |
93a |
1.16a |
1.01a |
87a |
|
CMJ416 |
VC |
1.7d |
1.1c |
13.8cdef |
12.3fgh |
89a |
|
2.08c |
1.76gh |
85a |
0.45d |
0.388fgh |
86a |
|
V1 |
3.3d |
1.1c |
17.6abc |
14.9cdef |
85a |
|
3.08bc |
2.69bcdefg |
87a |
0.72abcd |
0.53cdefg |
74a |
|
V2 |
2.3d |
1.1c |
19.5ab |
18.3ab |
94a |
|
3.5abc |
3.18abcd |
91a |
0.92abcd |
0.72abcdef |
78a |
|
Daepung |
VC |
2.7d |
2.1bc |
14.7cde |
13.8efg |
94a |
|
2.73bc |
1.95defgh |
71a |
0.56cd |
0.42efgh |
75a |
|
V1 |
5.4cd |
2.1bc |
17.3bc |
15.3cde |
88a |
|
3.68abc |
3.15ancde |
86a |
0.83abcd |
0.63bcdef |
76a |
|
V2 |
5.8cd |
2.2abc |
19.2ab |
17.6abc |
92a |
|
4.53ab |
3.43abc |
76a |
1.14a |
0.78abc |
68a |
|
Williams 82 |
VC |
4.5cd |
2.2bc |
13.8cdef |
12.3fgh |
89a |
|
2.51bc |
1.87fgh |
75a |
0.58cd |
0.44efgh |
76a |
|
V1 |
6.4bcd |
2.2abc |
17.0bc |
14.9cdef |
88a |
|
3.68abc |
3.1abcdef |
84a |
0.79abcd |
0.60bcdefg |
76a |
|
V2 |
6.4bcd |
2.2abc |
19.9ab |
17.0bcd |
86a |
|
5.21a |
3.61ab |
69a |
1.09ab |
0.87ab |
80a |
|
CMJ169 |
VC |
34.8a |
3.4ab |
14.8cde |
11.5gh |
78a |
|
2.49bc |
0.87h |
35a |
0.56cd |
0.19h |
34a |
|
V1 |
22.2ab |
3.5ab |
17.9abc |
13.6efg |
76a |
|
3.39abc |
1.82gh |
54a |
0.85abcd |
0.36fgh |
42a |
|
V2 |
34.8a |
3.6a |
20.6ab |
17.2bcd |
83a |
|
3.85abc |
2.04defgh |
53a |
1.01abc |
0.42efgh |
42a |
|
Hannam |
VC |
22.0ab |
3.5ab |
9.7f |
8.2i |
85a |
|
1.89c |
0.78h |
41a |
0.43d |
0.18h |
42a |
|
V1 |
19.3abc |
3.5ab |
11.9ef |
9.6hi |
81a |
|
2.82bc |
1.90efgh |
67a |
0.64bcd |
0.36fgh |
56a |
|
V2 |
27.3a |
3.5ab |
12.5def |
11.3gh |
90a |
|
3.30abc |
2.19cdefg |
66a |
0.77abcd |
0.47defgh |
61a |
|
Mean |
VC |
11.4 |
2.3 |
13.9 |
12.1 |
87a |
|
2.49 |
1.64 |
66a |
0.56 |
0.37 |
66a |
|
V1 |
10.1 |
2.3 |
170 |
14.3 |
84a |
|
3.39 |
2.59 |
76a |
0.80 |
0.53 |
66a |
|
V2 |
13.4 |
2.3 |
18.9 |
16.9 |
89a |
|
4.14 |
3.10 |
75a |
1.02 |
0.72 |
71a |
|
LSD (0.05)y)
|
4.6 |
0.4 |
1.5 |
1.0 |
5.9 |
|
0.5 |
0.35 |
21 |
0.1 |
0.1 |
22 |
Table 3The effects of bentazone dose on leaf necrosis, visual score, plant height, fresh weight, and dry weight in relation to the growth.
Table 3
|
Growth stage |
Bentazone dose |
Leaf necrosis |
|
Visual score |
|
Plant height |
|
Fresh weight |
|
Dry weight |
|
(%) |
Indexx)
|
(1-5)y)
|
Index |
(cm) |
Index |
(g) |
Index |
(g) |
Index |
|
VC |
0X |
1.4cz)
|
100 |
|
1.0b |
100 |
|
13.9cd |
100 |
|
2.49cd |
100 |
|
0.56cd |
100 |
|
1X |
12.2abc |
904 |
|
3.0a |
295 |
|
12.7cd |
91 |
|
1.83de |
74 |
|
0.41de |
73 |
|
2X |
20.5ab |
1,519 |
|
2.8a |
281 |
|
11.6d |
84 |
|
1.44e |
58 |
|
0.33e |
59 |
|
V1 |
0X |
2.8c |
100 |
|
1.0b |
100 |
|
17.0ab |
100 |
|
3.39ab |
100 |
|
0.81b |
100 |
|
1X |
8.9bc |
316 |
|
3.0a |
295 |
|
14.7bc |
86 |
|
2.77bc |
82 |
|
0.58cd |
72 |
|
2X |
18.6b |
660 |
|
2.8a |
285 |
|
13.9cd |
82 |
|
2.41cd |
71 |
|
0.49cde |
61 |
|
V2 |
0X |
1.9c |
100 |
|
1.0b |
100 |
|
18.9a |
100 |
|
4.14a |
100 |
|
1.02a |
100 |
|
1X |
14.6ab |
766 |
|
2.9a |
291 |
|
17.2a |
91 |
|
3.35b |
81 |
|
0.78b |
77 |
|
2X |
23.6a |
1,235 |
|
3.0a |
299 |
|
16.7ab |
88 |
|
2.84bc |
69 |
|
0.64bc |
63 |
Table 4The effects of 1X bentazone dose on leaf necrosis, visual score, plant height, fresh and dry weight of the tolerant, moderately tolerant, and susceptible group of soybean accessions treated at the V1 growth stage.
Table 4
|
Reaction group |
Accession |
Leaf necrosis (%) |
Visual score (1-5)x)
|
Plant height |
|
Fresh weight |
|
Dry weight |
|
Control (cm) |
Treatment (cm) |
Indexw)
|
Control (g) |
Treatment (g) |
Index |
Control
(g) |
Treatment (g) |
Index |
|
Tolerant |
CMJ042 |
2.4 |
1.3 |
19.5 |
17.5 |
90 |
|
2.00 |
1.62 |
81 |
|
0.51 |
0.33 |
65 |
|
CMJ101 |
0.6 |
1.0 |
24.1 |
20.6 |
85 |
|
2.57 |
1.69 |
66 |
|
0.51 |
0.39 |
77 |
|
CMJ131 |
1.4 |
1.0 |
24.0 |
19.5 |
81 |
|
2.29 |
1.23 |
54 |
|
0.47 |
0.24 |
51 |
|
CMJ286 |
0.6 |
1.0 |
23.0 |
18.3 |
80 |
|
2.27 |
1.19 |
52 |
|
0.47 |
0.26 |
55 |
|
CMJ342 |
1.5 |
1.2 |
21.2 |
22.4 |
106 |
|
1.84 |
1.94 |
105 |
|
0.47 |
0.36 |
77 |
|
CMJ377 |
4.3 |
1.2 |
25.1 |
24.8 |
99 |
|
2.20 |
1.85 |
84 |
|
0.50 |
0.38 |
76 |
|
CMJ386 |
1.0 |
1.1 |
22.8 |
21.5 |
94 |
|
2.29 |
1.80 |
78 |
|
0.46 |
0.33 |
72 |
|
CMJ091 |
3.1 |
1.2 |
21.1 |
22.0 |
104 |
|
1.99 |
2.89 |
146 |
|
0.35 |
0.62 |
176 |
|
Namhae |
2.8 |
1.2 |
21.7 |
19.9 |
91 |
|
2.34 |
1.64 |
70 |
|
0.52 |
0.36 |
70 |
|
Socheong |
2.1 |
1.2 |
18.8 |
18.0 |
96 |
|
2.03 |
1.66 |
82 |
|
0.58 |
0.43 |
74 |
|
Mean |
2.0cz)
|
1.1c |
22.1b |
20.4a |
92a |
|
2.18a |
1.75a |
80a |
|
0.48a |
0.37a |
77a |
|
Moderately tolerant |
Jungmo3009 |
6.3 |
2.8 |
20.6 |
19.5 |
95 |
|
3.64 |
1.72 |
47 |
|
0.87 |
0.41 |
47 |
|
Nuriol |
12.5 |
3.7 |
19.4 |
19.1 |
98 |
|
1.92 |
1.75 |
91 |
|
0.54 |
0.44 |
81 |
|
Dagi |
7.0 |
2.6 |
20.8 |
19.6 |
94 |
|
2.36 |
1.27 |
54 |
|
0.51 |
0.32 |
63 |
|
Pureun |
19.9 |
3.5 |
17.6 |
17.5 |
99 |
|
1.98 |
1.69 |
85 |
|
0.36 |
0.3 |
83 |
|
Pungsanamul |
10.3 |
3.0 |
16.9 |
16.5 |
98 |
|
1.37 |
1.15 |
84 |
|
0.27 |
0.23 |
85 |
|
Heugmi |
7.1 |
3.0 |
19.1 |
18.0 |
94 |
|
1.81 |
1.46 |
81 |
|
0.33 |
0.28 |
85 |
|
Geomjeongkong 3 |
12.9 |
3.3 |
21.7 |
17.8 |
82 |
|
2.53 |
1.30 |
51 |
|
0.36 |
0.24 |
67 |
|
Uram |
7.1 |
2.9 |
22.0 |
19.4 |
88 |
|
2.15 |
1.61 |
75 |
|
0.46 |
0.24 |
52 |
|
Daewon |
13.5 |
3.4 |
22.7 |
18.5 |
81 |
|
2.26 |
1.33 |
59 |
|
0.38 |
0.22 |
58 |
|
Alchan |
10.8 |
3.2 |
24.5 |
23.3 |
95 |
|
2.71 |
1.38 |
51 |
|
0.51 |
0.25 |
49 |
|
Mean |
10.7b |
3.1b |
20.5c |
18.9b |
92a |
|
2.27a |
1.47b |
64a |
|
0.46a |
0.29b |
64a |
|
Susceptible |
Hannam |
38.5 |
4.5 |
21.4 |
16.9 |
79 |
|
2.06 |
0.65 |
32 |
|
0.34 |
0.17 |
50 |
|
Seonam |
48.0 |
5.0 |
29.0 |
18.3 |
63 |
|
2.58 |
0.60 |
23 |
|
0.44 |
0.15 |
34 |
|
Dachae |
42.9 |
5.0 |
24.0 |
16.2 |
68 |
|
2.63 |
0.39 |
15 |
|
0.39 |
0.09 |
23 |
|
Pokwangkong |
45.6 |
5.0 |
25.2 |
18.4 |
73 |
|
2.49 |
0.82 |
33 |
|
0.52 |
0.15 |
29 |
|
Baekchun |
29.4 |
4.5 |
27.3 |
16.7 |
61 |
|
3.04 |
0.83 |
27 |
|
0.68 |
0.14 |
21 |
|
CMJ427 |
26.0 |
4.0 |
27.2 |
15.0 |
55 |
|
2.64 |
0.43 |
16 |
|
0.50 |
0.14 |
28 |
|
CMJ316 |
28.0 |
4.3 |
25.4 |
16.1 |
64 |
|
2.83 |
0.64 |
23 |
|
0.43 |
0.11 |
26 |
|
CMJ185 |
43.5 |
4.8 |
23.9 |
16.3 |
68 |
|
3.14 |
0.78 |
25 |
|
0.67 |
0.16 |
24 |
|
CMJ188 |
23.4 |
4.5 |
21.0 |
16.0 |
76 |
|
1.53 |
0.56 |
37 |
|
0.45 |
0.08 |
18 |
|
CMJ254 |
32.7 |
4.7 |
20.0 |
17.8 |
89 |
|
1.51 |
1.33 |
88 |
|
0.30 |
0.16 |
53 |
|
Mean |
35.8a |
4.6a |
24.4a |
16.8c |
69b |
|
2.45a |
0.70c |
29b |
|
0.47a |
0.14c |
29b |
|
LSD (0.05)y)
|
4.2 |
0.2 |
1.0 |
1.1 |
10 |
|
0.29 |
0.25 |
25 |
|
0.07 |
0.05 |
26 |
References
- Ali L, Jo H, Song JT, Lee JD. 2020. The prospect of bentazone-tolerant soybean for conventional cultivation. Agronomy.. 10: 1650
- Andersen RN, Lueschen WE, Warnes DD, Nelson WW. 1974. Controlling Broadleaf Weeds in Soybeans by Bentazon in Minnesota. Weed Sci.. 22: 136-142.
- Begum H, Alam MS, Feng Y, Koua P, Ashrafuzzaman M, Shrestha A, Frei M. 2020. Genetic dissection of bread wheat diversity and identification of adaptive loci in response to elevated tropospheric ozone. Plant Cell Environ.. 43: 2650-2665.
- Byker HP, Van Wely AC, Soltani N, Lawton MB, Robinson DE, Sikkema PH. 2017. Single and sequential applications of dicamba for the control of glypho-sate-resistant common ragweed in glyphosate-and dicamba-resistant soybean. Can. J. Plant Sci.. 98: 552-556.
- Carter AH, Hansen J, Koehler T, Thill DC, Zemetra RS. 2007. The effect of imazamox application timing and rate on imazamox resistant wheat cultivars in the Pacific Northwest. Weed Technol.. 21: 895-899.
- Fartyal D, Agarwal A, James D, Borphukan B, Ram B, Sheri V, et al. 2018. Developing dual herbicide tolerant transgenic rice plants for sustainable weed management. Sci. Rep.. 8: 1-12.
- Fehr WR, Caviness CE, Burmood DT, Pennington JS. 1971. Stage of development descriptions for soybeans, Glycine Max (L.) Merrill 1. Crop Sci.. 11: 929-931.
- Ishibashi M, Ando SI, Mikami A. 2013. Optimum application timing of bentazon for broadleaved weed control in soybean crop in Miyagi Prefecture, Japan. In The role of weed science in supporting food security by 2020. Proceedings of the 24th Asian-Pacific Weed Science Society Conference. Bandung, Indonesia, October 22-25, 2013 (pp. 633-635)..
- Kapusta G, Jackson LA, Mason DS. 1986. Yield response of weed-free soybeans (Glycine max) to injury from postemergence broadleaf herbicides. Weed Sci.. 34: 304-307.
- Kato S, Yokota Y, Suzuki R, Fujisawa Y, Sayama T, Kaga A, et al. 2020. Identification of a cytochrome P450 hydroxylase, CYP81E22, as a causative gene for the high sensitivity of soybean to herbicide bentazon. Theor. Appl. Genet.. 133: 2105-2115.
- Khirade SD, Patil AB. 2015. Plant disease detection using image processing. In 2015 International conference on computing communication control and automation (pp. 768-771). IEEE..
- Kim M, Lee C, Hong S, Kim SL, Baek JH, Kim KH. 2021. High-Throughput Phenotyping Methods for Breeding Drought-Tolerant Crops. Int. J. Mol. Sci.. 22: 8266
- Lee JD, Smothers SL, Dunn D, Villagarcia M, Shumway CR, Carter TE, et al. 2008. Evaluation of a simple method to screen soybean genotypes for salt tolerance. Crop Sci.. 48: 2194-2200.
- McCown S, Barber T, Norsworthy JK. 2018. Response of non-dicamba-resistant soybean to dicamba as influenced by growth stage and herbicide rate. Weed Technol.. 32: 513-519.
- Nakka S, Jugulam M, Peterson D, Asif M. 2019. Herbicide resistance: Development of wheat production systems and current status of resistant weeds in wheat cropping systems. Crop J.. 7: 750-760.
- Nelson KA, Renner KA. 2001. Soybean growth and development as affected by glyphosate and postemer-gence herbicide tank mixtures. J. Agron.. 93: 428-434.
- Oh E, Kim S, Asekova S, Yoon Y N, Lee J D. 2018. An improved screening method for evaluation of resistance to Phytophthora blight in sesame cultivars and accessions. Plant Breed. Biotech.. 6: 305-308.
- Oliveira MC, Feist D, Eskelsen S, Scott JE, Knezevic SZ. 2017. Weed control in soybean with preemergence‐and postemergence‐applied herbicides. Crop. Forage Turfgrass Manag.. 3: 1-7.
- Park HH, Lee DJ, Kuk YI. 2021. Effects of Various Environmental Conditions on the Growth of Amaranthus patulus Bertol. and Changes of Herbicide Efficacy Caused by Increasing Temperatures. Agronomy. 11: 1773
- Samal I, Majhi PK, Bhoi TK, Satapathy SM, Dohling PNK, Mohapatra S. 2020. Chapter-4 Herbicide-Resistant (HR) Transgenic Crops: Benefits and Consequences. Chief Editor Dr. Vishuddha Nand. 59..
- Stephenson DO, Spivey TA, Deliberto MA, Blouin DC, Woolam BC, Buck TB. 2018. Effects of Low-Dose Flumioxazin and Metribuzin Postemergence Appli-cations on Soybean. Weed Technol.. 33: 87-94.
- Tachibana M, Nakayama S, Watanabe HJ. 2006. Response of soybean cultivars to bentazon in the Tohoku region, Japan. J. Weed Sci. Technol.. 51: 19-27.
- Wax LM, Bernard RL, Hayes RM. 1974. Response of soybean cultivars to bentazon, bromoxynil, chloroxuron, and 2, 4-D B. Weed Sci.. 22: 35-41.
- Wichert RA, Bozsa R, Talbert RE, Oliver LR. 1992. Temperature and relative humidity effects on dipheny-lether herbicides. Weed Technol.. 6: 19-24.