Abstract
Brown rice contains beneficial phytonutrients such as antioxidants, anthocyanins and oryzanol, and oryzanol is one of the major components. However, the information of oryzanol contents and genetic data are limited in Korean rice landraces to use the genetic resources. This study was conducted to investigate varietal differences of the oryzanol content and analyze the genetic diversity using SSR marker about 196 Korean rice landraces. Among tested germplasm, the total γ-oryzanol values showed the high variation ranged from 9.8 to 55.9 mg 100g−1 and an average content value was 27.2 mg 100g−1. Particularly, IT007903, IT007714, IT006622 and IT006125 accessions were showed γ-oryzanol contents higher than 50mg 100g−1. The 24-methylene cycloartenyl ferulate was the most prevalent with an average value of 29.9% among the total γ-oryzanol components, and followed by cycloartenyl ferulate (26.7%). Genetic diversity among 196 landrace accessions was evaluated based on 46 SSR markers carrying total 396 alleles. The mean values of observed (HO) and expected heterozygosities (HE) were 0.009 and 0.497, respectively, indicating a considerable amount of polymorphism within this collection. A genetic distance-based phylogeny grouped into seven clusters with genetic distance (GD) value was 0.6. According to the phylogenetic analysis, roughly 7 clusters were divergent, and the γ-oryzanol content values showed statistical differences by the four groups (P<0.001). These traits of the selected accession would be helped broadening for parent materials selection to improve the γ-oryzanol content through the rice breeding.
-
Key words: γ-oryzanol, Genetic diversity, Genetic conservation, Microsatellite, Rice landrace
INTRODUCTION
Rice as harvested from the field is called paddy that has several layers. Milling is processed and rice grains are transformed into a form that suitable for human consumption. Only the outermost layer, the hull, is removed at first commercial milling process and we call brown rice. Brown rice further was milled to produce white rice. Rice is mostly consumed in polished and whole milled form with little or no bran remaining on the endosperm. However, it is known that valuable nutrients such as dietary fiber, ferullic acid, isovitexin, phytic acid, γ-oryzanol, tocopherol, γ-amino butyric acid are concentrated in the germ and outer layer of the starchy endosperm and these compounds are well-known for functions as antioxidant activity (
Chae 2002;
Oh and Oh 2004;
Fardet et al. 2008). It is reason that brown rice is widely valued as a healthy food, and for good reason.
γ-oryzanol is one of the major valuable nutrients in rice bran as an antioxidant compound (
Kim et al. 1995;
Lee et al. 2011). γ-oryzanol is a mixture of phytosteryl ferulates (
Scavariello and Arellano 1998) and it may help lower elevated LDL (low density lipoprotein)-cholesterol levels and inhibition of LDL-cholesterol synthesis (
Nakayama et al. 1987;
Scavariello and Arellano 1998) and increase HDL cholesterol levels (
Cicero and Gaddi 2001).
Xu and Godber (1999) found that 24-methylene cycloartanyl ferulate, cycloartanyl ferulate, campesteryl ferulate, β-sitosteryl ferulate and campestanyl ferulate which have been identified as the major components and were found to have antioxidant activity 10 times greater than the major tocopherol and tocotrienol components of vitamin E.
Some reports have been published about γ-oryzanol contents in rice bran (
Lee et al. 2011;
Boonsit et al. 2010), but little is known regarding of its levels in Korean rice landraces. Landraces have been continuously maintained by farmers within different agricultural areas as well as their local environments. Landraces have distinct identity and lack formal crop improvement, as well as often being genetically diverse, locally adapted and associated with traditional farming systems (
Villa et al. 2006). The landraces of crop has been valued as a source of traits that can be used in breeding programs and to improve the productivity and the quality of new crop varieties. Therefore, it is very important to acquire knowledge of the genetic diversity and relationships among landraces germplasm. Studies of genetic diversity using molecular markers are necessary to understand the genetic relationships and structures of populations and to orientate effective strategies of landraces germplasm conservation (
Ganapathy et al. 2011). With many other crop species, SSR markers are being widely used in rice studies. SSR markers are highly efficient molecular tools for plant variety characterization or diversity assessment of rice landraces germplasm because of their high levels of polymorphism and high reproducibility (
Park et al. 2008;
Verma et al. 2010).
The germplasm of crop has a great diversity for morphological traits like grain size, leaf shape and height. This diversity offers opportunities to develop unique cultivars for agronomic applications. An assessment of relationship between oryzanol contents and genetic diversity among landraces germplasm will be useful to screen the germplasm. The information of high orzyznol content about genetic resources will be a valuable data to the people who substantially need it and in the breeding program. The objectives of this study were to investigate the γ-oryzanol contents in rice landraces collected from Korea and to evaluate genetic diversity and relationships between landrace accessions with genetic variation.
MATERIALS AND METHODS
Plant materials and γ-Oryzanol contents analysis
The collection contained a total of 196 landrace accessions of Korea (
Oryza sativa L.) were acquired from Agrobiodiversity Center (NAAS, RDA, Korea). A list of germplasm accessions used in this study is given in
Table 1. Seed samples were cultivated in Suwon city, Korea, in 2009 and 2010 according to standard rice cultivation Manual of RDA and harvested seeds of two years were separately analyzed.
Gamma-oryzanol analysis was performed by Xu and Godber. The γ-oryzanol was extracted from dehulled rice with 50 ml of dichloromethane-methanol (2:1, v/v) and total γ-oryzanol analysis was performed using an Agilent HPLC series 1200 (Agilent, Waldbronn, Germany). Agilent HPLC series 1200 (Agilent, Waldbronn, Germany) were used to determine the concentration of γ-oryzanol using Zorbax Eclipse XDB-C18 column (150 mm, 4.6 mm i.d. and 5-lm particle size) (Agilent, Waldbronn, Germany) at 40 ºC according to
Lee et al. (2011). The mobile phase consisted of methanol, acetonitrile, dichlorometane and acetic acid (50:44:3:3, v/v). The separation was carried out with a Zorbax Eclipse XDB-C18 column (150 mm, 4.6 mm i.d. and 5-μm particle size) (Agilent, Waldbronn, Germany) operated at 40 ºC. UV detection wavelength was set at 315 nm. Quantitation was based on the linear calibration curve of the sum of the area of all fractions versus molarities of gamma-oryzanol dilutions at 315 nm wavelength of UV detector. Standard chemicals were obtained from Sigma-Aldrich (St. Louis, Mo, USA).
Genomic DNA was extracted from the young leaves of samples using Plant DNAzol reagent (Invitrogen). The DNA concentration was determined using a NanoDrop (ND-1000; NanoDrop, Wilmington, DE, USA). The final concentration of each DNA sample was adjusted to 20 ng/ul in TE buffer before conducting PCR. The M13-tail at the 5′-end region PCR method was used to measure the sizes of the amplified products (
Schuelke 2000). For genotyping analysis, primers were chosen from the Gramene database (
http://www.gramene.org/markers/microsat/ssr.html) and the genome-wide SSR markers used in this study are listed in
Table 3. Amplified fluorescent-labeled PCR products were analyzed on an ABI-Prism 3130×1 Genetic Analyzer (Applied Biosystems). Fragments were sized and scored into alleles using GeneMapper v4.0 (Applied Biosystems).
The total number of alleles (N
A), expected (H
E) and observed heterozygosities (H
O) and polymorphic information content (PIC) for each SSR locus were calculated with PowerMarker version 3.25 (
Liu and Muse 2005). An unweighted pair group method with arithmetic mean (UPGMA) hierarchical clustering were performed based on the matrix of genetic similarity estimates according to the procedures of the PowerMarker software. The tree to visualize the phylogenetic distribution of accessions was constructed using the software MEGA (
Tamura et al. 2007). Analysis of variance (ANOVA) was performed to statistical analysis for the difference of total γ-oryzanol contents among the groups classified by phylogenetic tree using SAS (version 9.2) software.
RESULTS
Analysis of γ-oryzanol contents
The physicochemical trait about γ-oryzanol contents was analyzed using HPLC and the γ-oryzanol contents of 196 rice landrace accessions are presented in
Table 1. In this study, 10 kinds of γ-oryzanols were detected and the compositions in the γ-oryzanol were as follows: Δ7-Stigmastenyl (0.3 to 3.7%), Stigmastenyl (0.5 to 2.1%), Cycloartenyl (12.4 to 38.4%), 24-Methylene Cycloartenyl (20.3 to 45.8%), Δ7-Campestenyl ferulate (0 to 11.7%), Campesteryl (8.3 to 36.4%), Δ7-Sitostenyl (0 to 0.9%), Sitosteryl (5.3 to 16.4%), Campestanyl (0 to 14.6%) and Sitostanyl (1.3 to 13.1%) (
Fig. 2). These results indicated that the averages of individual components of γ-oryzanol among the total γ-oryzanol were: 24-methylenecycloartanyl ferulate (29.9%), and followed by cycloartenyl ferulate (26.7%) and campesteryl ferulate (20.3%). The minor component group, sitosteryl ferulate, showed high proportions of 11.4%. The main components are 24-methylenecycloartanyl, cycloartenyl, and campesteryl with about 80% of the γ-oryzanol (
Fig. 2). There is a similarity in the γ-oryzanol content in the previous study (Miller et al. 2006).
The Distribution of rice landrace accessions based on the γ-oryzanol content showed in the
Fig. 1. Among tested germplasm, the total average γ-oryzanol values were observed considerable variations, which ranged from 9.8 to 55.9 mg 100g
−1 with a mean value of 27.2 mg 100g
−1 in 196 rice landraces. The total γ-oryzanol content of this study was more or less than in other studies (
Boonsit et al. 2010,
Lee et al. 2011,
Yoshie et al. 2009). Most of cultivars were in the range of 20–40 mg 100g
−1 (
Lee et al. 2011;
Yoshie et al. 2009) in common rice grains and 40–73 mg 100g
−1 (
Boonsit et al. 2010) in purple rice. A hundred forty-six (74.4%) of all accessions revealed the γ-oryzanol content to range from 20 to 40 mg 100 g
−1 in this study.
The four rice landraces in this study that yielded the highest total γ-oryzanol content were IT007903 (55.85 mg 100 g
−1), IT007714 (54.72 mg 100 g
−1), IT006622 (50.05 mg 100 g
−1) and IT006125 (50.04 mg 100 g
−1) (
Table 2), while thirty-six accessions (18.4%) showed the γ-oryzanol contents less than 20 mg 100 g
−1 and more than 40 mg 100 g
−1 in fourteen accessions (7.1%) (
Fig. 1). There was the interaction among the compositions of γ-oryzanol. It can be seen that the content of campesteryl increased, whereas the sitostanyl was decreased. Although our extracts in landraces were averagely lower than those of colored rice (
Boonsit et al. 2010), the total average γ-oryzanol values were observed high variations, and the used germplasm in this study contained a higher amount of γ-oryzanol than in common rice.
The average number of alleles, the frequency of the major allele and gene diversity are given in
Table 3. All the 46 genome-wide SSR primers were used for genetic diversity analysis and detected 396 alleles among 196 rice landrace accessions. The average alleles per primer pair was 8.6, ranging from a minimum of 2 alleles for RM6165 and RM12676 on chromosome 2 to a maximum of 33 for RM206 on chromosome 11. In general, higher values both of Ho and He revealed a higher genetic variability among the germplasm accessions. The values of H
O and H
E ranged from 0.000 to 0.046 (mean 0.009) and from 0.021 to 0.928 (mean 0.497), respectively and the highest H
O and H
E were revealed by RM3766 (0.046) on chromosome 3 and RM206 (0.928) on chromosome 11, respectively. The PIC values, a reflection of allele diversity and frequency among the used germplasm, also varied from one locus to another. The PIC values ranged from 0.021 to 0.924, with an average of 0.467. Markers with PIC values of more than 0.5 are highly informative for genetic studies and are extremely useful in distinguishing the polymorphism rate of a marker at a specific locus (
DeWoody et al. 1995). Twenty-six of 46 genome-wide SSR markers observed in this study were higher than the PIC value of 0.5 and the genetic diversity of each SSR locus appeared to be associated with the number of alleles detected per locus. The genetic variation among the accessions revealed by SSRs reflected a high level of polymorphism at the DNA level. The results suggest that these SSR markers of rice landraces would be a valuable marker resource for the genetic diversity analysis of rice germplasm.
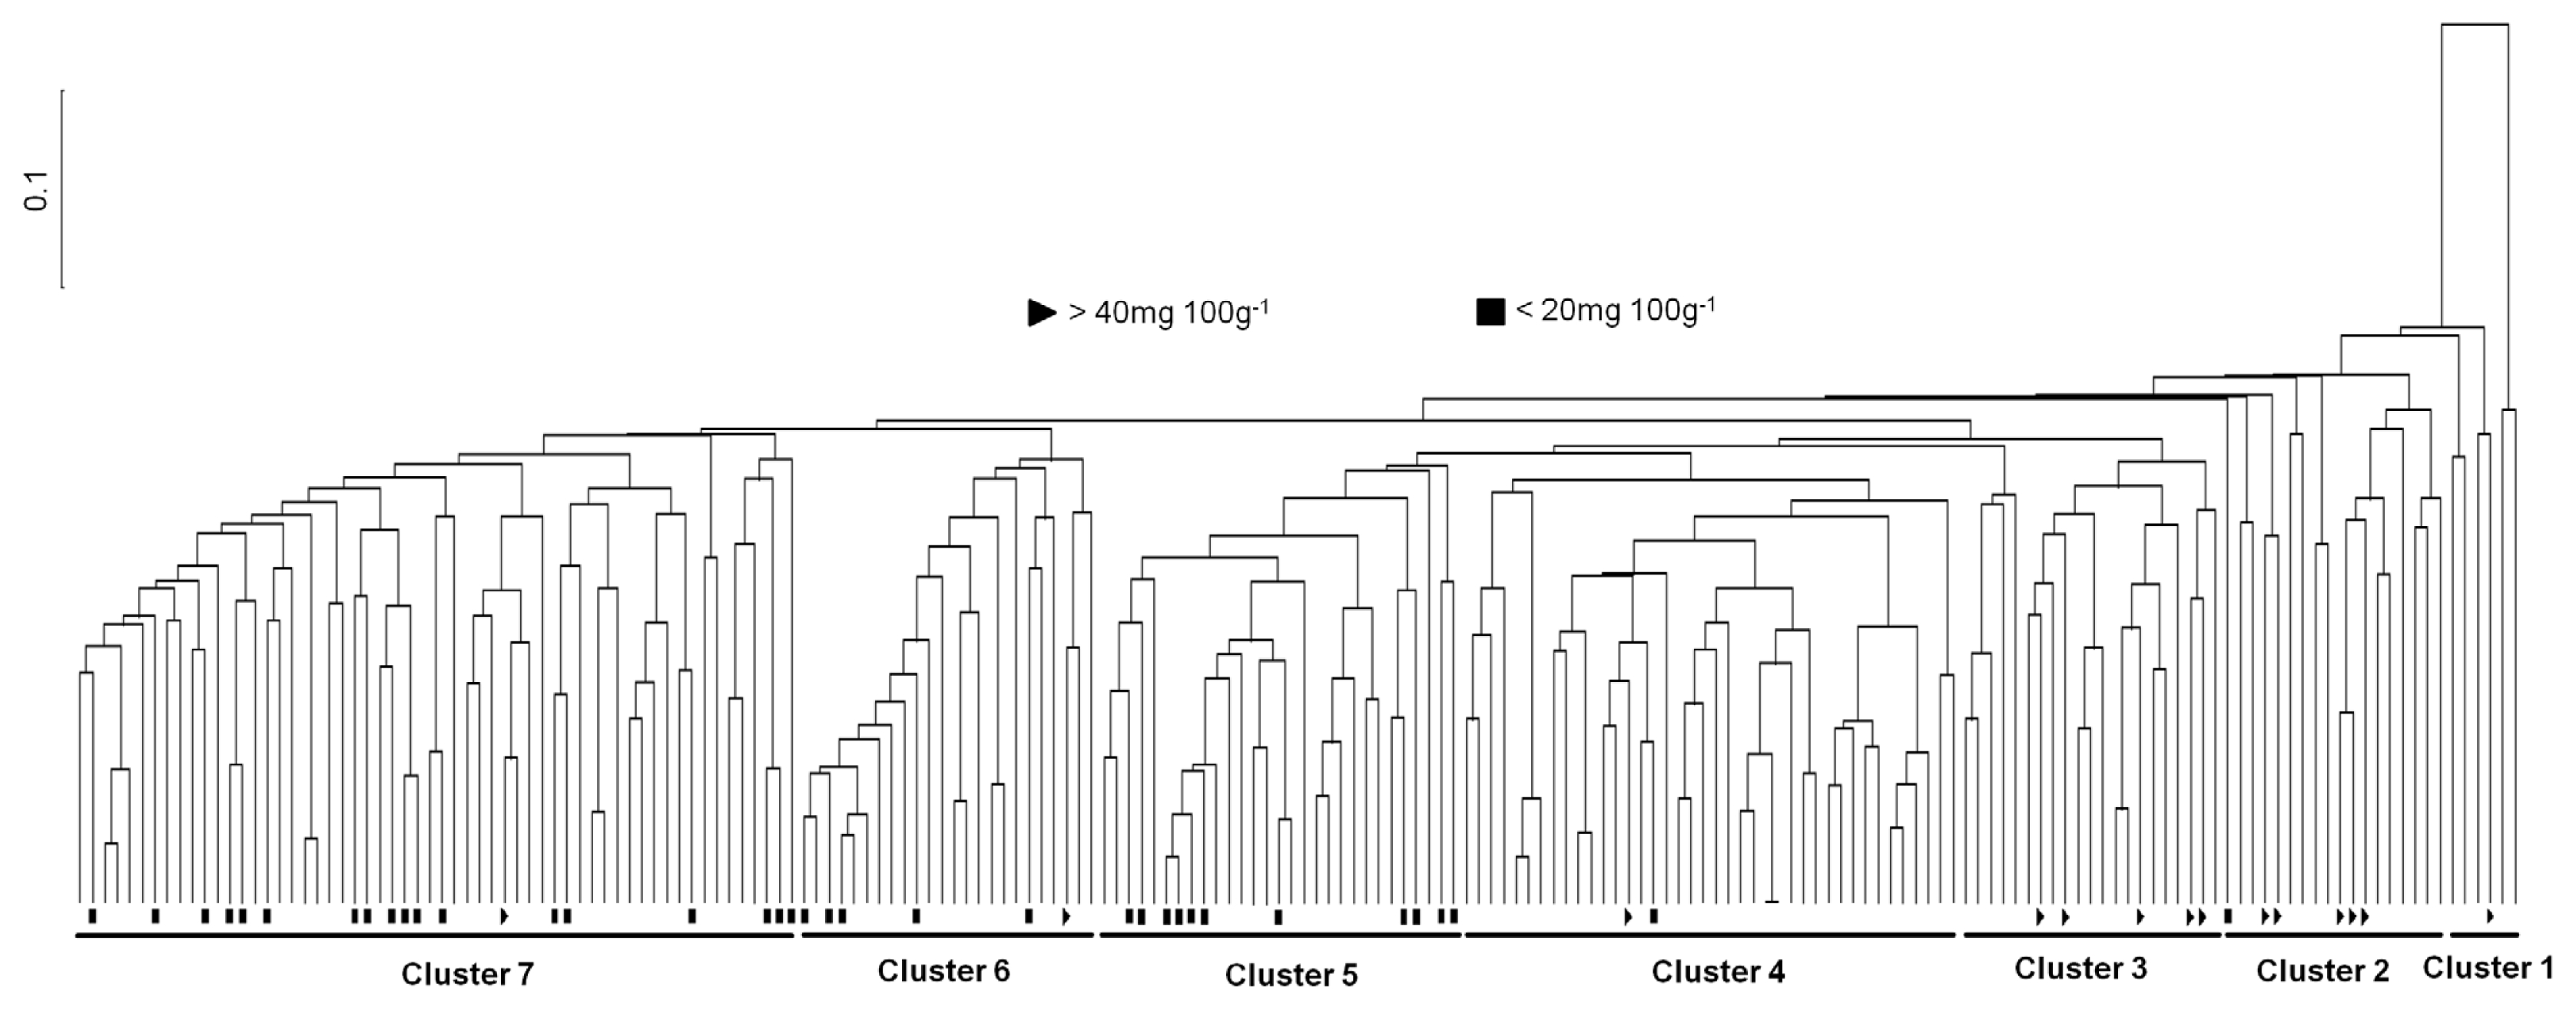
We divided into seven clusters in the landraces germplasm to assess the genetic relationship among the rice landraces and to evaluate the genetic differentiation among the clusters by UPGMA cluster analysis of the similarity matrix. However, the landraces originally from various regions of Korea did not form distinct clusters by SSR markers. These were interspersed with each another in the classified clusters, which confirmed no association between the landraces patterns by SSR and their γ-oryzanol content. The landraces with high variation of the contents were mixed and distributed throughout the seven clusters.
The UPGMA dendrogram has classified seven clusters (Cluster 1, Cluster 2, Cluster 3, Cluster 4, Cluster 5, Cluster 6 and Cluster 7) in the 196 accessions at 0.49 similarity coefficient (
Fig. 3). To determine the variation of γ-oryzanol content among the pylogenetic clusters in rice landraces, we performed ANOVA analysis using SAS program. According to the phylogenetic analysis, roughly 7 clusters were divergent, and the γ-oryzanol content values showed statistical differences by the four groups (
P<0.001) (
Table 4). The first group included 24 landraces, which are Cluster 1 with average γ-oryzanol contents (33.2 mg 100g
−1) and Cluster 2 with 32.6 mg 100g
−1. The second group contained 21 accessions, which is Cluster 3 with 34.5 mg 100g
−1 and the third group contained 40 accessions, which is Cluster 4 with 28.3 mg 100g
−1. The fourth group contained 111 accessions, which are Cluster 5 with 24.2 mg 100g
−1, Cluster 6 with 26.1 mg 100g
−1 and Cluster 7 with 23.6 mg 100g
−1 (
Table 4). Clear relationship between Korean landraces contained variations of the total average γ-oryzanol contents and the clusters classified by cluster analysis was not found in this study. Only the clusters were revealed the total γ-oryzanol contents difference. As in the cluster analysis, Korean landraces showed genetical variations, although the accessions used in this study were not classified obviously with oryzanol contents. However, the four accessions, IT007903, IT007714, IT006622 and IT005500, containing the highest the total γ-oryzanol contents belonged to Cluster 1 and Cluster 2 (
Table 2 and
Fig. 3.). It inferred that Korean landraces have diverse genetic bases and can be utilized in future breeding.
DISCUSSION
Brown rice is widely known as a staple and valuable food in many diets around the world because it contains higher levels of gamma-tocotrienol, ferullic acid, dietary fiber and gamma-oryzanol. One of these compounds, γ-oryzanol, functions as lipid-soluble antioxidants that can reduce blood levels of LDL-cholesterol (
Nakayama et al. 1987) and due to its antioxidant effects, it has been shown to be beneficial in patients with menopausal symptoms (
Ishihara et al. 1982) and controlling blood pressure (
Chae 2002). Therefore, a rice genotype producing high levels of γ-oryzanol would be commercially valuable (
Boonsit et al. 2010)
The long tradition of rice cultivation in Korea had allowed the evolution of many landraces adapted to restricted areas. Nowadays, in response to market demands, landraces have been gradually replaced by improved cultivars, because it can contain some valuable alleles not common in modern germplasm. However, landraces still one of the important genetic resources for breeding area, because they contain huge genetic variability. Variation in landraces can be used to complement and is helpful for broadening the crop gene pool (
Kobayashi et al. 2006), but little is known about its levels in Korean rice landraces. The objective of in this paper was to investigate the content of γ-oryzanol in rice landrace genotypes domesticated in South Korea. Compared to previous studies reported that the oryzanol contents with range from 16–20 mg 100g
−1 (
Lee et al. 2011), our results could indicate the considerable variations in γ-oryzanol content among the rice genotypes cultivated from Korea. We obtained that the total γ-oryzanol content of landraces showed high variation ranged from 9.8 to 55.9 mg 100 g
−1 and a mean was 27.2 mg 100 g
−1 in this study. Furthermore, some landrace accessions, IT007903 (55.85 mg 100g
−1), IT007714 (54.72 mg 100g
−1), IT006622 (50.05 mg 100g
−1) and IT006125 (50.04 mg 100g
−1), have higher contents of total γ-oryzanol, it will be good the genetic resources to rice breeding to improve the γ-oryzanol and quality.
An UPGMA dendrogram showed that the genotypes that are derivatives of genetically similar types clustered together, and landraces in the same subgroup mostly shared a high proportion of ancestry and agronomic features such as plant height, maturity, seed length, etc (
Pervaiz et al. 2010;
Odile et al. 2011). However, it is difficult to distinguish relationship of γ-oryzanol contents according to physiological, ecological classifications and agronomic characters of rice. Therefore, in molecular aspects, we performed to the genetic differentiation and patterns of phylogenetic relationship among a diverse set of rice landrace accessions collected from South Korea using the UPGMA cluster analysis based on genome-wide SSR markers, and then we checked the association between classified clusters and γ-oryzanol contents of individual landrace accession. The results indicated that the phylogenetic clustering showed difference of genetic variability among all 196 rice landrace accessions and the landrace accessions revealed the presence of 7 possible clusters. However, the UPGMA dendrogram did not observe clear grouping of the accessions according to high or low γ-oryzanol contents. Only it was revealed the difference of average γ-oryzanol contents among the clusters.
We analyzed the γ-oryzanol content in rice landraces, and compared the content values by the phylognetic clusters of Korean landraces using ANOVA test. Based on the phylogenetic analysis, roughly 7 clusters were divergent, and the γ-oryzanol content values showed statistical differences by the 4 groups (
P<0.001). The results revealed that the dendrogram showed the complex distribution pattern among 196 landraces. However, 14 landrace accessions with high γ-oryzanol content were closely located within three clusters, Cluster 1, Cluster 2 and Cluster 3. Previous studies have been reported that rice bran consists of the outer layers (pericarp, seed coat, and aleurone) and the embryo or germ (
Rohrer et al. 2004), and environment as well as genetics affects the contents and composition of γ-oryzanols in rice seed (
Bergman et al. 2003; Miller et al. 2006). Therefore, it will be further study that the content of γ-oryzanol was affected according to the embryo size and pericarp thickness of the landraces seed in this study.
The assessment of genetic variability among genotypes is useful for the conservation of genetic resources and for cultivar protection (
Yuzbaşıoglu et al. 2006). The information obtained here would be useful to evaluate genetic resources of rice accessions and for the utilization of these plants for the rice breeding of parent materials selection. This study might be the basis for association analysis of γ-oryzanol in diverse rice landraces.
ACKNOWLEDGEMENTS
This study was supported by a grant (Code no. PJ0083-682013) from the National Academy of Agricultural Science, RDA, Republic of Korea.
Fig. 1Distribution of rice landrace accessions according to γ-oryzanol content.
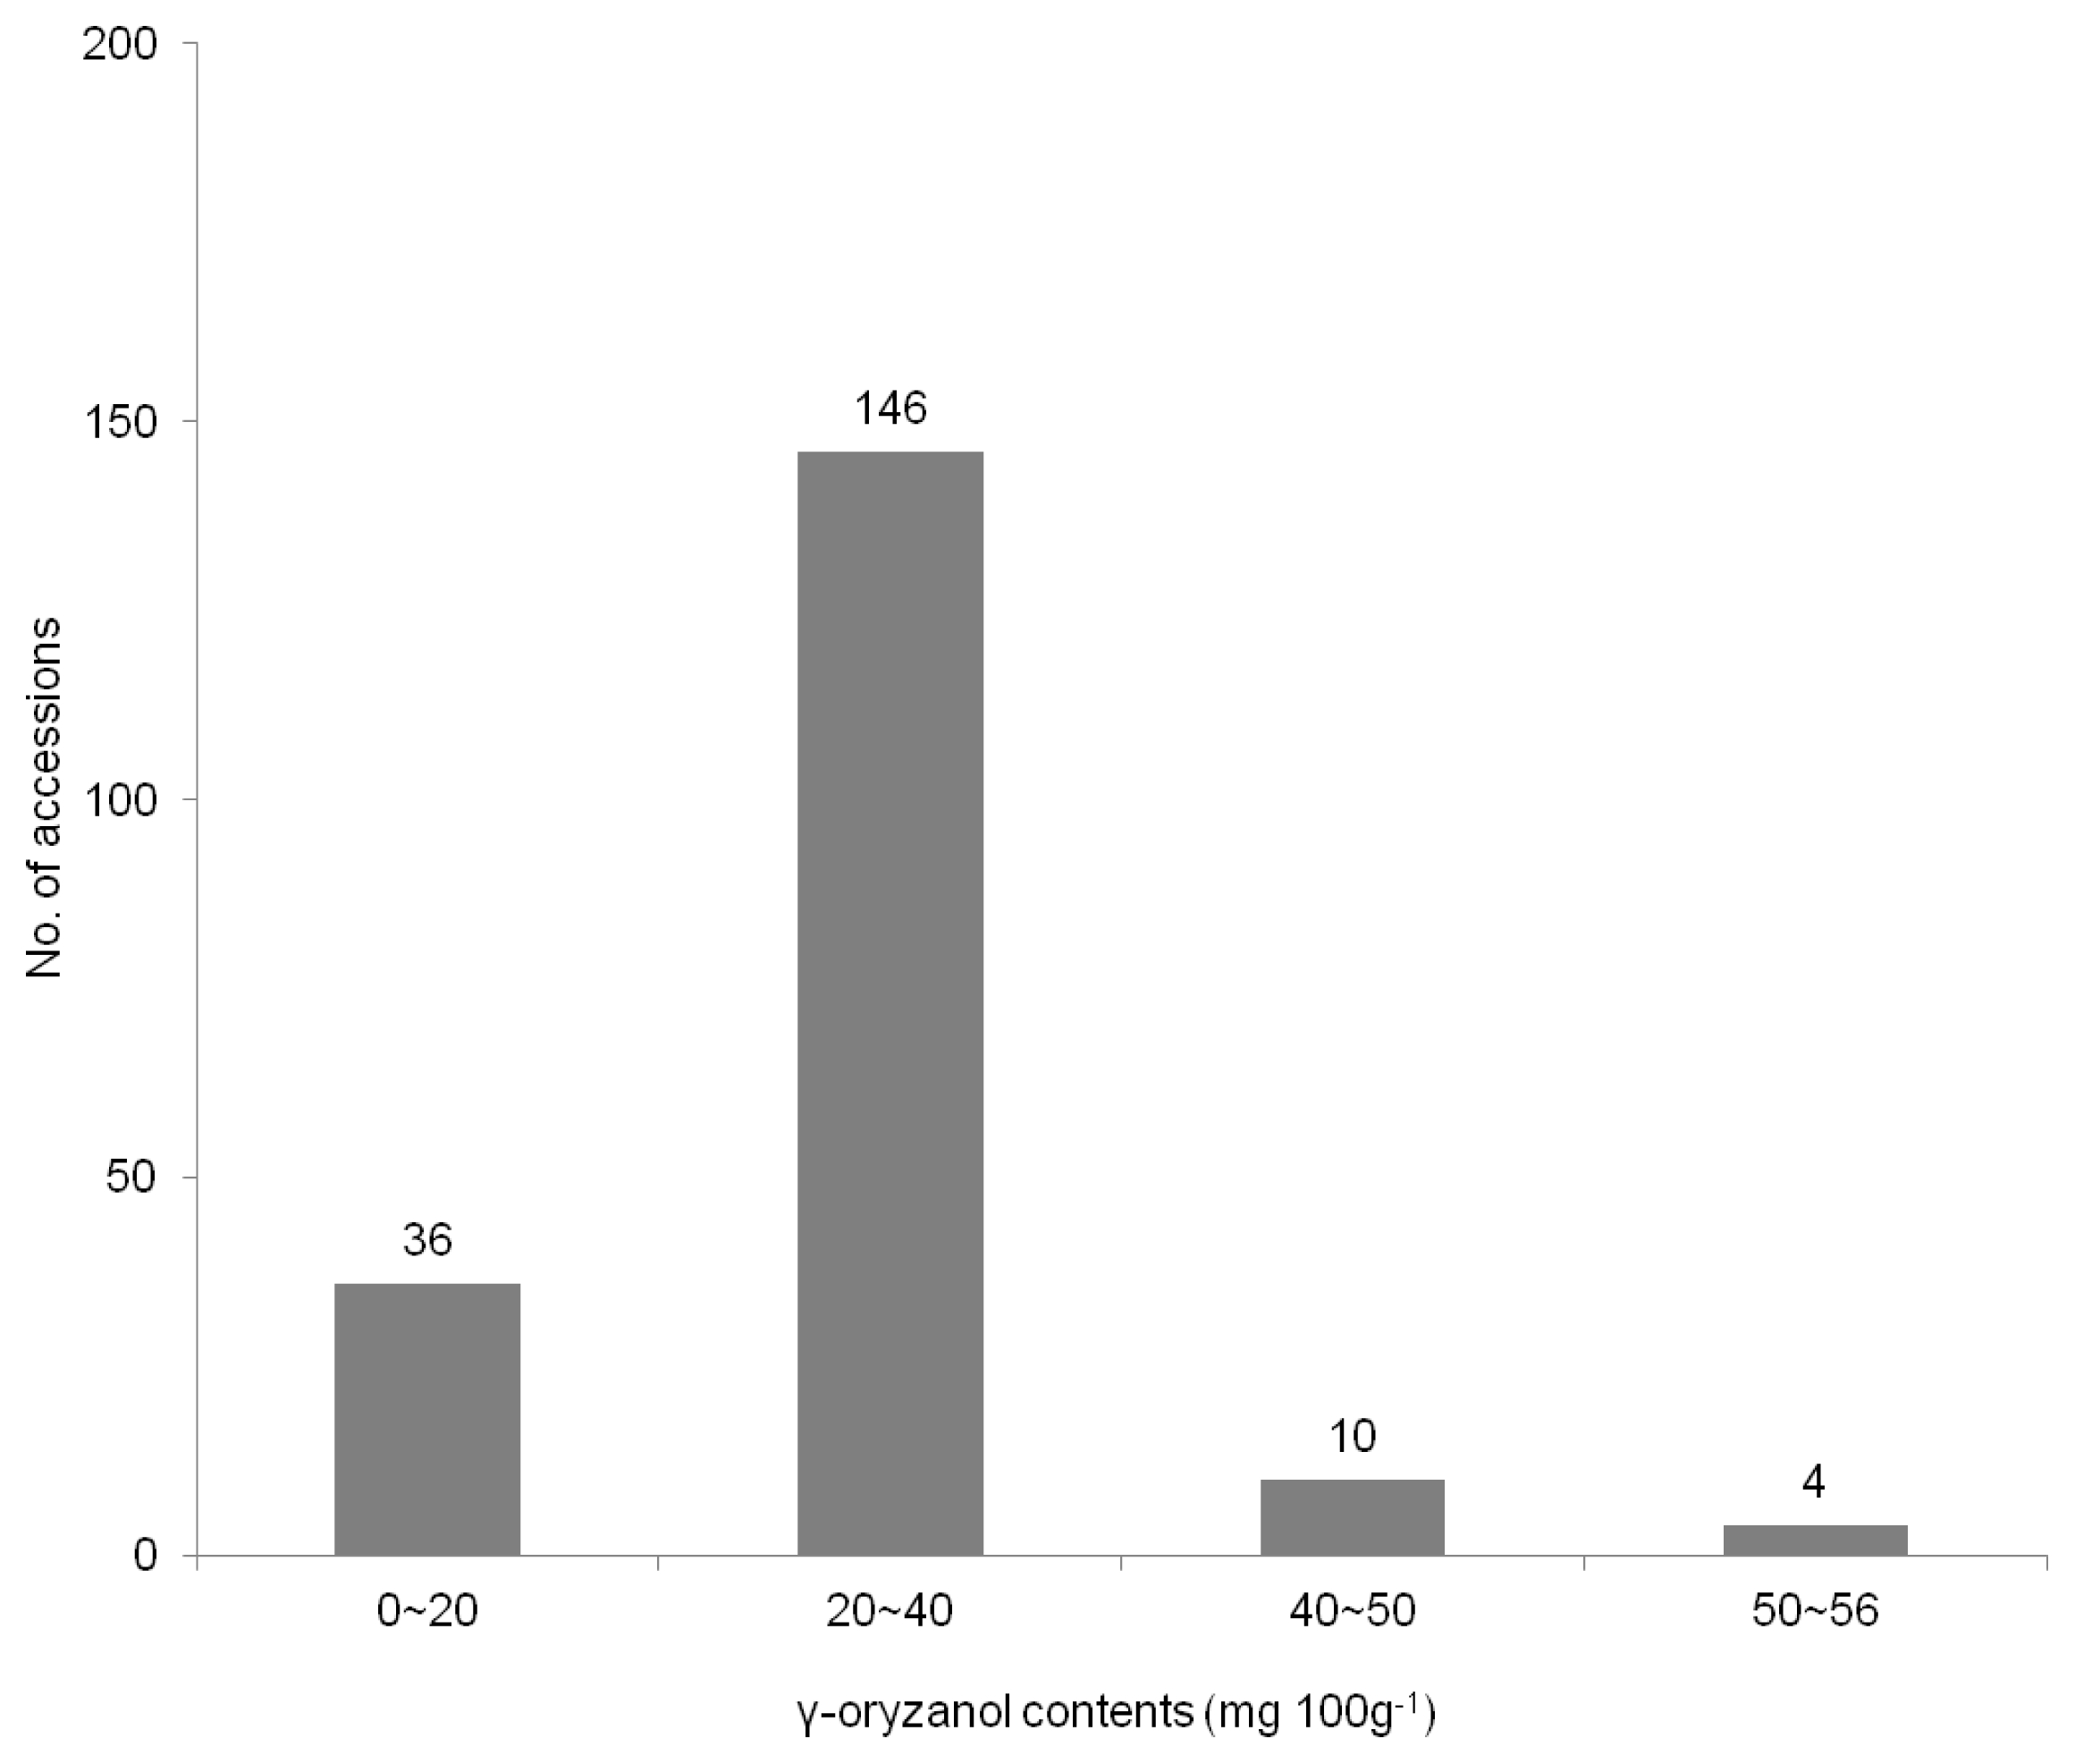
Fig. 2Comparison of the means of proportions expressed as the percentage of total γ-oryzanol in individual components isolated from grain of the rice germplasms.
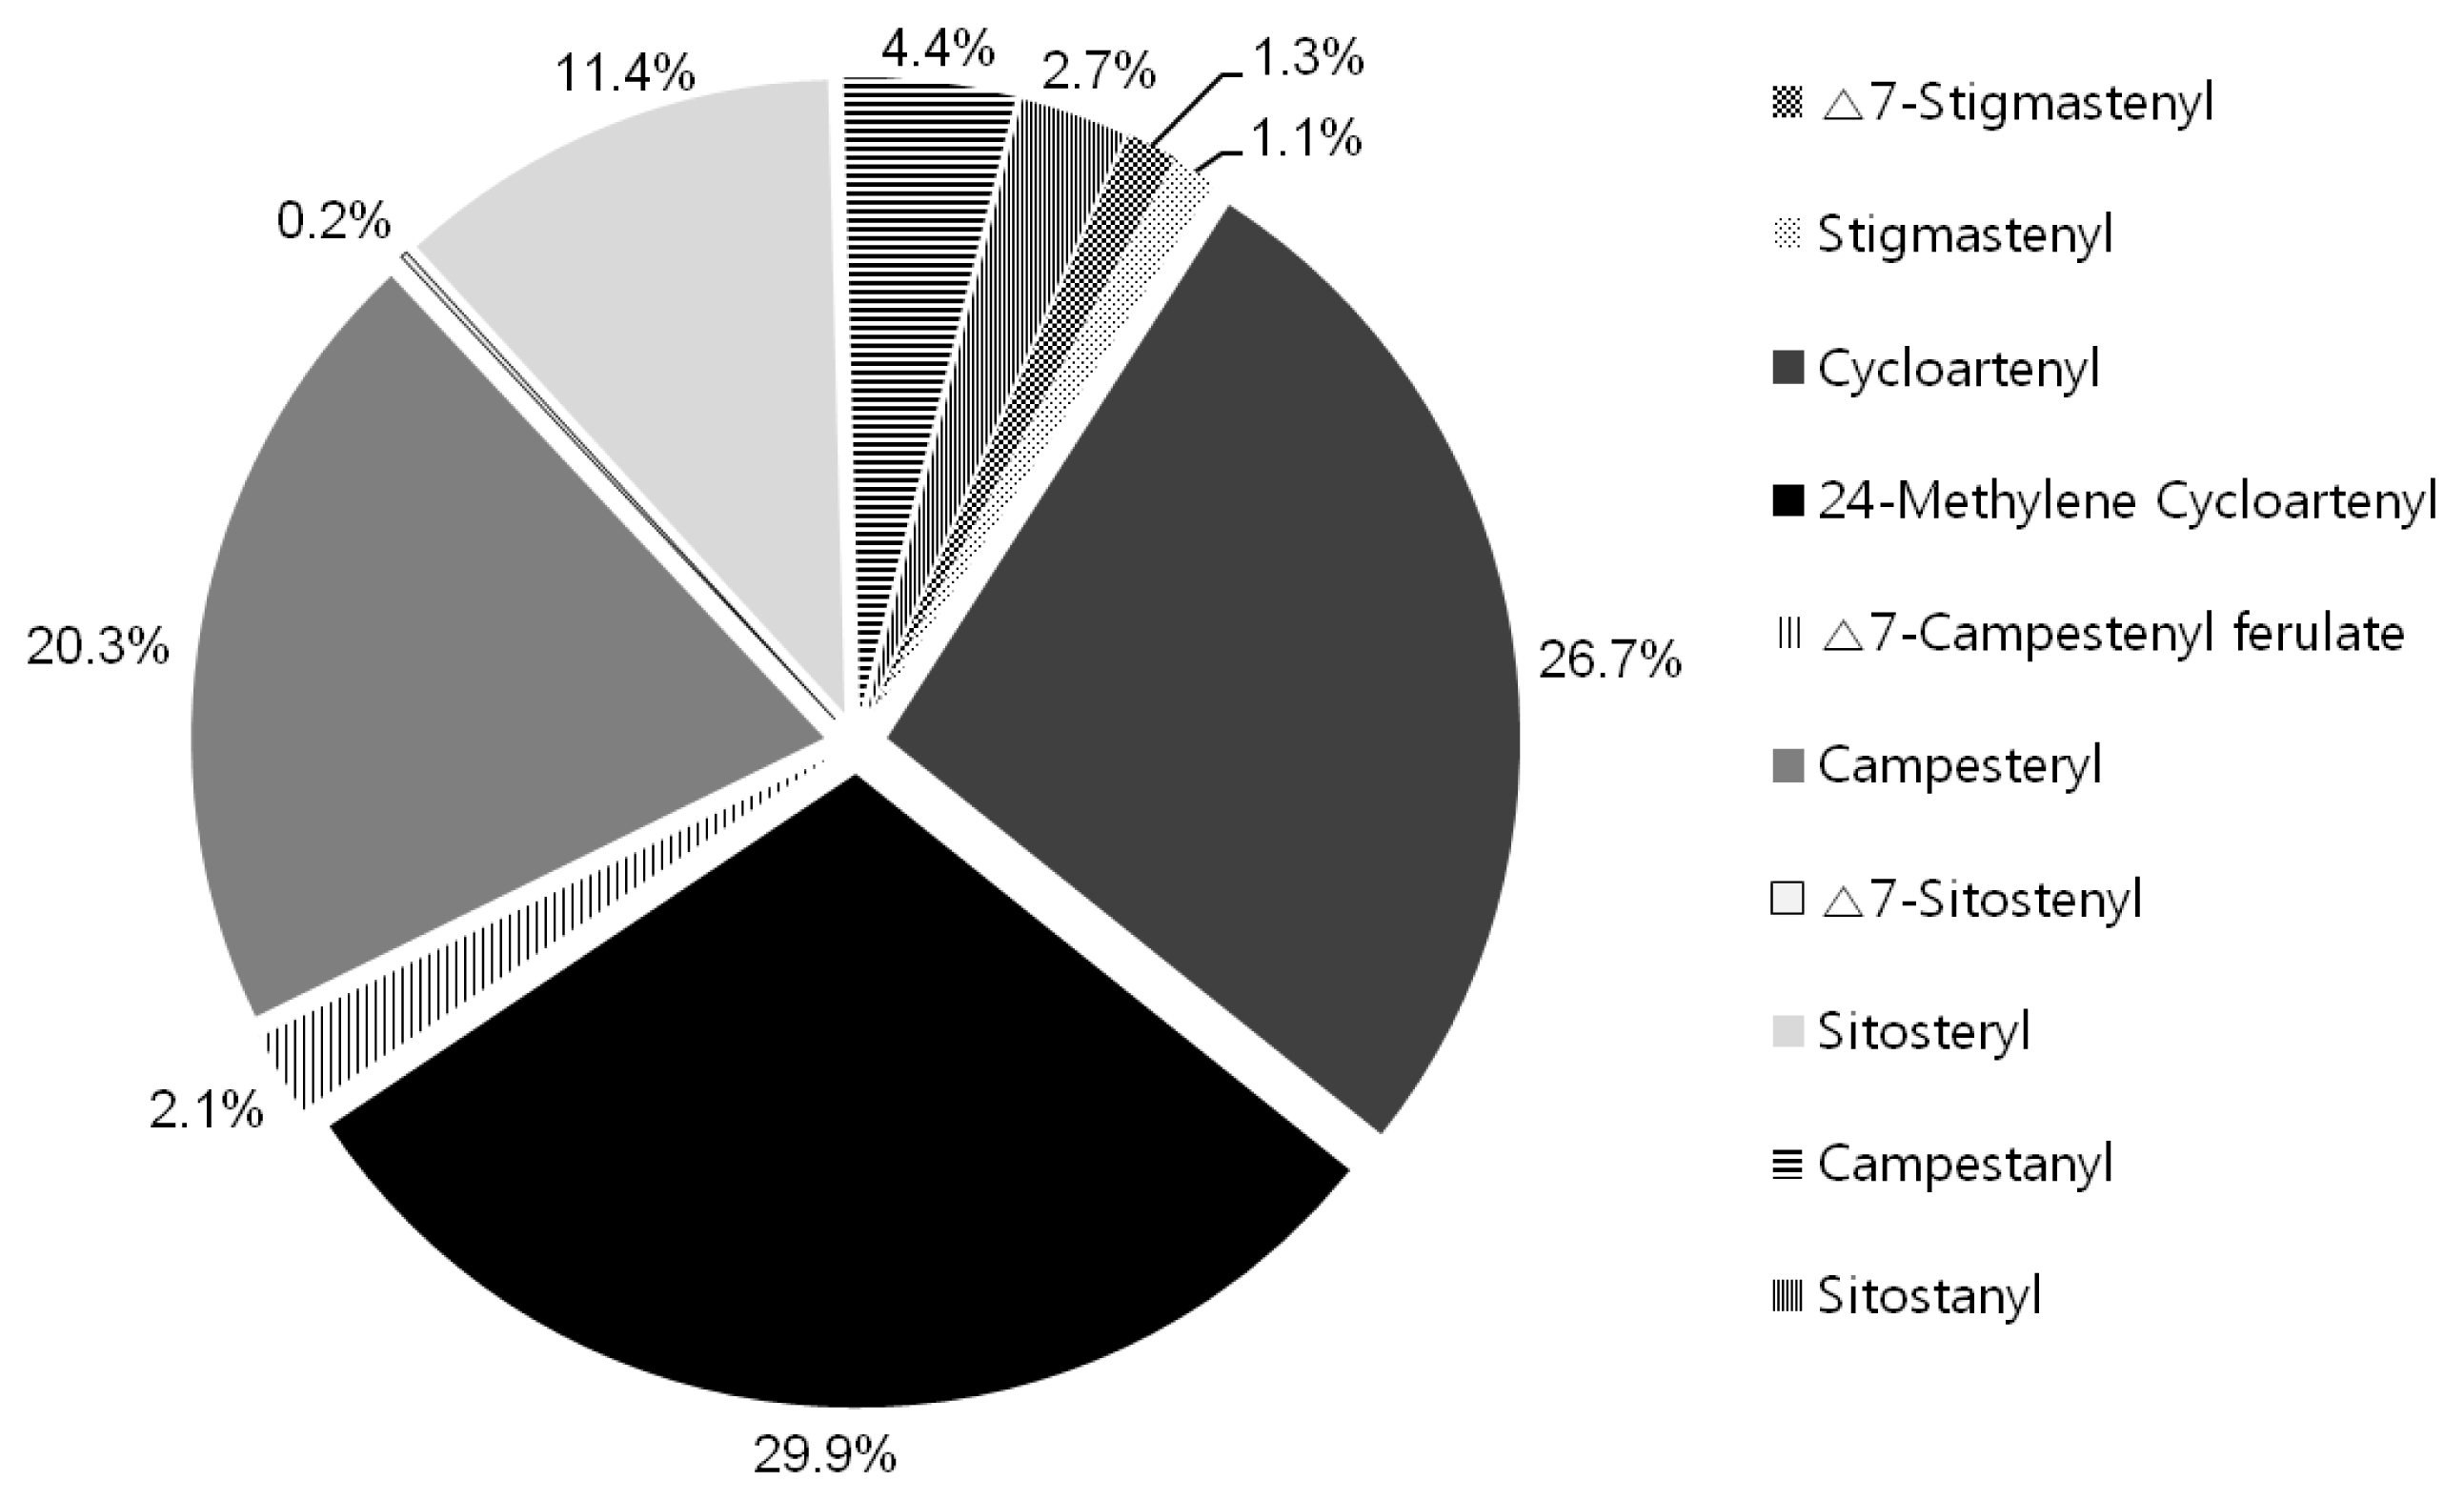
Fig. 3An UPGMA tree showing the genetic relationships among the 196 Korean landrace accessions. Triangle; accessions with high oryzanol content, Quadrangle; accessions with low oryzanol content.

Table 1List and total γ-oryzanol contents of 196 rice landrace accessions.
Table 1
|
Stock No. of genebank |
Accession name |
γ-oryzanol (mg 100g−1) |
|
IT004688 |
Ggaebyeo |
22.55 |
|
IT004692 |
Gasanbyeo |
24.45 |
|
IT004694 |
Gaksijeomjo |
22.51 |
|
IT004753 |
Gangdodo |
26.74 |
|
IT004760 |
Gangreungdo |
38.73 |
|
IT004768 |
Gangsan byeo |
17.3 |
|
IT004769 |
Gangbaedo |
27.1 |
|
IT004770 |
Gangwondo |
39.27 |
|
IT004771 |
Gangwonna |
37.14 |
|
IT004775 |
Gangcheongdo |
20.86 |
|
IT004811 |
Ge |
14.63 |
|
IT004839 |
Gyeongjobaekjo |
20.77 |
|
IT004899 |
Gwaksanjo |
21.62 |
|
IT004914 |
Gwansansaek |
21.42 |
|
IT005044 |
Guwangdo |
29.52 |
|
IT005046 |
Guwoldo |
14.88 |
|
IT005051 |
Gujungdo-1 |
22.56 |
|
IT005052 |
Gujungdo-2 |
34.31 |
|
IT005057 |
Gucheondo |
11.92 |
|
IT005068 |
Guhwangdo-1 |
21.19 |
|
IT005070 |
Guhwangdo-2 |
13.91 |
|
IT005076 |
Gunjo |
31.71 |
|
IT005095 |
Gwido |
22.87 |
|
IT005126 |
Geumdo |
36.03 |
|
IT005133 |
Geumjeomdo |
27.04 |
|
IT005142 |
Geumchangdo |
34.62 |
|
IT005205 |
Na-1 |
27.17 |
|
IT005206 |
Na-2 |
26.53 |
|
IT005216 |
Naengdo |
20.54 |
|
IT005223 |
Namgangbaekjo |
29.53 |
|
IT005500 |
Noindari |
46.09 |
|
IT005504 |
Noinjo-1 |
35.22 |
|
IT005505 |
Noinjo-2 |
20.29 |
|
IT005506 |
Noindo-1 |
34.05 |
|
IT005508 |
Noindo-2 |
25.62 |
|
IT005509 |
Noindo-3 |
27.97 |
|
IT005657 |
Nokdudo-1 |
11.47 |
|
IT005660 |
Nokdudo-2 |
20.77 |
|
IT005677 |
Neuseubyeo |
18.59 |
|
IT005678 |
Neutdakbyeo |
13.19 |
|
IT005679 |
Dadajo-1 |
27.22 |
|
IT005681 |
Dadajo-2 |
35.46 |
|
IT005682 |
Dadajo-3 |
26.37 |
|
IT005683 |
Dadajo-4 |
27.79 |
|
IT005689 |
Dadeogbereum |
35.16 |
|
IT005691 |
Dadoaek |
38.78 |
|
IT005693 |
Dadujo |
20.68 |
|
IT005694 |
Damagung |
24.16 |
|
IT005716 |
Dabaekjo |
28.59 |
|
IT005718 |
Daigolbyeo |
28.46 |
|
IT005736 |
Daigolna |
38.75 |
|
IT005742 |
Daegoldo-1 |
22.56 |
|
IT005743 |
Daegoldo-2 |
36.88 |
|
IT005754 |
Daegwando |
26.65 |
|
IT005756 |
Daeguna |
18.5 |
|
IT005762 |
Daegudo |
35.31 |
|
IT005835 |
Daejodo |
41.19 |
|
IT005882 |
Danduna |
22.69 |
|
IT005893 |
Dangdo |
21.79 |
|
IT005908 |
Dorae |
31.05 |
|
IT005915 |
Doaji |
25.24 |
|
IT005946 |
Dongsanjo-1 |
18.12 |
|
IT005948 |
Dongsanjo-2 |
31.94 |
|
IT005970 |
Dongobyeo |
21.96 |
|
IT005980 |
Dudo |
39.16 |
|
IT005987 |
Duchungjong-1 |
31.91 |
|
IT005989 |
Duchungjong-2 |
33.33 |
|
IT005994 |
Deokjeokjodo |
35.77 |
|
IT006000 |
Deulleongdeulchigi |
19.05 |
|
IT006010 |
Ddangjo |
23.43 |
|
IT006066 |
Maekjo |
29.33 |
|
IT006078 |
Monajo |
23.8 |
|
IT006084 |
Modo-1 |
28.93 |
|
IT006087 |
Modo-2 |
25.78 |
|
IT006089 |
Mojo |
25.28 |
|
IT006100 |
Monggeunchanarak |
22.82 |
|
IT006103 |
Mudaraegi |
31.15 |
|
IT006112 |
Musando |
47.34 |
|
IT006114 |
Musaek Jojeokjo |
25.71 |
|
IT006116 |
Muando |
41.51 |
|
IT006119 |
Muyeopseoldo |
27.2 |
|
IT006125 |
Mujudo |
50.04 |
|
IT006129 |
Migwang |
30.74 |
|
IT006138 |
Mido |
30.37 |
|
IT006151 |
Mijo |
35.5 |
|
IT006242 |
Mitdarae |
31.59 |
|
IT006243 |
Badol byeo |
29.77 |
|
IT006247 |
Baramdungguri |
32.08 |
|
IT006258 |
Bandalbyeo-1 |
32.07 |
|
IT006260 |
Bandalbyeo-2 |
43.56 |
|
IT006266 |
Banchonjo |
41.91 |
|
IT006298 |
Baekkiongzo |
23.18 |
|
IT006302 |
Baekgogna |
34.52 |
|
IT006310 |
Baekgwangok |
20.57 |
|
IT006328 |
Baekmangjo |
30.57 |
|
IT006354 |
Baekseok |
19.67 |
|
IT006366 |
Baekjanggun |
18.9 |
|
IT006372 |
Baekjo |
26.22 |
|
IT006376 |
Baekjicheongbyeo |
14.33 |
|
IT006380 |
Baekchalbyeo |
24.3 |
|
IT006385 |
Baecheon-1 |
31.61 |
|
IT006386 |
Baecheon-2 |
25.3 |
|
IT006396 |
Baekhaedal |
19.35 |
|
IT006397 |
Baekhyangjo |
26.11 |
|
IT006400 |
Beodeulbyeo |
18.45 |
|
IT006404 |
Beonjo |
15.48 |
|
IT006410 |
Beobpanhwa |
25.43 |
|
IT006424 |
Boribyeo |
11.32 |
|
IT006483 |
Bujari |
22.63 |
|
IT006520 |
Buldo |
30.03 |
|
IT006522 |
Buljo |
26.87 |
|
IT006538 |
Saducho |
25.1 |
|
IT006551 |
Sandadagido |
22.74 |
|
IT006554 |
Sando-1 |
22.2 |
|
IT006556 |
Sando-2 |
37.91 |
|
IT006559 |
Sandudo-1 |
27.19 |
|
IT006560 |
Sandudo-2 |
34.37 |
|
IT006577 |
Ssanmadeuragi |
19.21 |
|
IT006578 |
Ssalbyeo |
13.09 |
|
IT006596 |
Samgyeongjo |
33.09 |
|
IT006620 |
Sangdo-1 |
30.73 |
|
IT006622 |
Sangdo-2 |
50.05 |
|
IT006657 |
Seogandodo |
29.2 |
|
IT006663 |
Seorianjeunbaengi |
24.23 |
|
IT006684 |
Seoksanna |
30.11 |
|
IT006687 |
Seoksanjo |
23.34 |
|
IT006699 |
Seondal |
22.47 |
|
IT006735 |
Sodujo |
21.54 |
|
IT006768 |
Soemeoribyeo |
14.62 |
|
IT006772 |
Soemeorijijang |
31.71 |
|
IT006776 |
Soebenchigi |
24.38 |
|
IT006818 |
Susangjo |
42.87 |
|
IT007245 |
Suwonjo |
19.55 |
|
IT007254 |
Sujungjo |
22.49 |
|
IT007268 |
Ssubyeo |
30.24 |
|
IT007270 |
Sukna-1 |
22.04 |
|
IT007274 |
Sukna-2 |
20.83 |
|
IT007278 |
Sulsuldo |
31.81 |
|
IT007282 |
Sutdarkbyeo |
31.45 |
|
IT007286 |
Seungsiljo |
13.85 |
|
IT007290 |
Sseundegi |
22.16 |
|
IT007389 |
Sinbaekseok |
27.9 |
|
IT007436 |
Agabyeo |
23.21 |
|
IT007442 |
Agudo |
26.07 |
|
IT007446 |
Agukdo |
26.9 |
|
IT007458 |
Arongbyeo |
23.22 |
|
IT007460 |
Anna |
45.2 |
|
IT007464 |
Annamjo |
30.02 |
|
IT007486 |
Anjeunbaengi-1 |
19.35 |
|
IT007487 |
Anjeunbaengi-2 |
9.78 |
|
IT007532 |
Aedal |
29.34 |
|
IT007559 |
Aengmi |
21.46 |
|
IT007570 |
Yangdo |
32.42 |
|
IT007578 |
Eoreumbyeo |
15.33 |
|
IT007585 |
Yeobyeo |
30.13 |
|
IT007592 |
Yeosubyeo |
36.25 |
|
IT007596 |
Yeoussalbyeo |
19.32 |
|
IT007598 |
Yeonanjo |
17.08 |
|
IT007604 |
Yeolna |
24.13 |
|
IT007605 |
Yeolsulbyeo |
20.66 |
|
IT007622 |
Yejo |
25.98 |
|
IT007629 |
Orido-1 |
31.97 |
|
IT007630 |
Orido-2 |
24.66 |
|
IT007631 |
Orido-3 |
17.13 |
|
IT007633 |
Obaekjo-1 |
17.7 |
|
IT007634 |
Obaekjo-2 |
31.39 |
|
IT007684 |
Olmutge |
39.49 |
|
IT007688 |
Olbyeo |
23.04 |
|
IT007693 |
Olwaedu |
16.29 |
|
IT007714 |
Waengchal byeo |
54.72 |
|
IT007717 |
Oegukbyeo |
29.37 |
|
IT007721 |
Waejo |
25.82 |
|
IT007740 |
Yonamjo |
18.77 |
|
IT007742 |
Yongmyeonheuk |
25.35 |
|
IT007746 |
Yongcheon-1 |
25.69 |
|
IT007747 |
Yongcheon-2 |
29.38 |
|
IT007792 |
Wonjabyeo |
28.43 |
|
IT007801 |
Woljo |
30.26 |
|
IT007807 |
Yu |
34.74 |
|
IT007900 |
Yukwoljo |
37.21 |
|
IT007903 |
Eumeuchal |
55.85 |
|
IT007975 |
Eunjo |
20.12 |
|
IT007981 |
Eumjo |
21.97 |
|
IT007999 |
Irakdo |
38.85 |
|
IT008189 |
Icheonchunggubyeo |
22.22 |
|
IT008196 |
Inbujido |
32.97 |
|
IT008199 |
Inbujinado |
29.44 |
|
IT008255 |
Jandadagi |
31.56 |
|
IT008267 |
Jangsamdo |
30.35 |
|
IT008268 |
Jangsamdo |
22.39 |
|
IT008277 |
Jangjo-1 |
43.77 |
|
IT008278 |
Jangjo-2 |
45.48 |
|
IT008286 |
Jaeraesuyeom |
16.54 |
|
IT008289 |
Jaeraedo |
19.34 |
|
IT008293 |
Jaeraejodo-1 |
17.24 |
|
IT008295 |
Jaeraejodo-2 |
19.18 |
Table 2List of 10 accessions containing highest total γ-oryzanol (mg 100g−1) and the contents (%) of ten compositions in the γ-oryzanol among 196 rice landrace accessions.
Table 2
|
Stock No. of genebank |
1 |
2 |
3 |
4 |
5 |
6 |
7 |
8 |
9 |
10 |
γ-oryzanol (mg 100g−1) |
Clusters |
|
IT007903 |
2.0% |
1.5% |
23.9% |
31.8% |
2.1% |
18.1% |
0.7% |
11.9% |
5.2% |
2.8% |
55.85 |
Cluster 2 |
|
IT007714 |
2.3% |
1.6% |
23.2% |
31.1% |
2.0% |
18.7% |
0.7% |
12.0% |
5.3% |
3.0% |
54.72 |
Cluster 2 |
|
IT006622 |
0.9% |
1.1% |
27.7% |
27.1% |
4.8% |
8.6% |
0.8% |
6.6% |
12.0% |
10.3% |
50.05 |
Cluster 1 |
|
IT006125 |
1.2% |
1.3% |
28.1% |
31.4% |
0.8% |
20.6% |
0.5% |
12.4% |
2.3% |
1.5% |
50.04 |
Cluster 3 |
|
IT006112 |
0.3% |
1.2% |
21.7% |
31.5% |
1.9% |
8.5% |
0.7% |
10.3% |
10.7% |
13.1% |
47.34 |
Cluster 6 |
|
IT005500 |
0.7% |
1.1% |
29.9% |
34.3% |
1.4% |
17.4% |
0.5% |
9.8% |
3.3% |
1.6% |
46.09 |
Cluster 2 |
|
IT008278 |
1.9% |
1.2% |
23.0% |
31.8% |
2.0% |
22.5% |
0.0% |
11.3% |
4.3% |
2.0% |
45.48 |
Cluster 3 |
|
IT007460 |
1.0% |
1.1% |
36.2% |
27.1% |
0.7% |
18.2% |
0.4% |
11.6% |
2.2% |
1.5% |
45.2 |
Cluster 4 |
|
IT008277 |
1.9% |
1.1% |
23.2% |
34.3% |
2.0% |
21.3% |
0.0% |
11.2% |
3.4% |
1.7% |
43.77 |
Cluster 3 |
|
IT006260 |
0.9% |
1.1% |
26.8% |
32.2% |
1.0% |
19.7% |
0.8% |
12.7% |
2.8% |
2.0% |
43.56 |
Cluster 3 |
Table 3Genetic parameters obtained from the 46 SSR markers that were used to evaluate the 196 rice landrace accessions.
Table 3
|
SSR marker |
Chromosome |
MAF
|
NA
|
HE
|
HO
|
PIC |
|
RM1 |
1 |
0.546 |
9 |
0.636 |
0.005 |
0.594 |
|
RM5 |
1 |
0.451 |
5 |
0.682 |
0.036 |
0.628 |
|
RM580 |
1 |
0.230 |
11 |
0.843 |
0.031 |
0.824 |
|
RM246 |
1 |
0.341 |
7 |
0.729 |
0.000 |
0.680 |
|
RM174 |
2 |
0.972 |
3 |
0.055 |
0.005 |
0.055 |
|
RM048 |
2 |
0.350 |
25 |
0.836 |
0.000 |
0.825 |
|
RM3857 |
2 |
0.301 |
13 |
0.816 |
0.025 |
0.793 |
|
RM6165 |
2 |
0.990 |
2 |
0.021 |
0.010 |
0.021 |
|
RM12676 |
2 |
0.563 |
2 |
0.492 |
0.000 |
0.371 |
|
RM135 |
3 |
0.979 |
4 |
0.041 |
0.010 |
0.041 |
|
RM3766 |
3 |
0.309 |
13 |
0.775 |
0.046 |
0.743 |
|
RM231 |
3 |
0.833 |
6 |
0.295 |
0.000 |
0.281 |
|
RM232 |
3 |
0.244 |
15 |
0.855 |
0.000 |
0.841 |
|
RM252 |
4 |
0.833 |
4 |
0.282 |
0.015 |
0.249 |
|
RM349 |
4 |
0.644 |
6 |
0.516 |
0.005 |
0.457 |
|
RM241 |
4 |
0.464 |
12 |
0.714 |
0.000 |
0.680 |
|
RM6629 |
4 |
0.968 |
3 |
0.062 |
0.000 |
0.061 |
|
RM16427 |
4 |
0.932 |
3 |
0.127 |
0.000 |
0.120 |
|
RM13 |
5 |
0.829 |
4 |
0.289 |
0.010 |
0.257 |
|
RM249 |
5 |
0.211 |
17 |
0.892 |
0.000 |
0.883 |
|
RM3322 |
5 |
0.797 |
5 |
0.335 |
0.000 |
0.297 |
|
RM19159 |
5 |
0.655 |
11 |
0.524 |
0.040 |
0.483 |
|
RM103 |
6 |
0.964 |
4 |
0.071 |
0.010 |
0.070 |
|
RM253 |
6 |
0.500 |
7 |
0.667 |
0.031 |
0.622 |
|
RM253 |
6 |
0.541 |
6 |
0.642 |
0.000 |
0.602 |
|
OSR21 |
6 |
0.709 |
5 |
0.432 |
0.000 |
0.367 |
|
RM197 |
6 |
0.990 |
3 |
0.021 |
0.000 |
0.021 |
|
WxOligo |
6 |
0.549 |
7 |
0.546 |
0.000 |
0.455 |
|
RM418 |
7 |
0.439 |
11 |
0.753 |
0.026 |
0.729 |
|
RM1306 |
7 |
0.337 |
21 |
0.851 |
0.036 |
0.842 |
|
RM214 |
7 |
0.259 |
21 |
0.879 |
0.000 |
0.870 |
|
RM3718 |
7 |
0.516 |
5 |
0.524 |
0.000 |
0.412 |
|
RM149 |
8 |
0.567 |
7 |
0.599 |
0.015 |
0.545 |
|
RM044 |
8 |
0.495 |
12 |
0.708 |
0.000 |
0.683 |
|
RM310 |
8 |
0.316 |
12 |
0.820 |
0.045 |
0.801 |
|
RM23455 |
8 |
0.834 |
3 |
0.290 |
0.000 |
0.270 |
|
RM444 |
9 |
0.922 |
6 |
0.148 |
0.000 |
0.145 |
|
RM257 |
9 |
0.544 |
8 |
0.595 |
0.000 |
0.530 |
|
RM171 |
10 |
0.961 |
3 |
0.075 |
0.005 |
0.074 |
|
RM228 |
10 |
0.526 |
8 |
0.650 |
0.000 |
0.608 |
|
RM6144 |
10 |
0.927 |
2 |
0.135 |
0.000 |
0.126 |
|
RM021 |
11 |
0.317 |
11 |
0.764 |
0.000 |
0.727 |
|
RM206 |
11 |
0.143 |
33 |
0.928 |
0.000 |
0.924 |
|
RM519 |
12 |
0.982 |
4 |
0.035 |
0.005 |
0.035 |
|
RM235 |
12 |
0.922 |
5 |
0.148 |
0.000 |
0.144 |
|
RM247 |
12 |
0.356 |
12 |
0.739 |
0.000 |
0.701 |
|
|
Mean |
|
0.610 |
8.6 |
0.497 |
0.009 |
0.467 |
|
Min |
|
0.143 |
2 |
0.021 |
0.000 |
0.021 |
|
Max |
|
0.990 |
33 |
0.928 |
0.046 |
0.924 |
Table 4ANOVA test of γ-oryzanol content based on the pylogenetic clusters.
Table 4
|
Source |
DF |
Sum of Squares |
Mean Square |
F Value |
Pr > F |
|
|
Model |
6 |
2926.4 |
487.7 |
8.34 |
<.0001 |
|
|
Cluster |
N |
Total (γ-oryzanol) |
Duncan groupingz)
|
|
|
Mean |
Std Dev |
|
Cluster 1 |
6 |
33.2 |
10.3 |
AB |
|
Cluster 2 |
18 |
32.6 |
11.6 |
AB |
|
Cluster 3 |
21 |
34.5 |
8.2 |
A |
|
Cluster 4 |
40 |
28.3 |
6.0 |
BC |
|
Cluster 5 |
29 |
24.2 |
7.1 |
C |
|
Cluster 6 |
24 |
26.1 |
7.5 |
C |
|
Cluster 7 |
58 |
23.6 |
6.9 |
C |
References
- Bergman CJ, Xu Z. 2003. Genotype and environment effects on tocopherol, tocotrienol, and γ-oryzanol contents of southern U.S. rice. Cereal Chem. 80: 446-449.
- Boonsit P, Pongpiachan P, Julsrigival S, Karladee D. 2010. Gamma oryzanol content in glutinous purple rice landrace varieties. CMU J Nat Sci. 9(1): 151-157.
- Chae JC. 2002. Present status and prospect of crop production technology to improve the crop quality and functionality. Korean J Crop Sci. 47: 1-14.
- Cicero AF, Gaddi A. 2001. Rice bran oil and gamma-oryzanol in the treatment of hyperlipoproteinaemias and other conditions. Phytother Res. 15(4): 277-289.
- DeWoody JA, Honeycutt RL, Skow LC. 1995. Microsatellite markers in white-tailed deer. J Hered. 86: 317-319.
- Fardet A, Rock E, Remesy C. 2008. Is the in vitro antioxidant potential of whole-grain cereals and cereal products well reflected in vivo. J Cereal Sci. 48: 258-276.
- Ganapathy KN, Gnanesh BN, Gowda MB, Venkatesha SC, Gomashe SS, Channamallikarjuna V. 2011. AFLP analysis in pigeonpea (Cajamus cajan (L.) Millsp.) revealed close relationship of cultivated genotypes with some of its wild relatives. Genet Resour Crop Evol. 58: 837-847.
- Ishihara M, Ito Y, Nakakita T, Maehama T, Hieda S, Yamamoto K, Ueno N. 1982. Clinical effect of gamma-oryzanol on climacteric disturbance on serum lipid peroxides. Nippon Sanka Fujinka Gakkai Zasshi. 34(2): 243-251.
- Kim DH, Moon KD, Rhee JS. 1995. Measurement of superoxide dismutase-like activity of natural antioxidants. Biosci Biotechnol Biochem. 59: 822-826.
- Kobayashi A, Ebana K, Fukuoka S, Nagamine T. 2006. Microsatellite markers revealed the genetic diversity of an Old Japanese Rice Landrace ‘Echizen’. Genet Resour Crop Evol. 53(3): 499-506.
- Lee J-S, Farooq M, Lee DJ. 2011. Relationship of soluble phenolics and γ-oryzanol contents with antioxidant activity in pigmented rice. Crop Environ. 2(2): 8-14.
- Liu K, Muse SV. 2005. PowerMarker: an integrated analysis environment for genetic marker analysis. Bioinformatics. 21: 2128-2129.
- Miller A, Engel KH. Content of γ-Oryzanol and Composition of Steryl Ferulates in Brown Rice (Oryza sativa L.) of European Origin. J Agric Food Chem. 54(21): 8127-8133.
- Nakayama S, Manabe A, Suzuki J, Sakamoto K, Inagake T. 1987. Comparative effects of two forms of γ-oryzanol in different sterol compositions on hyperlipidemia induced by cholesterol diet in rats. Jpn J Pharmacol. 44(2): 135-143.
- Odile F-R, Gianluca B, Pamela A, Stefano C, Anna P, Laetitia B, Elisabetta L, Pietro P. 2011. Assessment of genetic diversity in Italian rice germplasm related to agronomic traits and blast resistance (Magnaporthe oryzae). Mol Breeding. 27: 233-246.
- Oh CH, Oh SH. 2004. Effects of germinated brown rice extracts with enhanced levels of GABA on cancer cell proliferation and apoptosis. J Med Food. 7: 19-23.
- Park YJ, Dixit A, Ma KH, Lee JK, Lee MH. 2008. Evaluation of genetic diversity and relationships wothin an on-farm collection of Perilla frutescens (L.) Britt. using microsatellite markers. Genet Resour Crop Evol. 55: 523-535.
- Pervaiz ZH, Rabbani MA, Khaliq I, Pearce SR, Malik SA. 2010. Genetic diversity associated with agronomic traits using microsatellite markers in Pakistani rice landraces. Elect J Biotech. 13: 1-12.
- Rohrer CA, Siebenmorgen TJ. 2004. Nutraceutical concentrations within the bran of various rice kernel thickness fractions. Biosyst Eng. 88: 453-460.
- Scavariello EM, Arellano DB. 1998. Gamma-oryzanol: an important component in rice bran oil. Arch Latinoam Nutr. 48(1): 7-12.
- Schuelke M. 2000. An economic method for the fluorescent labeling of PCR fragments. Nat Biotechnol. 18: 233-234.
- Tamura K, Dudley J, Nei M, Kumar S. 2007. MEGA4: molecular evolutionary genetics analysis (MEGA) software version 4.0. Mol Biol Evol. 24: 1596-1599.
- Verma N, Rana MK, Negi KS, Kumar G, Bhat KV, Park YJ, Bisht IS. 2010. Assessment of genetic diversity in Indian perilla [Perilla frutescens (L.) Britton] landraces using STMS markers. Indian J Biotech. 9: 43-49.
- Villa TCC, Maxted N, Scholten M, Ford-Lloyd B. 2006. Defining and identifying crop landraces. Plant Genet Resour. 3: 373-384.
- Yoshie A, Kanda A, Nakamura T, Igusa H, Hara S. 2009. Comparison of g-Oryzanol contents in crude rice bran oils from different sources by various determination methods. J Oleo Sci. 58(10): 511-518.
- Yuzbasioglu E, Ozcan S, Acik L. 2006. Analysis of genetic relationships among turkish cultivars and breeding lines of Lens culinatis mestile using RAPD markers. Genet Resour Crop Evol. 53: 507-514.
- Xu Z, Godber JS. 1999. Purification and Identification of components of gamma oryzanol in rice bran oil. J Agric Food Chem. 47: 2724-2728.