Abstract
Gene flow events from genetically modified (GM) rice to adjacent non-GM rice lines naturally happen in the field. GM rice lines containing desirable agronomic traits such as tolerance to abiotic stresses and resistance to biotic stresses can be used to cross with non-GM cultivated rice and also to wild species of rice. This event can eventually lead to offspring which possess traits that allows a better chance of survival in the field. However this phenomenon has the possibility to produce undesirable effect in the environment surrounding the rice field. The objective of this study was to determine the out-crossing rate of GM rice to cultivated rice. Transgenic rice, Hwangkembyeo (containing beta-carotene enhancing gene and bar gene) and cultivated rice, Nakdongbyeo (mother plant of Hwangkembyeo) were used in this study. Results showed that most gene flow events occurred within 1 m range. In particular, gene flow events mostly happened within 30 cm, while it was rarely observed beyond 90 cm range. The maximum distance for gene flow event was observed at 6 m range however the sharp cut point distance was observed at 60–90 cm range. The prevailing gene flow direction was Northwest (NW) which coincided with the prevailing wind of Southeastern (SE) direction. Wind direction and distance were found to be the most important factors for determining rice out-crossing rate. But for more accurate prevention of GM gene flow, many factors should be considered like the local weather condition, wind direction, wind speed and flowering time.
-
Key words: Genetically modified (GM) rice, Gene flow, Hwangkembyeo, Out-crossing rate
INTRODUCTION
Genetic engineering technology for breeding superior crop has been highly promoted for the last several decades and is considered as a future technology that can save the world population from food starvation. Unfortunately, the general public assumes that genetically modified (GM) crop can harm human health and affect natural environment. Because of these misconceptions, GM crops are still not widely accepted by consumers worldwide. So despite the vigorous studies and efforts on GM crops, cultivation and commercial use of GM crops are severely limited around the world. To overcome these limitations about GM crop cultivation and GM food utilization, many kinds of GM crop safety studies should be carried out such as GM food safety, gene flow problem and environmental effects. The most important point to know about studying GM crops is the ecological and harmful effects of GM food to organisms; particularly to the human health. In addition, gene flow event from GM crop to wild plants by cross-pollination is a very critically argued point because cross-pollination by pollen can easily happen anywhere in natural condition. And it can also cause serious problems to the ecosystem around farming fields (
Lu and Snow 2005;
Lu and Yang 2009).
Rice is the most important cereal crop especially in Asian countries. Most of Asian countries like China, Japan, Korea and other Southeast Asian countries use rice as their staple food which suggests that about half of the world population consumes rice for food (FAO 2004). Also in the plant biotechnology field, rice has been used as a foundational research crop, for instance, in the genome project and as much of transgenic studies (
IRGSP 2005). Even though rice is widely used in transgenic studies, there is no commercially produced transgenic rice because of fear to unknown food safety of GM rice and supposedly harmful effect to the ecosystem. During the past several decades, many GM rice were developed that possess many excellent traits like high amounts of beta-carotene (golden rice), high protein content, disease and insect resistance, herbicide resistance, and stress tolerance (
Paine et al. 2005;
Jeong et al. 2006;
Lee et al. 2009;
Lee 2010). To utilize these enhanced GM rice traits, numerous studies are required to show the effect and safety of GM rice to the ecosystem. In the near future, it is certain that massive cultivation of GM rice will be a key direction to alleviate world starvation and consumers’ requirement on high-quality food.
In rice cultivated fields, wild and weedy rice coexist in close proximity with cultivated rice. It also has the potential to cross-pollinate within varieties of rice especially those that are established nearby GM rice. In Asian rice cultivation fields, most of wild and weedy rice have AA genome type that is the same with cultivated rice (
Oryza sativa L). Even though the out-crossing rate between cultivated rice and weedy rice is very low, both have high sexual compatibility (
Song et al. 2002;
Song et al. 2003;
Song et al. 2004;
Chen at al. 2004;
Messeguer et al. 2004). Several studies that used male-sterile lines reported that rice pollen can be dispersed to more than 100 m (
Song et al. 2004;
Jia et al. 2007;
Yuan et al. 2007). With this information, gene flow from cultivated rice to wild or weedy rice was proven to be continuously happening in the field naturally. However, since cultivated rice is a self-pollinated crop, out-crossing rate is very low, approximately <1%. Likewise, it was also reported that the out-crossing rate of GM rice to cultivated rice is less than 1% (
Messeguer et al. 2001;
Messeguer et al. 2004). Even though there is a very low out-crossing rate, GM rice has the potential to cross with other rice lines, which may eventually affect agricultural ecosystem and cause unknown phenomena. Therefore, the potential of gene flow events and its succeeding consequences should be seriously studied and investigated for ecological safety.
MATERIALS AND METHODS
Pollen donor
Hwangkembyeo, a japonica genetically modified (GM) rice cultivar, was used as a pollen donor. This cultivar is Nakdongbyeo-based GM rice that contains a beta-carotene enhancing gene and Basta-resistance gene. Beta-carotene is responsible for a distinct yellow seed color in transgenic rice which is converted to Vitamin A in animal organ. When Hwangkembyeo pollen is out-crossed with non-GM rice, it produces a yellow seed color. This makes it easier to classify GM rice from non-GM rice.
Pollen recipient
A japonica cultivar Nakdongbyeo, the mother cultivar of Hwangkembyeo, was used as the pollen recipient. Because Nakdongbyeo is the mother plant of Hwangkembyeo, both share similar characteristics especially during flowering time (August 20th) and plant maturation. Also, sexual compatibility is high between these two varieties. In addition, red rice (wild rice) was used as a second pollen recipient and IR36 (indica rice) was used as the third pollen recipient in 2010.
Experimental design in 2009
The field experiment was carried out in Gunwi GM field, Kyungpook province in South Korea.
Fig. 1A shows the detailed experimental design used in the 2009 study. The total size of the experiment plot was 16 m × 16 m (256 m
2). A total of 40 Hwangkembyeo parental lines were planted in the center of the experiment plot 1 m × 1 m (1 m
2), surrounded with Nakdongbyeo plants (pollen recipient) which occupied a total area of 255 m
2. The plant spacing used was 15 × 30 cm.
Fig. 1B shows the detailed experimental design used in the 2010 study. A total of 4 experimental plots were designed for sampling in 8 directions. The sampling plot directions were North (N), South (S), East (E), West (W), Northeast (NE), Northwest (NW), Southeast (SE), and Southwest (SW). At the center of the sampling plot, 6 lines of Hwangkembyeo were planted (1.5 m × 3.2 m). The total number of pollen donor in each plot was 396. In addition, 3 kinds of pollen recipients were planted in both sides of the pollen donor. The 22 pollen recipients were planted in a row and a total of 22 lines for each pollen recipients were planted. The total individual experiment plot size was 7.4 m × 3.2 m.
Weather scoring
An automatic weather scoring machine located outside the experimental plot was used to measure the weather conditions. Weather parameters such as wind direction, wind speed, temperature and amount of rainfall were recorded every 30 minutes during the period of rice flowering from August 9–31, 2009.
Seed sampling
In 2009, sampling was conducted in 4 directions (NE, SW, SE, and NW). In 2010 sampling was conducted in 8 directions (N, S, E, W, NE, NW, SE, and SW). The sampling distances used were 30, 60, 90, 120, 240, 360, 480 and 600 cm away from Hwangkembyeo area. A total of 6,500 seeds were collected in every plot for use in gene flow frequency test. Seed coat color determination was performed using 6,000 seeds and evaluation for Basta resistance was carried out using 500 seeds.
Assessment of gene flow frequency by Basta resistance test
For each sampling plot, 500 seeds were sampled randomly. Seeds were germinated/planted on pots and were sprayed with Basta (ammonium glufosinate) herbicide twice (2 and 3 weeks interval) with concentration recommended by company (Bayer CropScience Co.). Gene flow frequency was calculated as follows:
Assessment of gene flow frequency by seed coat color determination
About 6,000 seeds were sampled randomly in each plot. The seeds were milled and divided into two groups, white-colored seeds and yellow-colored seeds. The white-colored seeds correspond to the self-pollinated non-GM seed while the yellow-colored seeds correspond to the cross-pollinated GM seeds. Total gene frequencies were calculated as follows:
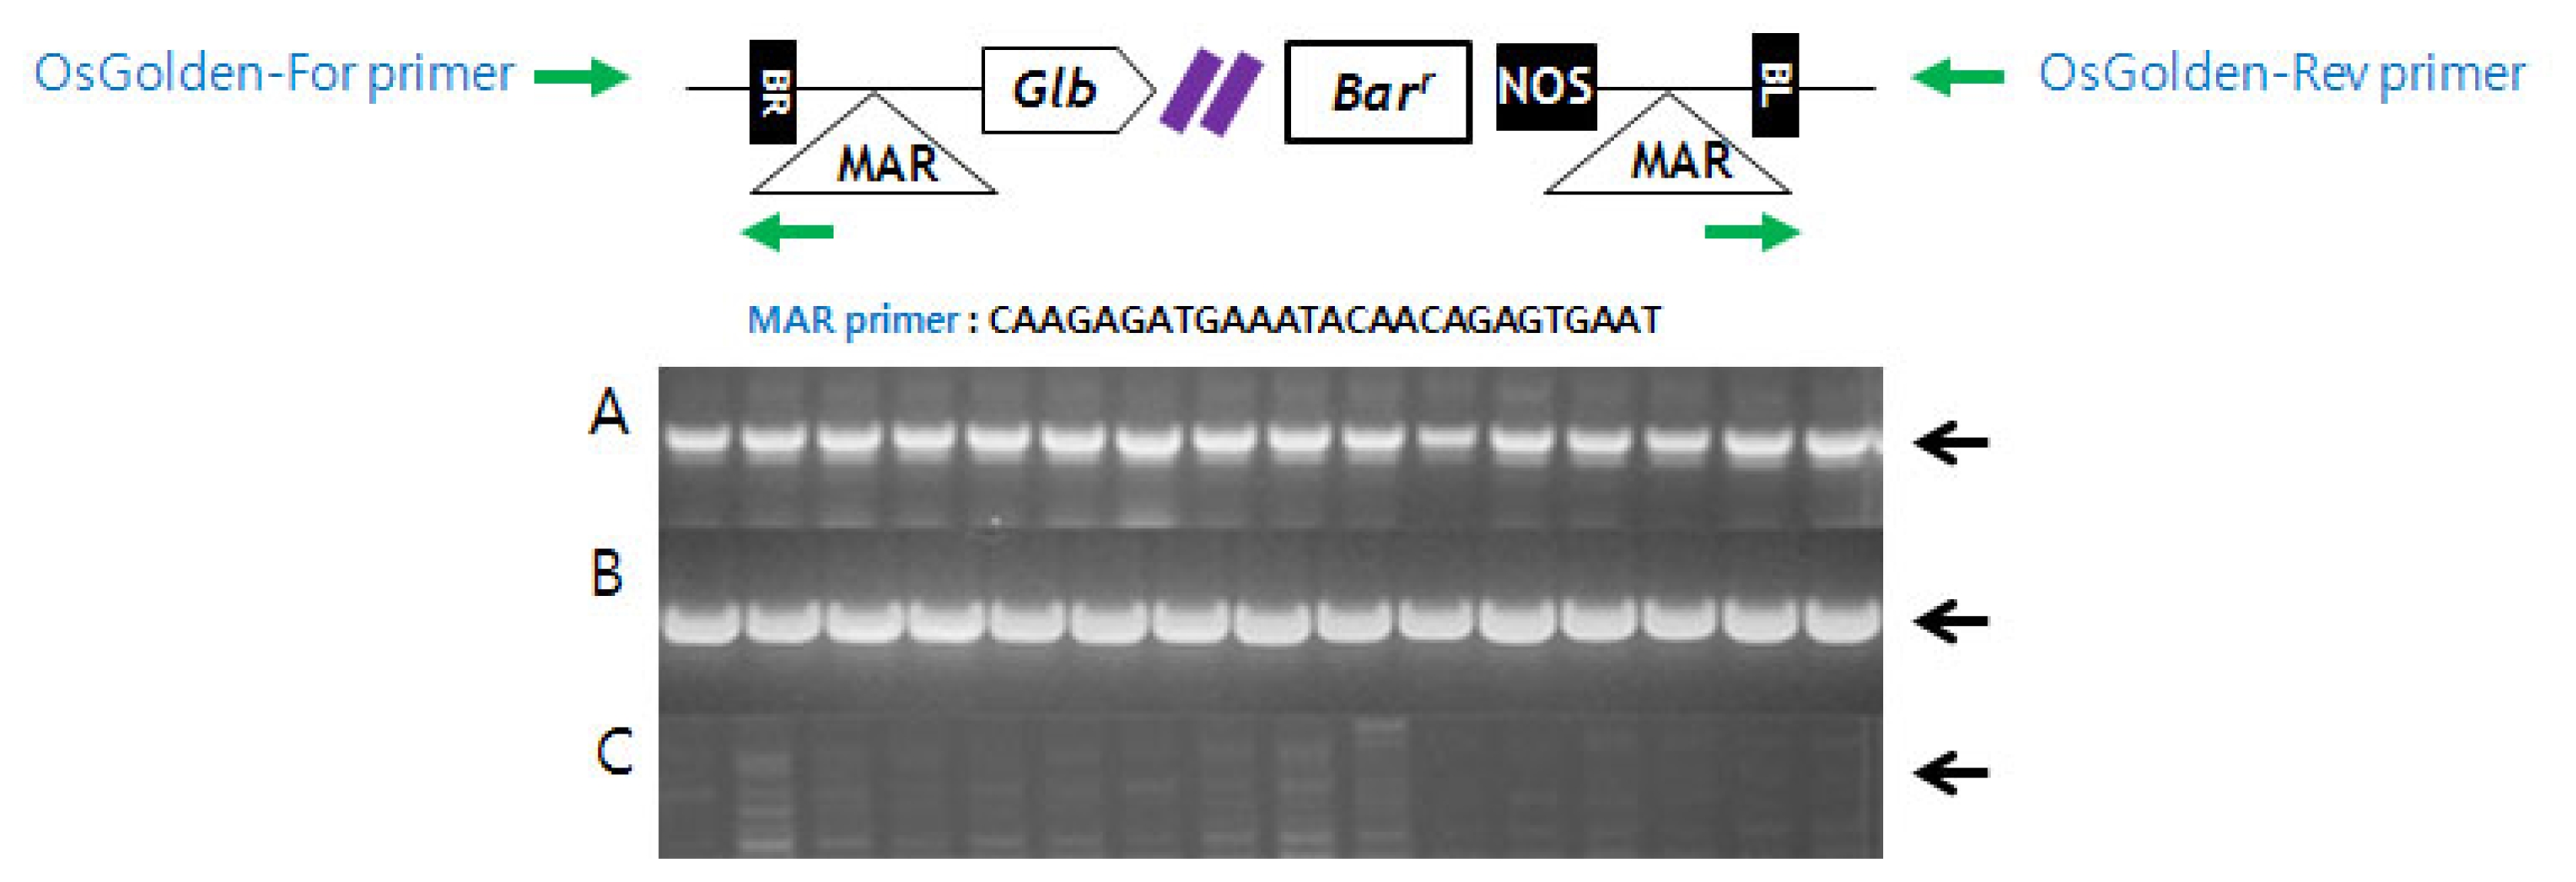
PCR analysis of Basta-resistant plants
T-DNA confirmation in Basta-resistant plants was conducted using the primer sets of Bar, MAR and OsGolden. MAR primer was designed from MAR sequences located on the T-DNA site as an inverted repeat near each border sequence. OsGolden primer was designed from the T-DNA flanking sequences.
Bar-For (5′-CACTACATCGAGACAAGCAC-3′)
Bar-Rev (5′-TGAAGTCCAGCTGCCAGAAA-3′)
OsGolden-For (5′-AGAGAGGGCAGATGCACATT-3′)
OsGolden-Rev (5′-CTGCAGTGTCTGCTCAGCTC-3′)
MAR (5′-CAAGAGATGAAATACAACGAGGTGAAT-3′)
Annealing PCR was performed for 35 cycles with the conditions: 94°C for 30s, 53°C for 30s, and 72°C for 45s.
RESULTS AND DISCUSSION
Wind direction and speed during flowering time
The rice flowering time is from 8:30 to 15:00 each day. During 3 weeks of the flowering time (August 9–30) in 2009 and 2010, the wind direction and speeds were scored every 30 minutes from 8:00 to 15:00 by using an automatic weather scoring machine (
Fig. 2). The SE wind was most dominant with the frequency of approximately 25% in 2009 and 21.9% in 2010. In 2009, the second frequent wind direction was ESE (17.5%) followed by the NW (12%). Except for the NW wind direction, the prevailing wind usually came from SE direction. Similar pattern was observed in 2010 experiment wherein the SSE direction was secondary dominant (17.9%), followed by ESE (10.2%). In 2009, the higher maximum wind speed prevailed were 4.9 m/s (SE), and 4 m/s both in ESE and NW. This was followed by a low speed noted in SSE, E, and WNV. In 2010, the prevailing wind speed was recorded high in SE (6.2m/s), followed by SSE (6.2m/s) and ESE (5.7m/s) and the succeeding wind directions were NNW, NW and N. Interestingly, despite the highest wind speed observed in the above mentioned prevailing wind direction, each direction had similar average wind speed of about 0.8 m/s in 2009, which slightly increased in 2010 to about 1.0 m/s.
Based on 1000-grain weight, a total of 6,500 seeds were harvested at each distance on the sampling spots. At first, gene flow frequency was determined through the phenotypic observation of seed coat color after milling. The harvested seeds were divided into two groups; white-colored seed group (non-GM self-pollinated seed) and yellow-colored seed group (GM seed that cross-pollinated with Hwangkembyeo) (
Fig. 3A, B). Interestingly in 2009, the highest gene flow frequency was observed in area (NW) that was located in the opposite direction of the prevailing wind (SE). In 2009, the highest cumulative frequency rate (approximately 9%) for yellow-colored seed coat was recorded in NW area, whereas NE area obtained the lowest frequency rate of about 0.1% (
Table 1,
2). Similar trend was noted in Basta selection experiment where highest rate of survival (8.4%) was observed in NW (
Table 1,
2). Since PCR-based genotyping analysis of plants was performed using gene specific primers (OsGolden-For and OsGolden-Rev) flanking the insertion sites and MAR primer inside T-DNA region, previously determined Basta resistant plants through herbicide spray assay was confirmed to be homozygous to T-DNA insertion. If gene flow in NE area indeed occurred, all resistant plant should be heterozygous to T-DNA. Our result indicated strongly that the high frequency of Basta resistant plant in NE area was due to the contamination of GM seedling released from central Hwangkembyeo area (
Fig. 4). SE sampling area had also about 1% gene flow frequency because of the third prevailing wind direction in NW. But like NE sampling spot, SW sampling spot had very low gene frequency rate of about 0.4%.
A different dispersion result was obtained in 2010 (
Table 3,
4,
5,
6). The SE area had the highest yellow-colored seed coat rate (cumulative frequency of about 2.45%) while the N area obtained the lowest rate (0.82%). Unlike in 2009, similar gene flow rate was recorded in every wind direction in 2010. Combining the results of wind direction and gene flow event in 2010, the SE area which received the most frequent wind blows had the highest gene flow frequency whereas the area located in the opposite direction from the prevailing wind (NW) had a lower gene flow frequency. Also, W and SW areas showed 2
nd and 3
rd highest gene flow frequency, respectively. The result in red rice is relatively similar with Nakdongbyeo result although a lower gene flow frequency was observed. With second approach for the evaluation of gene flow, Basta selection was performed using the remaining 500 seeds after seed analysis (
Fig. 4C, D). As shown in seed coat analysis, Basta selection also showed similar gene flow level.
From the gene flow frequency test results, pollen can be easily dispersed to 30 cm by wind, however beyond 30 cm, pollen dispersion dramatically decreased, and it was very rare over 360 cm range. Our results showed that pollen can be dispersed to 60 cm with the sufficient wind, but it is also dramatically decreased from 90 cm and beyond. With this result, a sharp cut-off point was found at 90 cm wherein beyond this range self-pollination is strongly predominant in the field condition.
GM to non-GM gene flow event
In the field condition, rice out-crossing rate was less than 1% and the most important factor for the pollen-mediated gene flow is wind. Especially cultivated
japonica rice has a very low out-crossing rate and their pollen have a very short life span (several minutes) so most of out-crossing happen within 1 m. As shown in tables, gene flow event was very rare to find beyond 90 cm range. The distance of pollen dispersal increases with wind speed and direction but it does not mean that cross-pollination will occur against self-pollinated crops at a distance of over 1 m. Within hybrid rice production through male-sterile rice (MS), in general, maximum distance of gene flow is known to be about 40–60 m (
Jia et al. 2007;
Yuan et al. 2007). In the production of hybrid rice using MS line, more than 100 m isolation distance has been recommended in China (
Yuan and Fu 1995). But at that time, MS line cannot produce their own pollen and the only way for those plants to produce their own seeds is by receiving others’ pollen. Because of this reason every seed harvested from MS lines were out-crossed hybrid seeds that made it easier to produce hybrid rice. Except for hybrid rice production, it has been known that 10 m isolation distance is enough for preventing the cross-pollination in normal rice production field. For example, in USA, rice isolation distance is just 6 m from other field. It means that harvested seeds located 6 m distance away from other field can still be certified as a pure seed.
In the present study, gene flow from cultivated rice to cultivated rice would not pose a very serious problem because just 10 m long distance can prevent the cross-pollination between rice (
Messequer et al. 2001;
Messequer et al. 2004). However, there are many wild rice and weedy rice that can be crossed with cultivated rice (
Oryza sativa L.) around the rice growing field. Although GM field can be isolated from other non-GM rice fields, wild rice and weedy rice cannot be removed completely by chemical or physical methods from GM field. In addition, wild rice has higher out-crossing rate than cultivated rice. This trait must have an effect on the ecosystem near rice field. The crossing rate between cultivated rice and wild rice was estimated to be about 0.04% ~ 2% in experimental conditions (
Chen et al. 2004;
Messeguer et al. 2004). In cultivated field condition, the population of wild rice and weedy is very low, so gene flow event frequency must be extremely lower than experimental condition. Many of previous gene flow studies reported that natural out-crossing frequency between different rice lines was around 0.5%. But with this extremely low frequency, nature always accumulate the gene, moreover, T-DNA from GM rice will give more superior trait to wild or weedy rice and finally it may dominantly grow around rice field as a superior weed or so-called super weed. To prevent this phenomenon the study of out-crossing frequency between wild or weedy rice and cultivated rice have to be carried out and findings of this study will provide good documentation on the escape of transgenes into wild and weedy rice.
ACKNOWLEDGEMENTS
This work was supported by a grant from the Next-Generation BioGreen21 Program (The National Center for GM Crops, Grand No. PJ009528), Rural Development Administration, Republic of Korea.
Fig. 1Experimental field design in 2009 (A) and 2010 (B). Six lines of Hwangkembyeo (pollen donor) were planted on the center of the experimental plot and 3 kinds of pollen recipients namely Nakdongbyeo (green), IR36 (blue) and red rice (red) were planted around (2009) and both sides (2010) of the pollen donor. In 2010, four experimental fields were designed to facilitate sampling from 8 directions. The sampling plots were designated by the yellow marked lines.
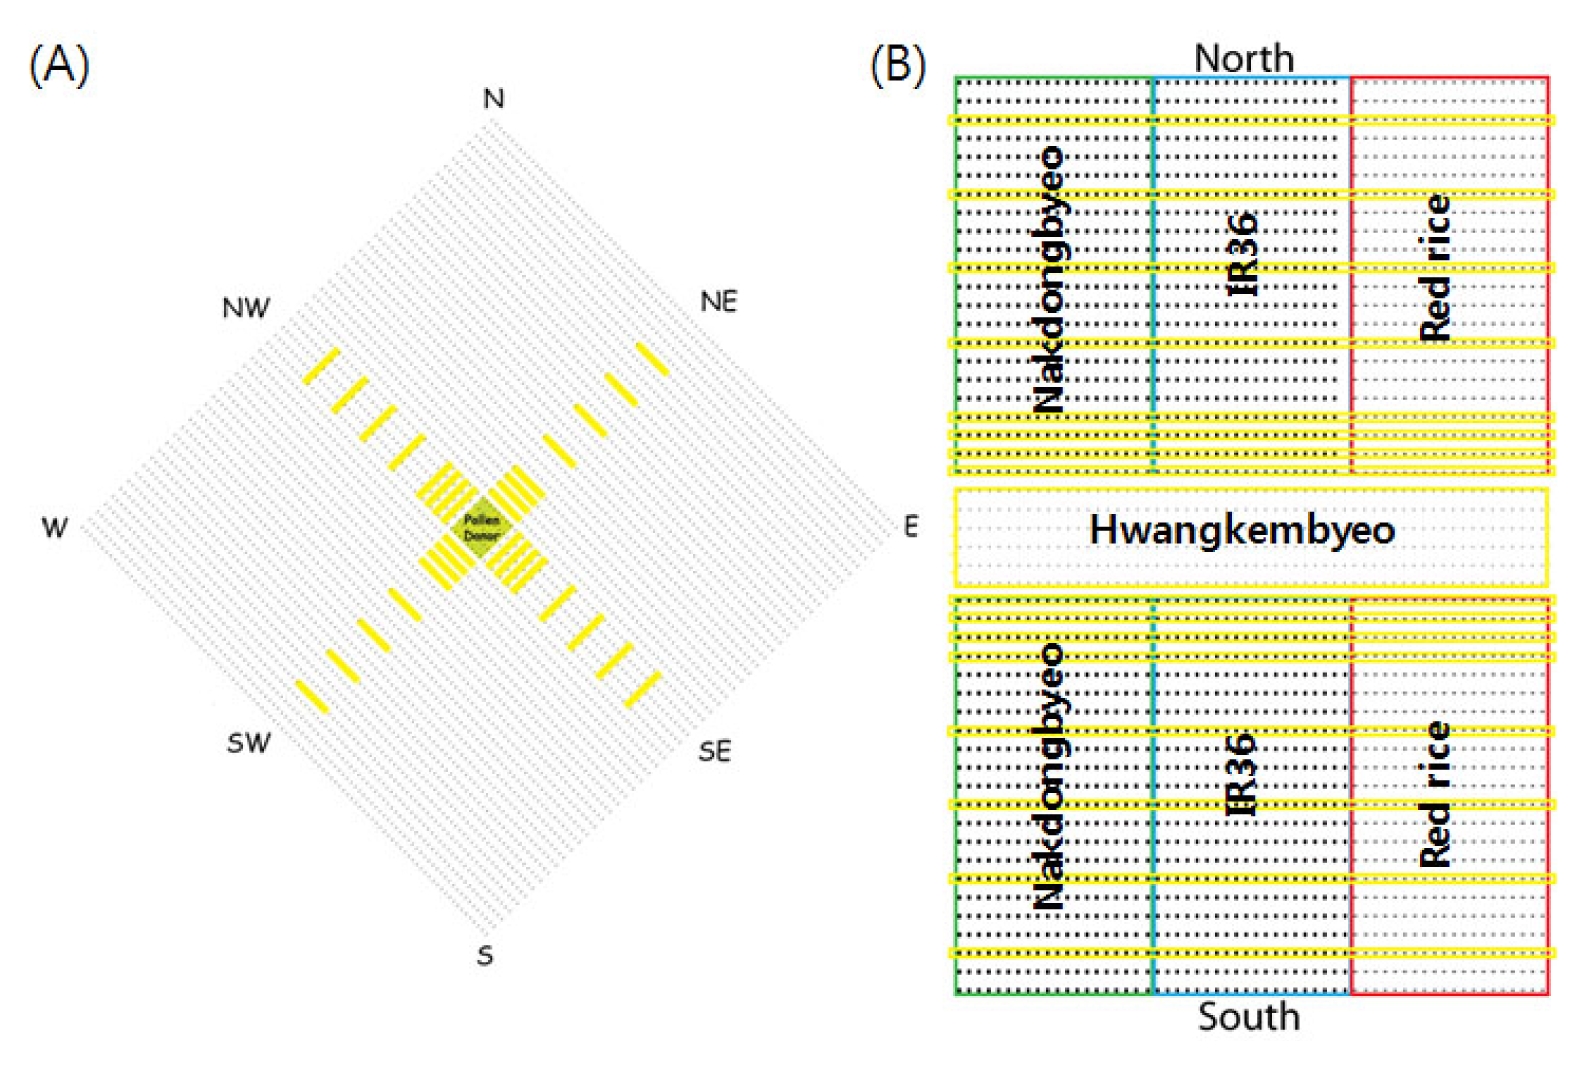
Fig. 2Wind directions in 2009 (A) and 2010 (B). The block indicates the prevailing wind direction frequency towards the southeast direction while the arrow indicates the wind direction.
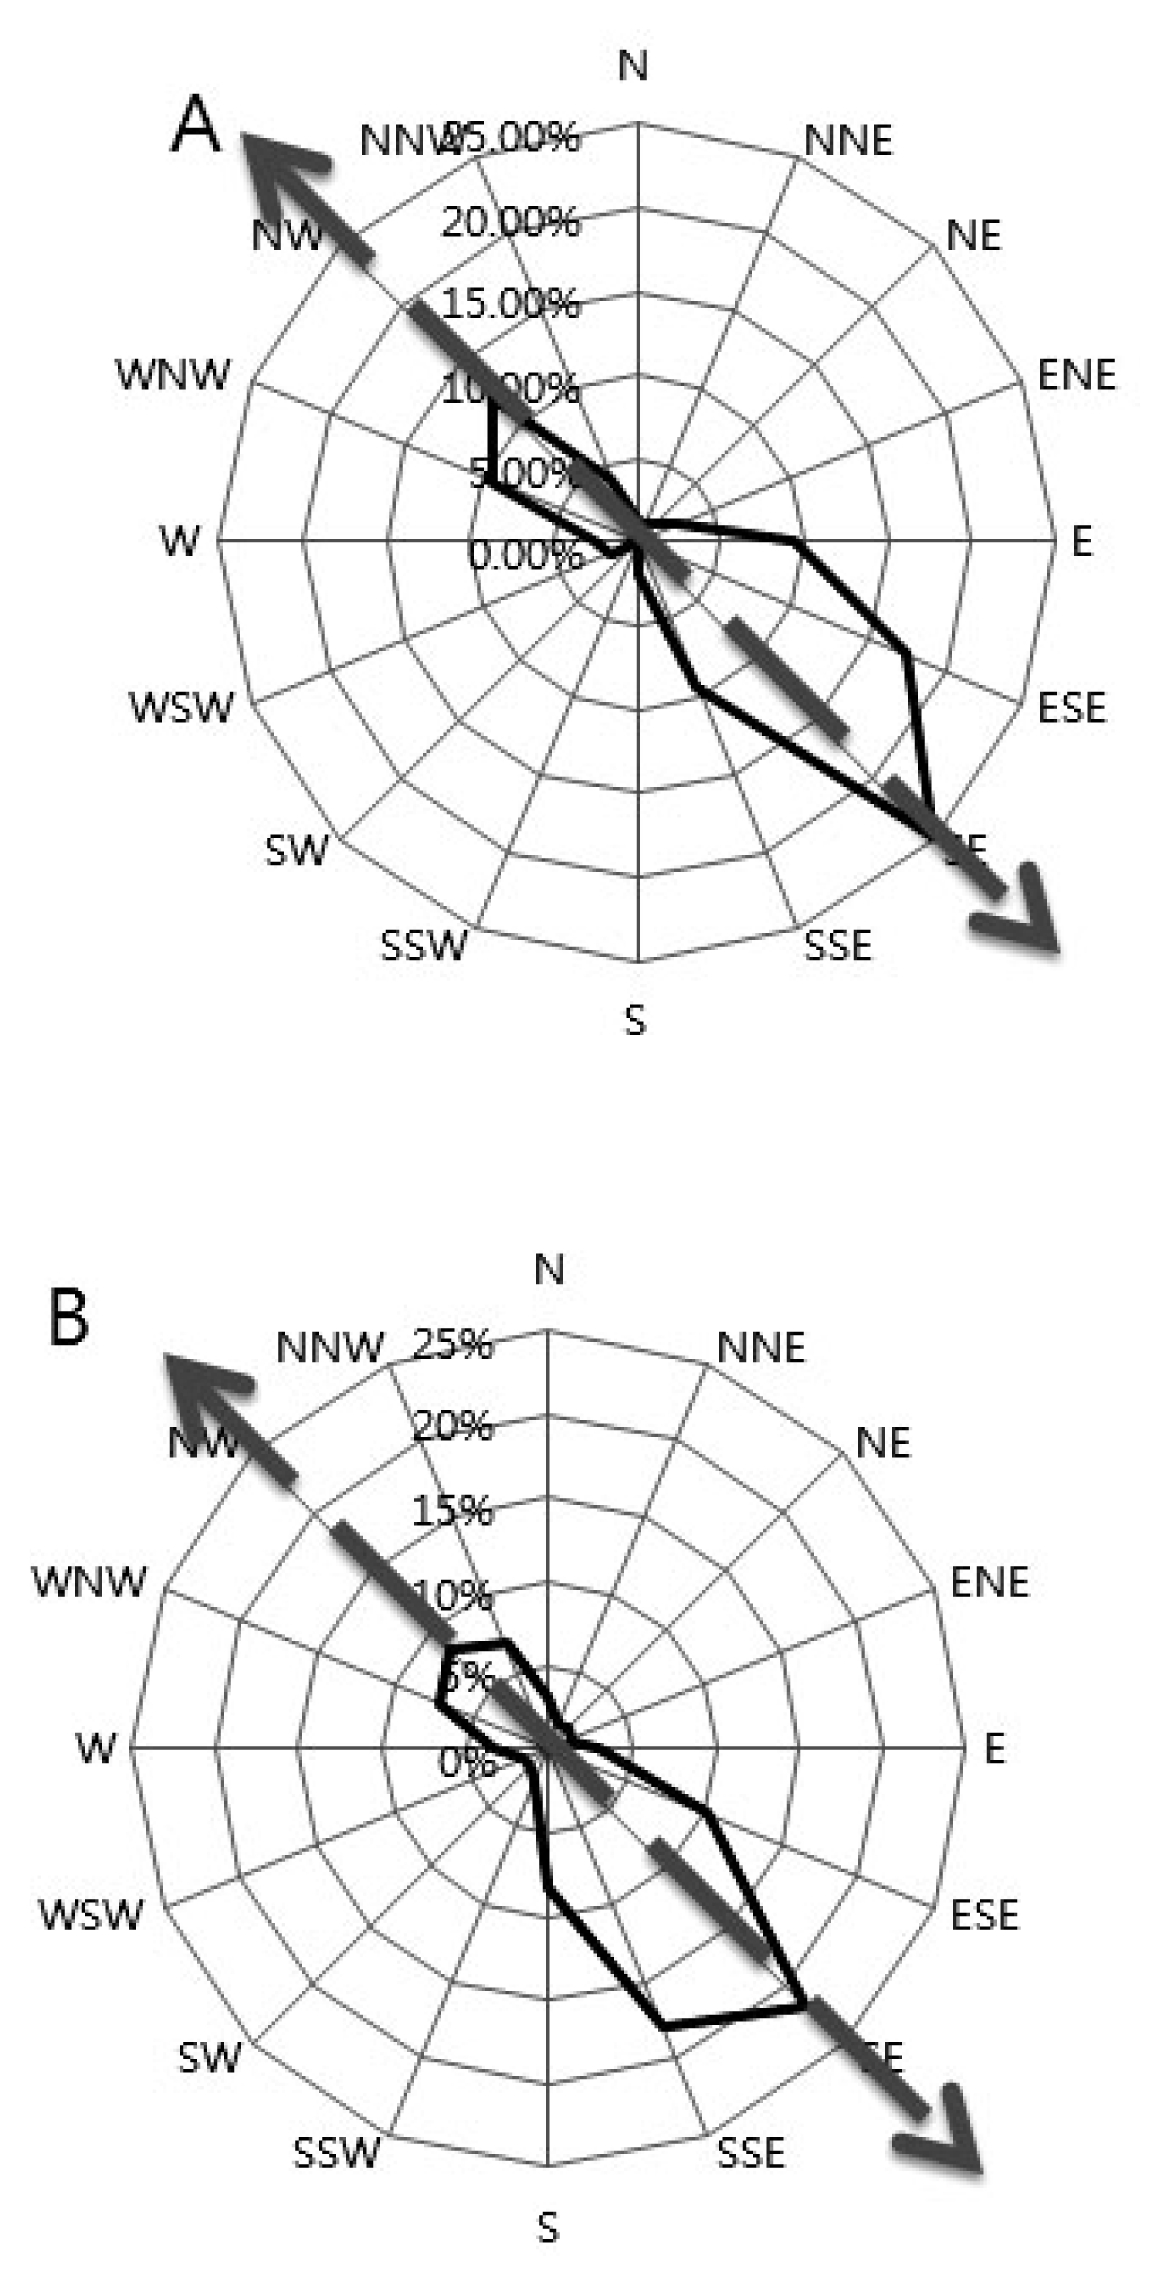
Fig. 3Phenotypic analysis of gene flow event. (A) Yellow-colored seeds of Hwangkembyeo due to the presence of beta-carotene gene. (B) Seeds of Nakdongbyeo showing the yellow-colored seeds that indicate the out-crossed seeds from Hwangkembyeo. Four-week-old plants of Hwangkembyeo (C) and Nakdongbyeo (D) showing resistance to Basta selection from the sampling plot.
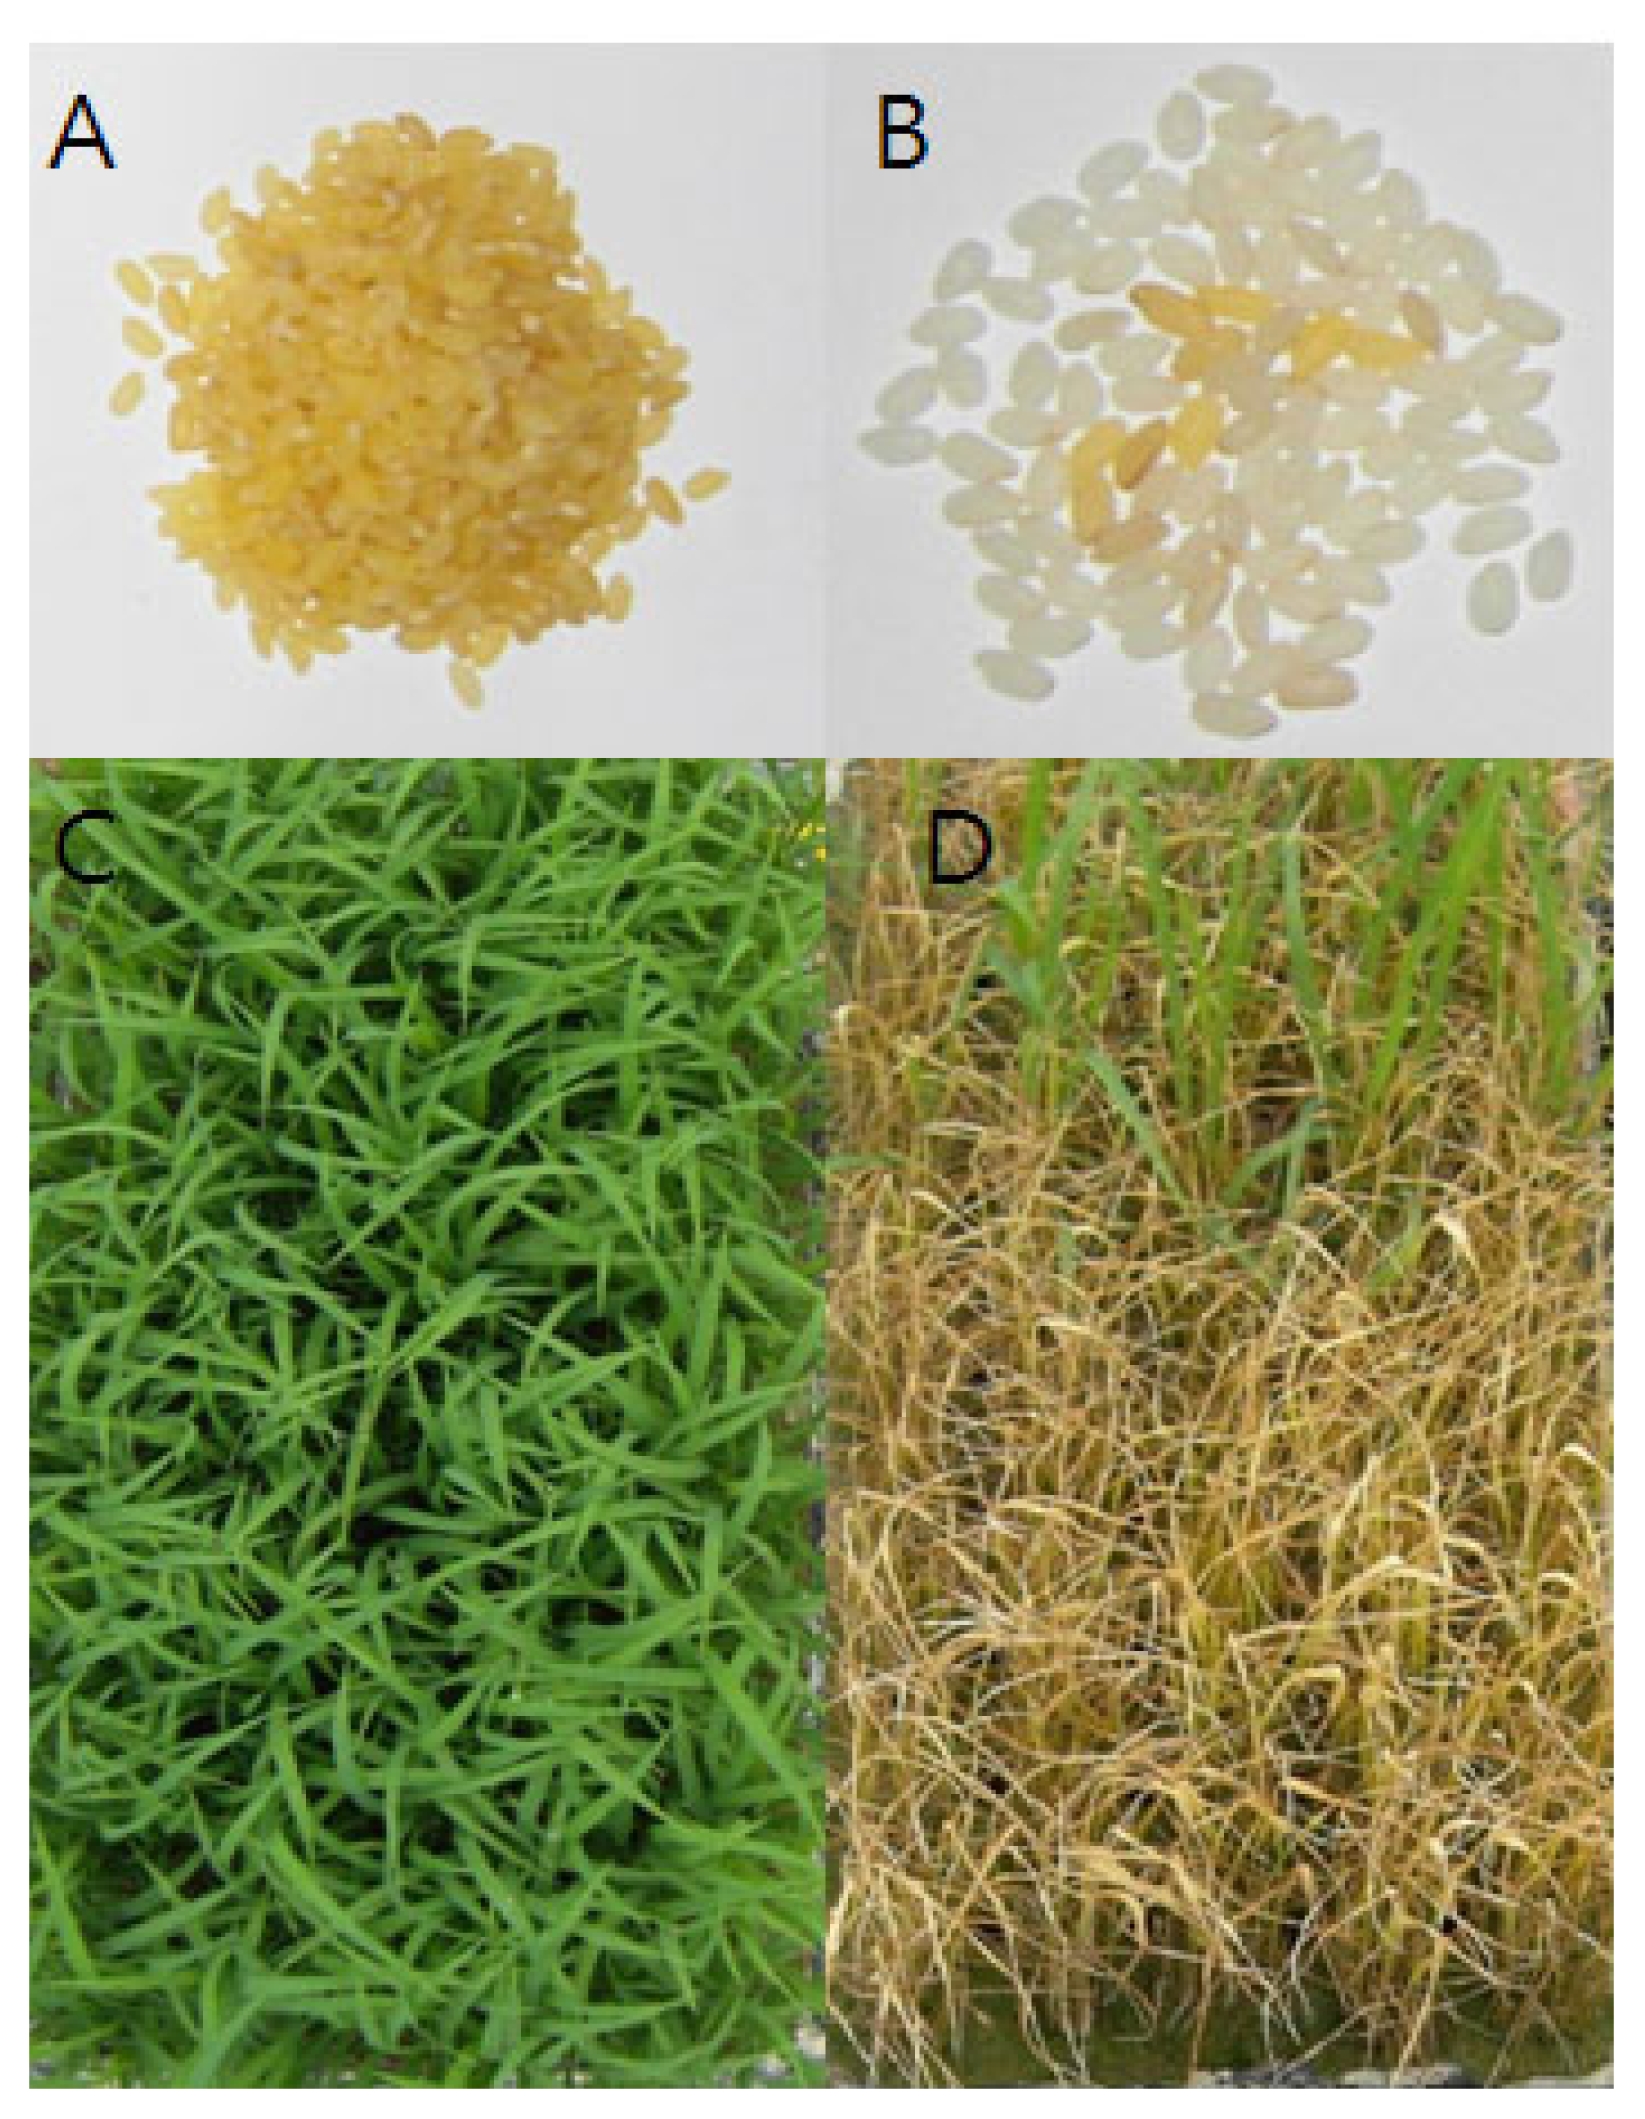
Fig. 4PCR analysis for the genotyping of Basta resistant plants from NW, 30 cm area in 2009 (
Table 1). Primer locations were marked with arrows. T-DNA design (A) PCR products of using Bar gene primers. (B) PCR products using OsGolden primer and MAR primer. (C) No PCR amplification product using OsGolden-For and Rev primers.

Table 1Frequency of gene flow from the designated sampling plots and direction based on seed color (2009).
Table 1
|
Distance (cm) |
North-East |
South-West |
South-East |
North-West |
|
|
No. |
% |
No. |
% |
No. |
% |
No. |
% |
|
30 |
3 |
0.05 |
19 |
0.32 |
59 |
0.98 |
547 |
9.12 |
|
60 |
2 |
0.03 |
3 |
0.05 |
0 |
- |
0 |
- |
|
90 |
0 |
- |
2 |
0.03 |
0 |
- |
0 |
- |
|
120 |
2 |
0.03 |
0 |
- |
0 |
- |
0 |
- |
|
240 |
0 |
- |
0 |
- |
0 |
- |
1 |
0.02 |
|
360 |
1 |
0.02 |
0 |
- |
1 |
0.02 |
1 |
0.02 |
|
480 |
0 |
- |
0 |
- |
0 |
- |
0 |
- |
|
600 |
0 |
- |
0 |
- |
0 |
- |
0 |
- |
|
|
8 |
|
24 |
|
60 |
|
548 |
|
Table 2Frequency of gene flow from the designated sampling plots and direction based on Basta selection (2009).
Table 2
|
Distance (cm) |
North-East |
South-West |
South-East |
North-West |
|
|
No. |
% |
No. |
% |
No. |
% |
No. |
% |
|
30 |
1 |
0.20 |
0 |
- |
1 |
0.20 |
42 |
8.40 |
|
60 |
0 |
- |
0 |
- |
1 |
0.20 |
0 |
- |
|
90 |
0 |
- |
0 |
- |
0 |
- |
0 |
- |
|
120 |
0 |
- |
0 |
- |
0 |
- |
0 |
- |
|
240 |
0 |
- |
0 |
- |
0 |
- |
0 |
- |
|
360 |
0 |
- |
0 |
- |
0 |
- |
0 |
- |
|
480 |
0 |
- |
0 |
- |
0 |
- |
0 |
- |
|
600 |
1 |
0.20 |
0 |
- |
1 |
0.20 |
0 |
- |
|
|
2 |
|
0 |
|
3 |
|
42 |
|
Table 3Frequency of gene flow from the designated sampling plots and direction based on seed color in Nakdongbyeo (2010).
Table 3
|
Distance (cm) |
North |
South |
East |
West |
North-West |
North-East |
South-West |
South-East |
|
|
No. |
% |
No. |
% |
No. |
% |
No. |
% |
No. |
% |
No. |
% |
No. |
% |
No. |
% |
|
30 |
25 |
0.42 |
22 |
0.37 |
25 |
0.42 |
35 |
0.58 |
18 |
0.30 |
18 |
0.30 |
43 |
0.72 |
58 |
0.97 |
|
60 |
12 |
0.20 |
11 |
0.18 |
18 |
0.30 |
44 |
0.73 |
17 |
0.28 |
21 |
0.35 |
25 |
0.42 |
25 |
0.42 |
|
90 |
5 |
0.08 |
7 |
0.12 |
10 |
0.17 |
17 |
0.28 |
12 |
0.20 |
4 |
0.07 |
20 |
0.33 |
17 |
0.28 |
|
120 |
4 |
0.07 |
5 |
0.08 |
5 |
0.08 |
15 |
0.25 |
15 |
0.25 |
4 |
0.07 |
3 |
0.05 |
20 |
0.33 |
|
240 |
1 |
0.02 |
4 |
0.07 |
0 |
- |
1 |
0.02 |
6 |
0.10 |
1 |
0.02 |
4 |
0.07 |
13 |
0.22 |
|
360 |
1 |
0.02 |
3 |
0.05 |
0 |
- |
5 |
0.08 |
5 |
0.08 |
1 |
0.02 |
1 |
0.02 |
4 |
0.07 |
|
480 |
1 |
0.02 |
3 |
0.05 |
1 |
0.02 |
1 |
0.02 |
0 |
- |
4 |
0.07 |
1 |
0.02 |
6 |
0.10 |
|
600 |
0 |
- |
2 |
0.03 |
1 |
0.02 |
2 |
0.03 |
0 |
- |
2 |
0.03 |
2 |
0.03 |
4 |
0.07 |
|
|
49 |
|
57 |
|
60 |
|
120 |
|
73 |
|
55 |
|
99 |
|
147 |
|
Table 4Frequency of gene flow from the designated sampling plots and direction based on seed color in red rice (2010).
Table 4
|
Distance (cm) |
North |
South |
East |
West |
North-West |
North-East |
South-West |
South-East |
|
|
No. |
% |
No. |
% |
No. |
% |
No. |
% |
No. |
% |
No. |
% |
No. |
% |
No. |
% |
|
30 |
12 |
0.20 |
5 |
0.08 |
9 |
0.15 |
1 |
0.02 |
2 |
0.03 |
8 |
0.13 |
6 |
0.10 |
10 |
0.17 |
|
60 |
3 |
0.05 |
4 |
0.07 |
3 |
0.05 |
2 |
0.03 |
2 |
0.03 |
4 |
0.07 |
5 |
0.08 |
16 |
0.27 |
|
90 |
3 |
0.05 |
4 |
0.07 |
3 |
0.05 |
0 |
- |
1 |
0.02 |
1 |
0.02 |
3 |
0.05 |
5 |
0.08 |
|
120 |
2 |
0.03 |
1 |
0.02 |
3 |
0.05 |
1 |
0.02 |
0 |
- |
0 |
- |
0 |
- |
2 |
0.03 |
|
240 |
1 |
0.02 |
1 |
0.02 |
0 |
- |
0 |
- |
0 |
- |
2 |
0.03 |
1 |
0.02 |
3 |
0.05 |
|
|
21 |
|
15 |
|
18 |
|
4 |
|
5 |
|
15 |
|
15 |
|
36 |
|
Table 5Frequency of gene flow from the designated sampling plots and direction based on Basta selection in Nakdongbyeo (2010).
Table 5
|
North |
South |
East |
West |
North-West |
North-East |
South-West |
South-East |
|
|
Distance (cm) |
No. |
% |
No. |
% |
No. |
% |
No. |
% |
No. |
% |
No. |
% |
No. |
% |
No. |
% |
|
30 |
1 |
0.20 |
4 |
0.80 |
3 |
0.60 |
1 |
0.20 |
0 |
- |
1 |
0.20 |
3 |
0.60 |
11 |
2.20 |
|
60 |
0 |
- |
3 |
0.60 |
0 |
- |
2 |
0.40 |
2 |
0.40 |
0 |
- |
1 |
0.20 |
2 |
0.40 |
|
90 |
0 |
- |
2 |
0.40 |
0 |
- |
3 |
0.60 |
2 |
0.40 |
0 |
- |
1 |
0.20 |
2 |
0.40 |
|
120 |
2 |
0.40 |
1 |
0.20 |
0 |
- |
0 |
- |
0 |
- |
0 |
- |
1 |
0.20 |
1 |
0.20 |
|
240 |
0 |
- |
0 |
- |
0 |
- |
2 |
0.40 |
0 |
- |
0 |
- |
0 |
- |
1 |
0.20 |
|
360 |
0 |
- |
0 |
- |
0 |
- |
0 |
- |
0 |
- |
0 |
- |
0 |
- |
0 |
- |
|
480 |
0 |
- |
0 |
- |
0 |
- |
0 |
- |
0 |
- |
0 |
- |
0 |
- |
0 |
- |
|
600 |
0 |
- |
0 |
- |
0 |
- |
0 |
- |
0 |
- |
0 |
- |
0 |
- |
0 |
- |
|
|
3 |
|
10 |
|
3 |
|
8 |
|
4 |
|
1 |
|
6 |
|
17 |
|
Table 6Frequency of gene flow from the designated sampling plots and direction based on seed color in red rice (2010).
Table 6
|
Distance (cm) |
North |
South |
East |
West |
North-West |
North-East |
South-West |
South-East |
|
|
No. |
% |
No. |
% |
No. |
% |
No. |
% |
No. |
% |
No. |
% |
No. |
% |
No. |
% |
|
30 |
2 |
0.40 |
0 |
- |
1 |
0.20 |
2 |
0.40 |
0 |
- |
0 |
- |
6 |
1.20 |
1 |
0.20 |
|
60 |
0 |
- |
0 |
- |
0 |
- |
0 |
- |
0 |
- |
0 |
- |
1 |
0.20 |
0 |
- |
|
90 |
0 |
- |
0 |
- |
0 |
- |
0 |
- |
0 |
- |
21 |
4.20 |
0 |
- |
0 |
- |
|
120 |
0 |
- |
0 |
- |
0 |
- |
1 |
0.20 |
0 |
- |
0 |
- |
0 |
- |
3 |
0.60 |
|
240 |
0 |
- |
0 |
- |
0 |
- |
0 |
- |
0 |
- |
2 |
0.40 |
0 |
- |
2 |
0.40 |
|
|
2 |
|
0 |
|
1 |
|
3 |
|
1 |
|
23 |
|
7 |
|
6 |
|
References
- Chen LJ, Lee DS, Song ZP, Suh HS, Lu BR. 2004. Gene Flow from cultivated rice (Oryza sativa) to its weedy and wild relatives. Annals of Botany. 93: 67-73.
- Jeong EG, Yi GH, Won YJ, Park HM, Cheon NS, Choi JH, Ku YC, Han CD, Eun MY, Kim TS, Nam MH. 2006. Agronomic characteristics of transgenic Japonica rice “Milyang 204” with herbicide resistance gene (bar). Korean J Plant Biothechnol. 34: 85-90.
- Jia S, Wang F, Shi L, Yuan Q, Liu W, Liao Y, Li S, Jin W, Peng H. 2007. Transgene flow to hybrid rice and its male-sterile lines. Transgenic Res. 16: 491-501.
- IRGSP International Rice Genome Sequencing Project. 2005. IRGSP releases the assembled rice genome sequences. 31 Aug. 2005. http://rgp.dna.affrc.go.jp/IRGSP/Build3/build3.html
- Lee K-R, Shin KS, Suh SC, Kim KY, Jeon YH, Park BS, Kim J-K, Kweon S-J, Lee YH. 2009. Molecular characterization of lepidopteran pset-resistant transgenic rice events expressing synthetic Cry1Ac. Plant Biotechnol Rep. 3: 317-324.
- Lee SW. 2010. Current status on the development and commercialization of GM plants. J Plant Biotechnol. 37: 305-312.
- Lu BR, Snow AA. 2005. Gene flow from genetically modified rice and its environmental consequences. Bio-science. 55: 669-678.
- Lu BR, Yang C. 2009. Gene flow from genetically modified rice to its wild relatives: Assessing potential ecological consequences. Biotechnology Advances. 27: 1083-1091.
- Messeguer J, Fogher C, Guiderdoni E, Marfa V, Catala MM, Baldi G, Mele E. 2001. Field assessments of gene flow from transgenic to cultivated rice (Oryza sativa L.) using a herbicide resistance gene as tracer marker. Theor Appl Genet. 103: 1151-1159.
- Messeguer J, Marfa V, Catala MM, Guiderdoni E, Mele E. 2004. A field study of pollen-mediated gene flow from Mediterranean GM rice to conventional rice and the red rice weed. Molecular Breeding. 13: 103-112.
- Paine JA, Shipton CA, Chaggar S, Mowells RM, Kennedy MJ, Vernon G, Wright SY, Hinchliffe E, Adams JL, Silverstone AL, Drake R. 2005. Improving the nutritional value of golden rice through increased pro-vitamin A content. Nature Biotechnology. 23: 482-487.
- Song ZP, Lu BR, Zhu YG, Chen JK. 2002. Pollen competition between cultivated and wild rice species (Oryza sativa and O. rufipogon). New Phytologist. 153: 289-296.
- Song ZP, Lu BR, Zhu YG, Chen JK. 2003. Gene flow from cultivated rice to the wild species Oryza rufipogon under experimental field conditions. New Phytologist. 157: 657-665.
- Song ZP, Lu BR, Chen JK. 2004. Pollen flow of cultivated rice measured under experimental conditions. Biodiver Conserv. 13: 579-590.
- Yuan LP, Fu XQ. 1995. Technology of hybrid rice production food and agriculture organization of the United nations, Rome.
- Yuan QH, Shi L, Wang F, Cao B, Qian Q, Lei XM, Liao YL, Liu WG, Cheng L, Jia SR. 2007. Investigation of rice transgene flow in compass sectors by using male sterile line as a pollen detector. Theor Appl Genet. 115: 549-560.