Abstract
Ionizing radiation (IR) is regarded as an abiotic stressor for plants because it causes oxidative stress and changes the expression of genes. We investigated RNA sequencing-based global transcriptome changes induced by three different types of IR (gamma rays (GR), ion beams (IB), and proton beams (PB)) at different doses in rice. On average, 489 upregulated and 234 downregulated differentially expressed genes (DEGs) were found per sample. The union of the DEGs for each IR type was collected to simplify the comparison of effects among the different IR treatments. This resulted to a total of 1,558 DEGs after GR irradiation, 1,865 DEGs after IB irradiation, and 1,347 DEGs after PB irradiation. The gene ontology (GO) enrichment analysis of the union DEG sets revealed 69 and 12 commonly enriched GO terms for up- and downregulated DEGs, respectively, many of which were closely related to oxidative stress responses. The Kyoto Encyclopedia of Genes and Genomes (KEGG) pathway mapping and enrichment analysis of the union DEG sets also showed that most of the DEGs fell into common pathways related to oxidative stress, stress signaling, and redox reactions. A total of 137 transcription factor (TF) genes were differentially expressed, and many belong to families associated with stress responses. Our results suggest that different types and doses of IR can induce universal gene expression changes in response to oxidative stress. This study contributes to our understanding of the molecular response mechanisms to IR in plants.
-
Key words: Ionizing radiation, Abiotic stress, Transcriptome, Rice
INTRODUCTION
Adapting to biotic and abiotic stresses in different environments is one of the main factors associated with survival in plants (
Suzuki et al. 2014). Drought or excessive rain, cold, heat, and soil salinity, which are all involved in recent climate change, are representative types of abiotic stress, and ionizing radiation (IR) is another type. Understanding the response of plants to abiotic stress is important because it typically has negative effects on crop growth, consequently reducing crop yield (
Dolferus et al. 2011;
Zhang et al. 2018). Although some responses may be specific to different types of stress, it is generally accepted that many responses are common to multiple stress types (
Chinnusamy et al. 2004;
Swindell 2006). A previous study reported 67 genes commonly regulated under nine different abiotic stresses in
Arabidopsis, which fall into functional classes, including cell rescue, defense, and virulence, as well as energy use and metabolism (
Swindell 2006).
Because of their sessile nature, plants have evolved complex protection mechanisms to tolerate stress (
Sewelam et al. 2016;
Verma et al. 2016). The sensing of stress initiates signal transduction pathways induced by signaling molecules such as phytohormones and reactive oxygen species (ROS) (
Devireddy et al. 2021). ROS such as singlet oxygen (
1O
2), hydrogen peroxide (H
2O
2), superoxide radical (O
2−), and hydroxyl radical (OH), continuously produced by various enzymes, accumulate under abiotic stress conditions (
Mittler et al. 2004;
You and Chan 2015). In addition, exposure to IR causes direct generation of ROS by water radiolysis, leading to oxidative stress (
Esnault et al. 2010;
Choi et al. 2021). To eliminate excessive levels of ROS, plants have efficient nonenzy-matic and enzymatic antioxidative mechanisms (
You and Chan 2015).
IR is energy flow consisting of electromagnetic waves or particles released from natural or artificial sources. Linear energy transfer (LET), indicating the average amount of energy transferred per unit length, is a physical property that depends on radiation type (
Hwang et al. 2014;
Jo and Kim 2019). Gamma rays (GR), X-rays, and proton beams (PB) are representative low-LET IR, while ion beams (IB) and neutron beams are classified as high-LET IR (
Huefner et al. 2014;
Hwang et al. 2014). The LET of different IR types has a relationship with relative biological effectiveness, defined as the dose ratio between two IR types to give the same biological effect, which takes the form of a humped curve (
Takatsuji et al. 1999).
Rice is a major staple food crop worldwide, and many transcriptomic studies have been conducted to investigate yield loss caused by abiotic stressors including drought, temperature, and salt (
Lv et al. 2010;
Moumeni et al. 2011;
Mangrauthia et al. 2016;
Shankar et al. 2016). For IR, microarray-based transcriptome studies have reported gene expression changes related to sucrose-starch metabolism, ROS scavenging, and signaling pathways (
Kim et al. 2012;
Hwang et al. 2014). However, there have been no reports on RNA sequencing-based transcriptome analysis for different types of IR. In this study, we irradiated rice seeds with GR, IB, and PB and generated RNA sequencing data from seedlings to identify global transcriptomic changes induced by IR.
MATERIALS AND METHODS
Plants and irradiation conditions
Rice (Oryza sativa L. ssp. japonica cv. Ilpum) seeds were subjected to ionizing irradiation with GR, IB, and PB. GR irradiation was conducted using a 60Co gamma irradiator (150 TBq; Nordion, ON, Canada) at the Korea Atomic Energy Research Institute (Jeongeup, Korea) with irradiation doses of 100, 200, and 400 Gy. Carbon IB irradiation (220 MeV) was conducted using an AVF cyclotron at the Japan Atomic Energy Agency (Takasaki, Japan) with doses of 20, 50, and 80 Gy. 45 MeV of PB irradiation was conducted using a MC-50 cyclotron at the Korea Institute of Radiological and Medical Sciences (Seoul, Korea) with doses of 100, 200, and 400 Gy. The irradiation doses of GR, IB, and PB were determined based on seedling growth test (data not shown). Irradiated and nonirradiated control seeds were sterilized and sown in a half-strength MS medium (Duchefa, Haarlem, Netherlands) under a 16 hours light and 8 hours dark cycle at 24℃. Total RNA was extracted from three-week-old whole seedlings using TRIzol reagent (Invitrogen, Carlsbad, CA, USA) according to the manufacturer’s protocol.
RNA sequencing and identification of differentially expressed genes (DEGs)
Sequencing libraries were prepared using the TruSeq RNA Library Prep Kit (Illumina, San Diego, CA, USA) and 100-bp paired-end sequenced on the HiSeq 2500 platform (Illumina, San Diego, CA, USA). Raw sequencing data were filtered using NGS QC ToolKit v2.3.3 to remove adapters and low-quality reads with a quality score below Q20 (
Patel and Jain 2012). High-quality reads were mapped to the rice reference genome (MSU RGAP 7.0) using the Burrows-Wheeler Aligner v0.7.9 (
Li and Durbin 2009). The read counts for each gene were calculated using HTSeq v0.6.0 (
Anders et al. 2015). Data normalization and DEG calculation were performed using DESeq2 v.1.18.1 (
Love et al. 2014). DEGs were defined as genes with |log
2 fold change (FC)| ≥ 1 and
P ≤ 0.01. The R package gplots was used for the construction of hierarchical clusters and a heatmap of the total DEGs.
RESULTS
DEGs induced by different types of IR
A total of 46.1 Gb of raw RNA sequencing reads were generated from ten samples, made up of one nonirradiated control seedling and nine seedlings from seeds exposed to IR; the irradiation doses were as follows: 100, 200, and 400 Gy for GR; 20, 50, and 80 Gy for IB; and 100, 200, and 400 Gy for PB. On average, 4.30 Gb of high-quality reads were mapped to the rice reference genome, and 28,964 genes were expressed for each sample. The identification of DEGs based on the cutoff criteria |Log2FC| ≥ 1 and P ≤ 0.01 revealed an average of 489 upregulated and 234 downregulated DEGs per sample.
The union sets of DEGs for each IR type were compared among the different IR types (
Fig. 1). A total of 1,558 genes were differentially expressed after GR irradiation (1,187 upregulated and 371 downregulated); 1,865 genes were differentially expressed after IB irradiation (1,244 upregulated and 621 downregulated); and 1,347 genes were differentially expressed after PB irradiation (769 upregulated and 578 downregulated) (
Fig. 1a). Venn diagrams with a total of 1,664 upregulated and 998 downregulated DEG union sets showed 554 and 181 commonly up- and downregulated DEGs, respectively, across the three types of IR; 428 and 216 DEGs were commonly regulated by two out of the three IR types (
Fig. 1b). Common regulation was more evident in the heatmap based on Log
2FC; DEGs were largely divided into two expression patterns, which were generally up- or down-regulated by different IR types and doses (
Fig. 1c).
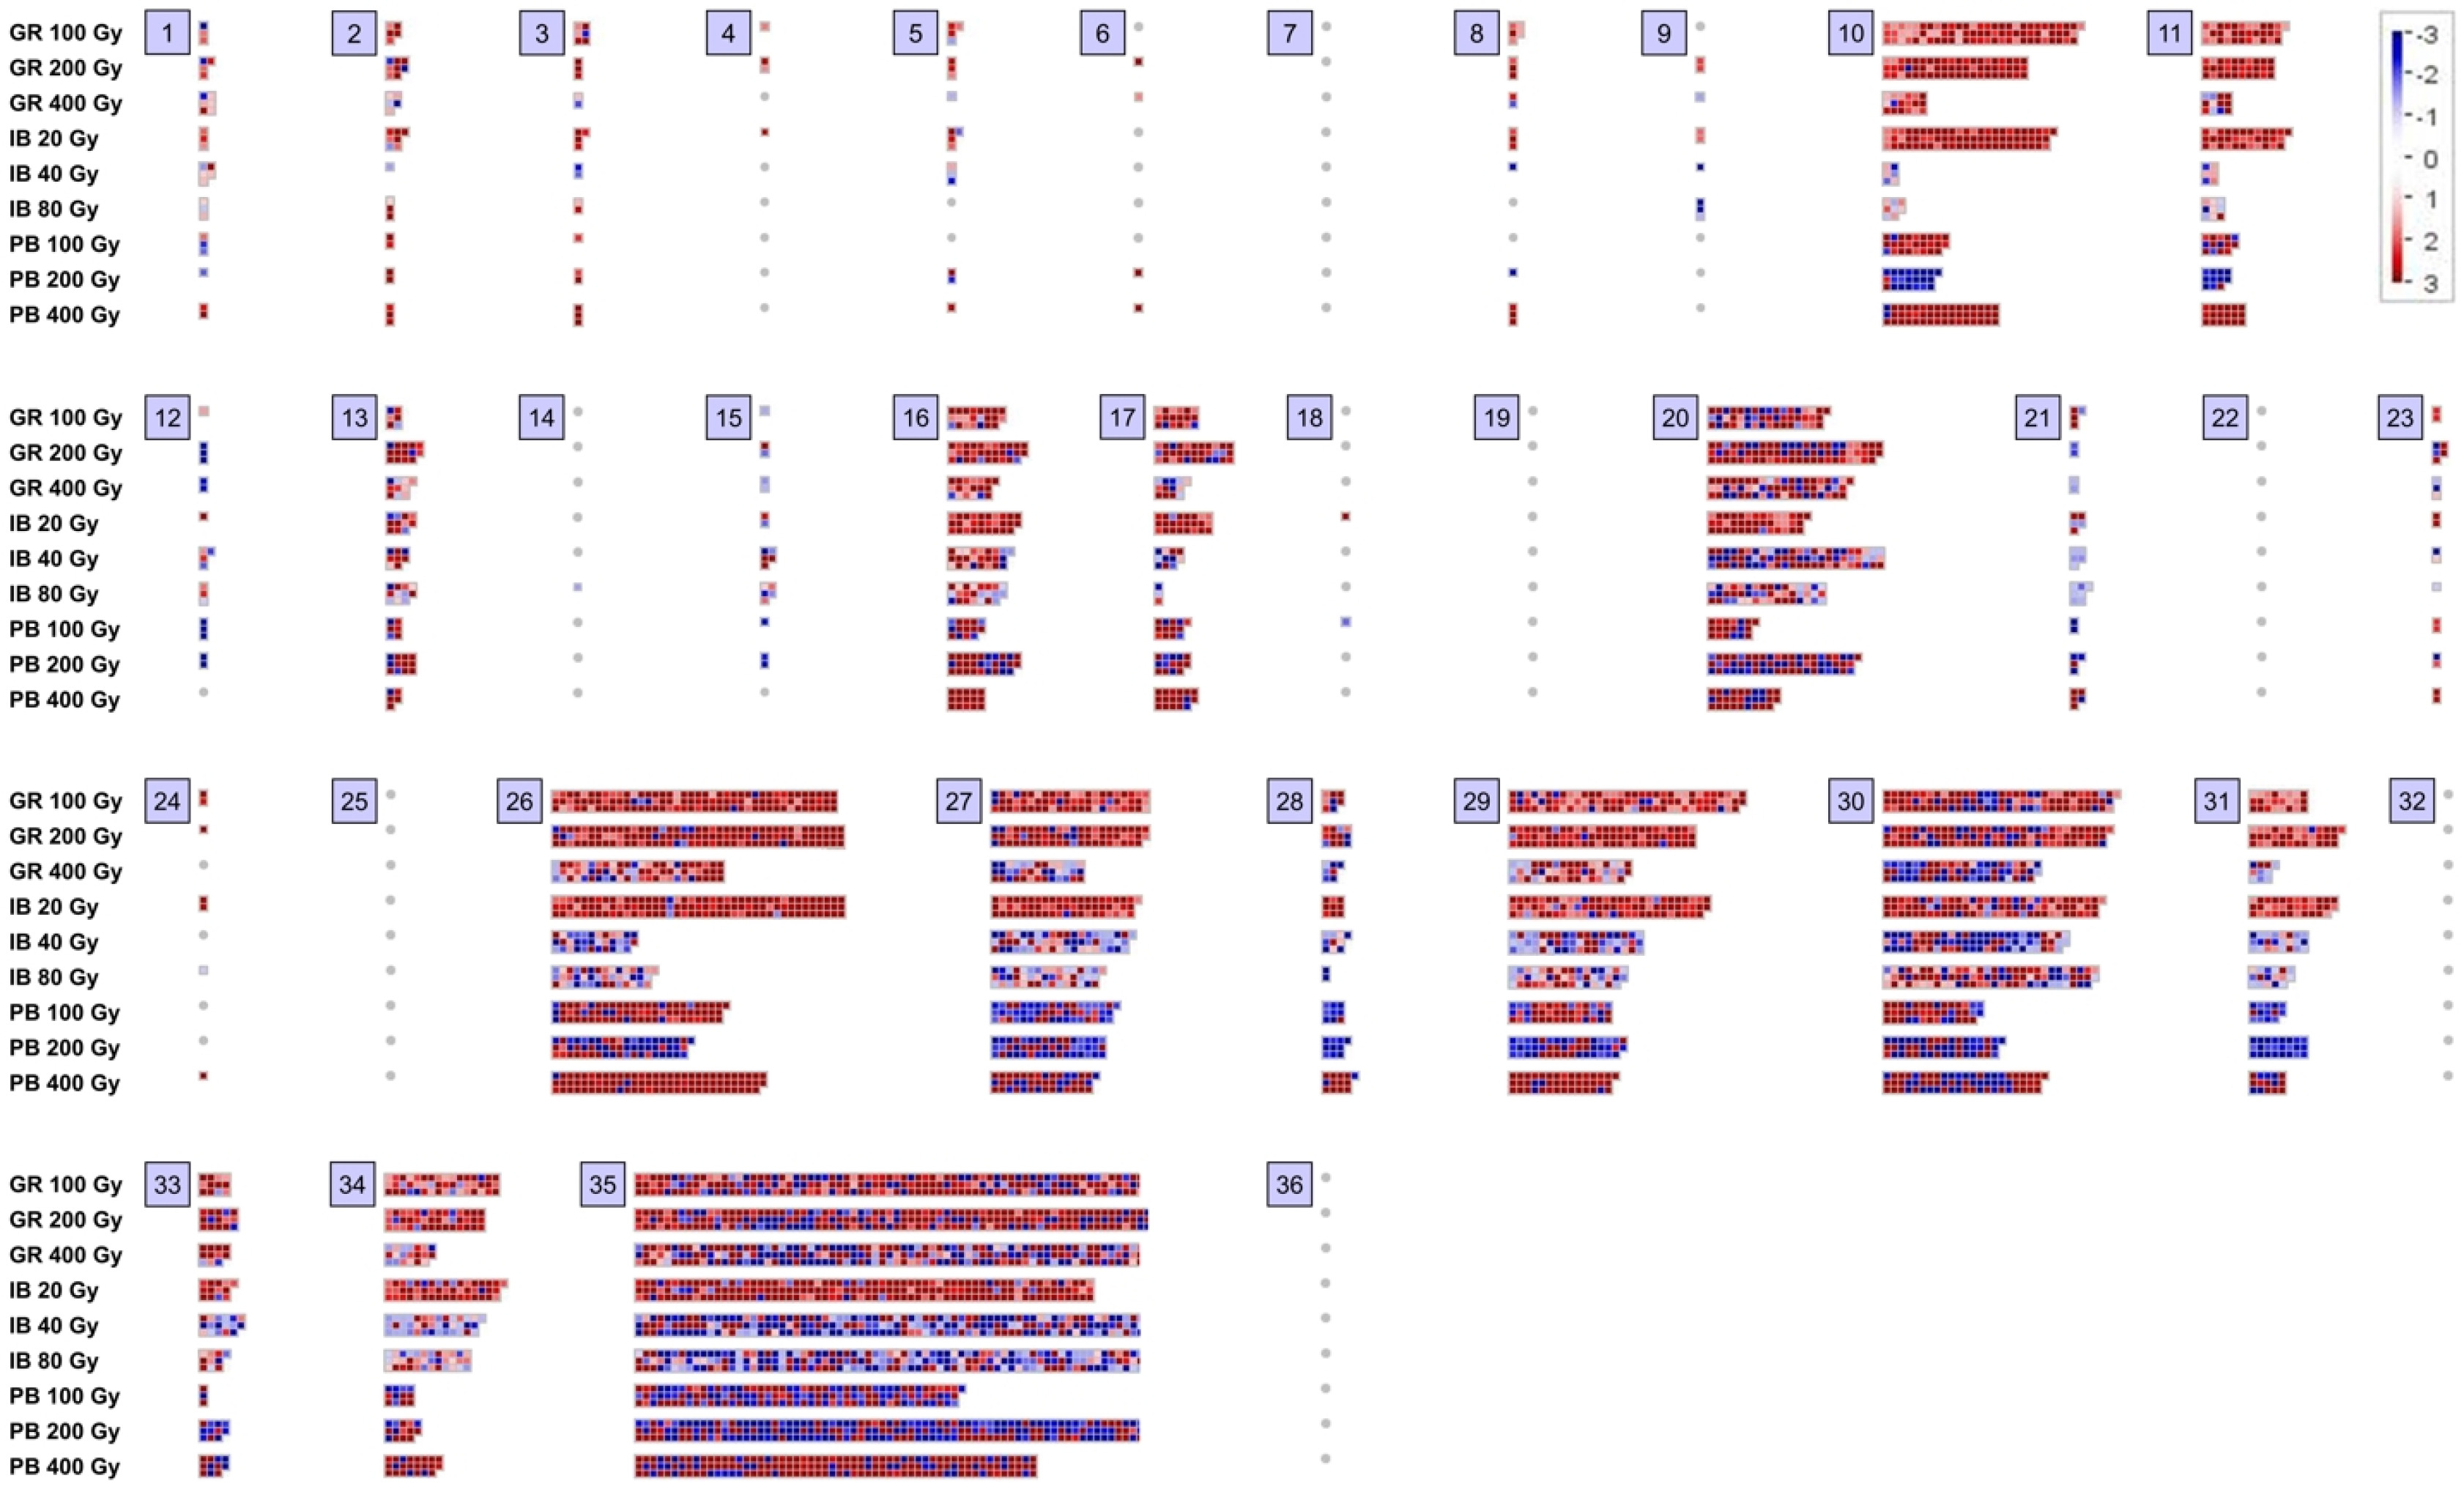
We performed MapMan analysis to obtain a glimpse of the functional categories of the DEGs (
Fig. 2). The DEGs were assigned to 30 of the 36 MapMan bins, and the number of assigned DEGs for each treatment was 732 on average (
Supplementary Table S1). Excluding bin 35, which had the largest number of DEGs, but no functional category, the top 5 bins with abundant DEGs were miscellaneous (bin 26; 82 DEGs on average), signaling (bin 30; 67 DEGs), protein (bin 29; 59 DEGs), RNA (bin 27; 52 DEGs), and stress (bin 20; 50 DEGs) (
Fig. 2,
Supplementary Table S1). In addition, cell wall (bin 10; 37 DEGs), transport (bin 34; 30 DEGs), secondary metabolism (bin 16; 23 DEGs), cell (bin 31; 22 DEGs), lipid metabolism (bin 11; 19 DEGs), and hormone metabolism (bin 17; 16 DEGs) were also highly represent-ed (
Fig. 2,
Supplementary Table S1).
The up- and downregulated union DEG sets for each IR type were subjected to GO enrichment analysis with a cutoff threshold of
P ≤ 0.01, and the commonly enriched GO terms for the three IR types are listed in
Table 1. A total of 69 GO terms, including 34 terms in the biological process (BP) category, 31 terms in the molecular function (MF) category, and 4 terms in the cellular components (CC) category, were commonly enriched in the upregulated union DEG sets, and all terms were overrepresented (
Table 1). In the BP category, the enriched GO terms related to carbohydrates, sugars, lipids, proteins, glycans, or amino acids and macromolecular metabolism were the child terms of “metabolic process” (GO:0008152, level 2). Terms such as response to stress or stimulus and defense response were the child terms of “response to stimulus” (GO:0050896, level 2). Terms such as death, cell death, programmed cell death, apoptosis, and cell wall organization were the child terms of “cellular process” (GO:0009987, level 2). The child terms of “biological regulation” were regulation and negative regulation of catalytic activity and molecular function (GO:0065007, level 2). Finally, the terms lipid transport and localization of lipids and macromolecules were the child terms of “localization” (GO:0051179, level 2). The terms in the MF category were divided into two GO terms at level 2, which were binding (GO:0005488) and catalytic activity (GO:0003824). The four terms in the CC category were the child terms of “cellular anatomical entity” (GO:0110165, level 2). Among the downregulated DEG union sets, 12 overrepresented GO terms were commonly enriched (
Table 1). Among the three GO terms in BP, macromolecule modification and protein modifi-cation process were the child terms of “metabolic process” (GO:0008152, level 2), and response to stress was the child term of “response to stimulus” (GO:0050896, level 2). All nine terms in MF were child terms of “binding” (GO:0005488). A total of nine terms were commonly enriched in both up- and downregulated union DEG sets, which were response to stress (GO:0006950), ATP binding (GO:0005524), adenyl ribonucleotide binding (GO:00325 59), adenyl nucleotide binding (GO:0030554), purine nucleoside binding (GO:0001883), nucleoside binding (GO:0001882), purine ribonucleotide binding (GO:00325 55), ribonucleotide binding (GO:0032533), and purine nucleotide binding (GO:0017076) (
Table 1).
As for the GO enrichment analysis, the DEG union sets for each IR type were mapped to KEGG pathways (
Supplementary Table S2). In the upregulated DEGs, 620, 564, and 360 genes, respectively, for GR, IB, and PB were mapped onto 88 pathways (
Supplementary Table S2). The top five KEGG pathways possessing upregulated DEGs were metabolic pathways (dosa01100, 116 genes on average for each IR type), biosynthesis of secondary metabolites (dosa01110, 79 genes), phenylpropanoid biosynthesis (dosa00940, 31 genes), starch and sucrose metabolism (dosa00500, 16 genes), and amino sugar and nucleotide sugar metabolism (dosa00520, 14 genes) (
Supplementary Table S2). For the downregulated DEGs, 130 genes for GR, 173 genes for IB, and 188 genes for PB were mapped onto 49 pathways (
Supplementary Table S2). The first and second most abundant pathways with downregulated DEGs were metabolic pathways (dosa01100, 34 genes) and the biosynthesis of secondary metabolites (dosa01110, 24 genes), which were the same as those with upregulated DEGs (
Supplementary Table S2). Subsequently, plant-pathogen interactions (dosa04626, 11 genes), MAPK signaling pathway (plant) (dosa04016, 6 genes), and ribosome (dosa03010, 6 genes) appeared (
Supplementary Table S2). Among the DEG-mapped pathways, a total of 83 pathways, including 45 pathways with upregulated DEGs, 10 pathways with downregulated DEGs, and 27 pathways with both up- and downregulated DEGs, overlapped for the three IR types. The information on the functional descriptions and expression of the 337 genes mapped to the 83 pathways are listed in
Supplementary Table S3, which shows a predominance of upregulation of the commonly observed DEGs. To investigate the similarity in responses to different types of abiotic stress, the KEGG pathway mapping results of DEGs reported in previous studies on salt and drought stress were retrieved and compared with our data (
Wang et al. 2015;
Zheng et al. 2015;
Khan et al. 2019). The previous studies showed 112 common pathways, and the 99 pathways found in this study that were responsive to IR have 88 in common with those of both salt and drought stress (
Supplementary Table S4).
KEGG pathway enrichment analysis with the up-regulated DEG union sets revealed four commonly enriched pathways for all three IR types (adjusted
P < 0.05): phenylpropanoid biosynthesis (dosa00940); cutin, suberine, and wax biosynthesis (dosa00073); metabolic pathways (dosa01100); and biosynthesis of secondary metabolites (dosa01110). These were significantly over-represented (
Table 2). The downregulated DEG union sets, on the other hand, had no commonly enriched pathways (
Table 2).
The functions of DEGs in the four commonly enriched KEGG pathways were classified (
Table 3). Among the 18 DEGs in phenylpropanoid biosynthesis (dosa00940), 16 were for peroxidase, and the other two were related to beta-glucosidase (
Table 3). In cutin, suberine, and wax biosynthesis (dosa00073), six DEGs were divided into four enzymatic functions, all of which were oxidoreductases of fatty acids (
Table 3). Although the largest number of DEGs (55) and enzyme functions (26) were distributed among metabolic pathways (dosa01100) because of the large size of the grouping, 23 of the 55 DEGs function as peroxidases (
Table 3). Similarly, in the biosynthesis of secondary metabolites pathway (dosa01110), 16 of the 39 DEGs were peroxidases (
Table 3).
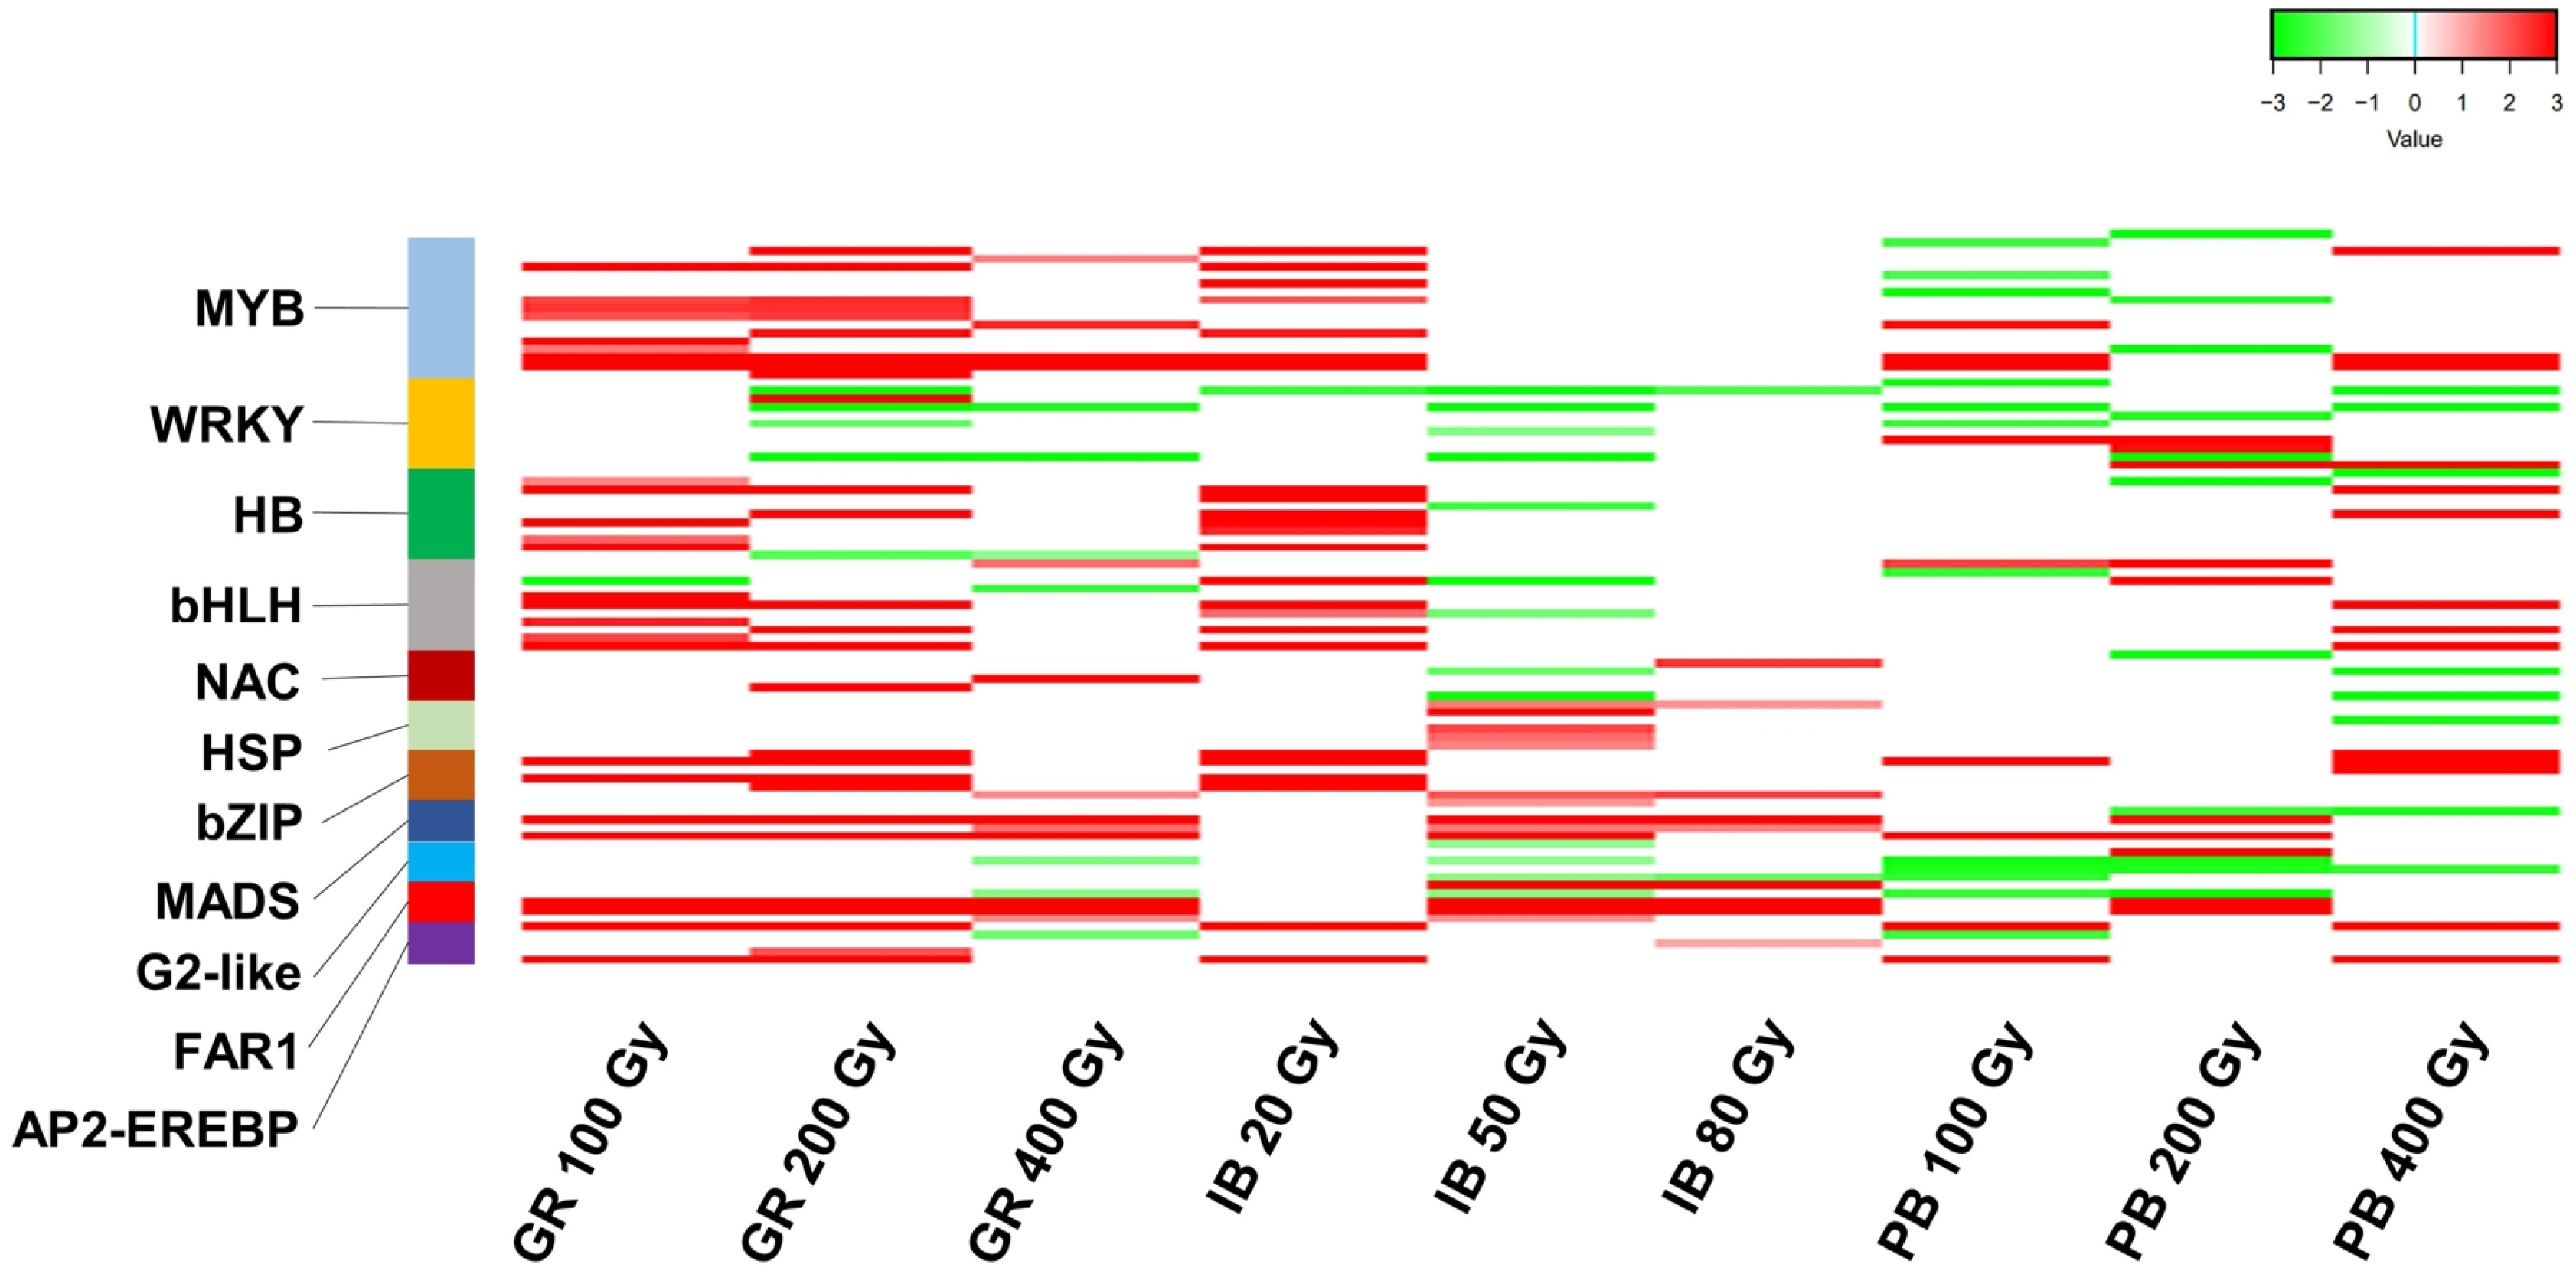
A total of 137 DEGs that act as TFs were identified from the DEG union sets. These genes belong to 41 TF families (
Supplementary Table S5). The MYB family had the largest number, with 18 DEGs, followed by the WRKY, HB, and bHLH families, each with 11 genes (
Fig. 3,
Supplementary Table S5). A heatmap analysis with 11 TF families having at least five DEGs showed that the upregulation of TF DEGs was predominant, except for the two families WRKY and G2-like (
Fig. 3).
DISCUSSION
This study aimed to investigate universal transcriptomic changes induced by different types and doses of IR in rice. From an evolutionary point of view, IR has been regarded as a primordial stressor because all living organisms on Earth have evolved among natural background IR of cosmic and geological origins (
Caplin and Willey 2018). IR causes damage directly to cellular components or indirectly by ROS, which is the product of water radiolysis (
Caplin and Willey 2018;
Choi et al. 2021). This direct and indirect damage can affect biochemical and physiological processes in plants, including growth and development, the biosynthesis of structural and functional components, photosynthesis, signaling, and antioxidant systems (
Caplin and Willey 2018;
Gudkov et al. 2019). The visualization of DEGs from each IR treatment has two implications: the common regulation of DEGs, which were generally up- or downregulated by different IR types and doses (
Fig. 1c), and the commonality in their functional classifications (
Fig. 2).
In plants, responses to different types of stress vary, but some responses are common to develop stress tolerance (
Kim et al. 2004;
Swindell 2006;
Zhang et al. 2019). In this study, GO enrichment analysis with union DEG sets for three IR types revealed commonly enriched GO terms (
Table 1). Among them, functional categories, such as binding, oxidoreductase activity, catalytic activity, and response to stress and stimuli, are previously well-known responses to various abiotic stresses (
Goyal et al. 2016;
Du et al. 2018;
Shu et al. 2018;
Khan et al. 2019; Zhang
et al. 2019). In addition, the KEGG pathway mapping of the union DEG sets demonstrated common pathways among the different IR types (
Supplementary Table S2). Furthermore, the comparative analysis of the KEGG pathway mapping results of DEGs reported in previous studies (
Wang et al. 2015;
Zheng et al. 2015;
Khan et al. 2019) revealed an extensive overlap of pathways responsive to different types of abiotic stress (
Supplementary Table S4). These results suggest that ionizing irradiation acts as an abiotic stressor to induce general responses to stress.
High-dose IR causes irreversible damage and finally leads to plant death, which mainly results from the oxidative stress induced by an excessive intracellular level of ROS (
Halliwell 2006;
Rastogi et al. 2010;
Wang et al. 2018). For this reason, ROS signaling and redox regulation are important physiological processes for plant adaptation to oxidative stress (
You and Chan 2015;
Devireddy et al. 2021). We found four commonly enriched pathways among the three IR types in the KEGG pathway enrichment analysis, all of which are known to be closely related to abiotic stress responses in plants (
Table 2) (
He et al. 2018). Furthermore, the functional classification of the DEGs mapped to the enriched pathways exhibited an abundance of antioxidant enzymes such as peroxidase (
Schaffer and Bronnikova 2012), aminocyclopropanecarboxylate oxidase (
Salleh et al. 2016), and hydroxymethylglutaryl-CoA reductase (NADPH) (
Liu et al. 2020) in the phenylpro-panoid biosynthesis, metabolic pathways, and biosynthesis of secondary metabolite categories (
Table 3,
Supplementary Table S3). DEGs having functions of fatty acid redox enzymes in the cutin, suberine, and wax biosynthesis category are associated with cytochrome P450 protein (
Table 3,
Supplementary Table S3), catalyzing NADPH, or O
2-dependent hydroxylation reactions in primary and secondary metabolism (
Pandian et al. 2020). All DEGs with redox functions were upregulated (
Supplementary Table S3), suggesting that ROS generated by ionizing irradiation may trigger active redox reactions.
As regulatory proteins, TFs are involved in responses to abiotic stress and play important roles in stress signaling and the regulation of expression of stress responsive genes and thus are also important in adaptation to stress (
You and Chan 2015). The annotation of TF families for the DEGs revealed an abundance of TF DEGs associated with stress (
Fig. 2,
Supplementary Table S5). The MYB family has an important role in plant development, secondary metabolism, hormone signaling, and biotic and abiotic stress tolerance in plants (
Katiyar et al. 2012). The WRKY family is known to regulate plant tolerance through abscisic acid and ROS-related signaling pathways against various abiotic stresses such as drought, temperature, and ultraviolet radiation (
Li et al. 2020). The families bHLH (
Wang et al. 2019), NAC (
Nakashima et al. 2012), HSF (
Duan et al. 2019), bZiP (
Hu et al. 2016), MADS (
Arora et al. 2007), and AP2-EREBP (
Kizis et al. 2001) are also known to have responsive roles to abiotic stress (
You and Chan 2015). These indicate that genes belonging to TF families related to stress responses are differentially expressed by different IR types.
In conclusion, we provide transcriptome data in rice seedlings from seeds irradiated with different types and doses of IR. This study has limitations in that RNA sequencing was conducted without biological replicates, which may include potential sampling bias. Nevertheless, the identification of DEGs and comprehensive annotation and enrichment analysis showed that the majority of DEGs have functions closely related to abiotic stress responses and adaptation. The results of our study contribute to our understanding of the mechanisms of stress response and adaptation to various types of IR at the molecular level in plants.
SUPPLEMENTARY MATERIALS
ACKNOWLEDGEMENTS
This research was supported by the research program of the Korea Atomic Energy Research Institute, Republic of Korea.
Fig. 1Differentially expressed genes (DEGs) induced by three types of ionizing radiation (IR) at different doses. (a) Up- and downregulated DEGs. The graph shows the numbers of union DEGs for treatment with each IR at three different doses (100, 200, and 400 Gy for GR; 20, 50, and 80 Gy for IB; and 100, 200, and 400 Gy for PB). (b) Venn diagrams for up- and downregulated union DEGs. (c) Hierarchical clustering heatmap of total union DEGs. Each line represents the Log2 fold change (FC) value, while red and green colors indicate up- and downregulation, respectively. GR, gamma ray; PB, proton beam; IB, ion beam.
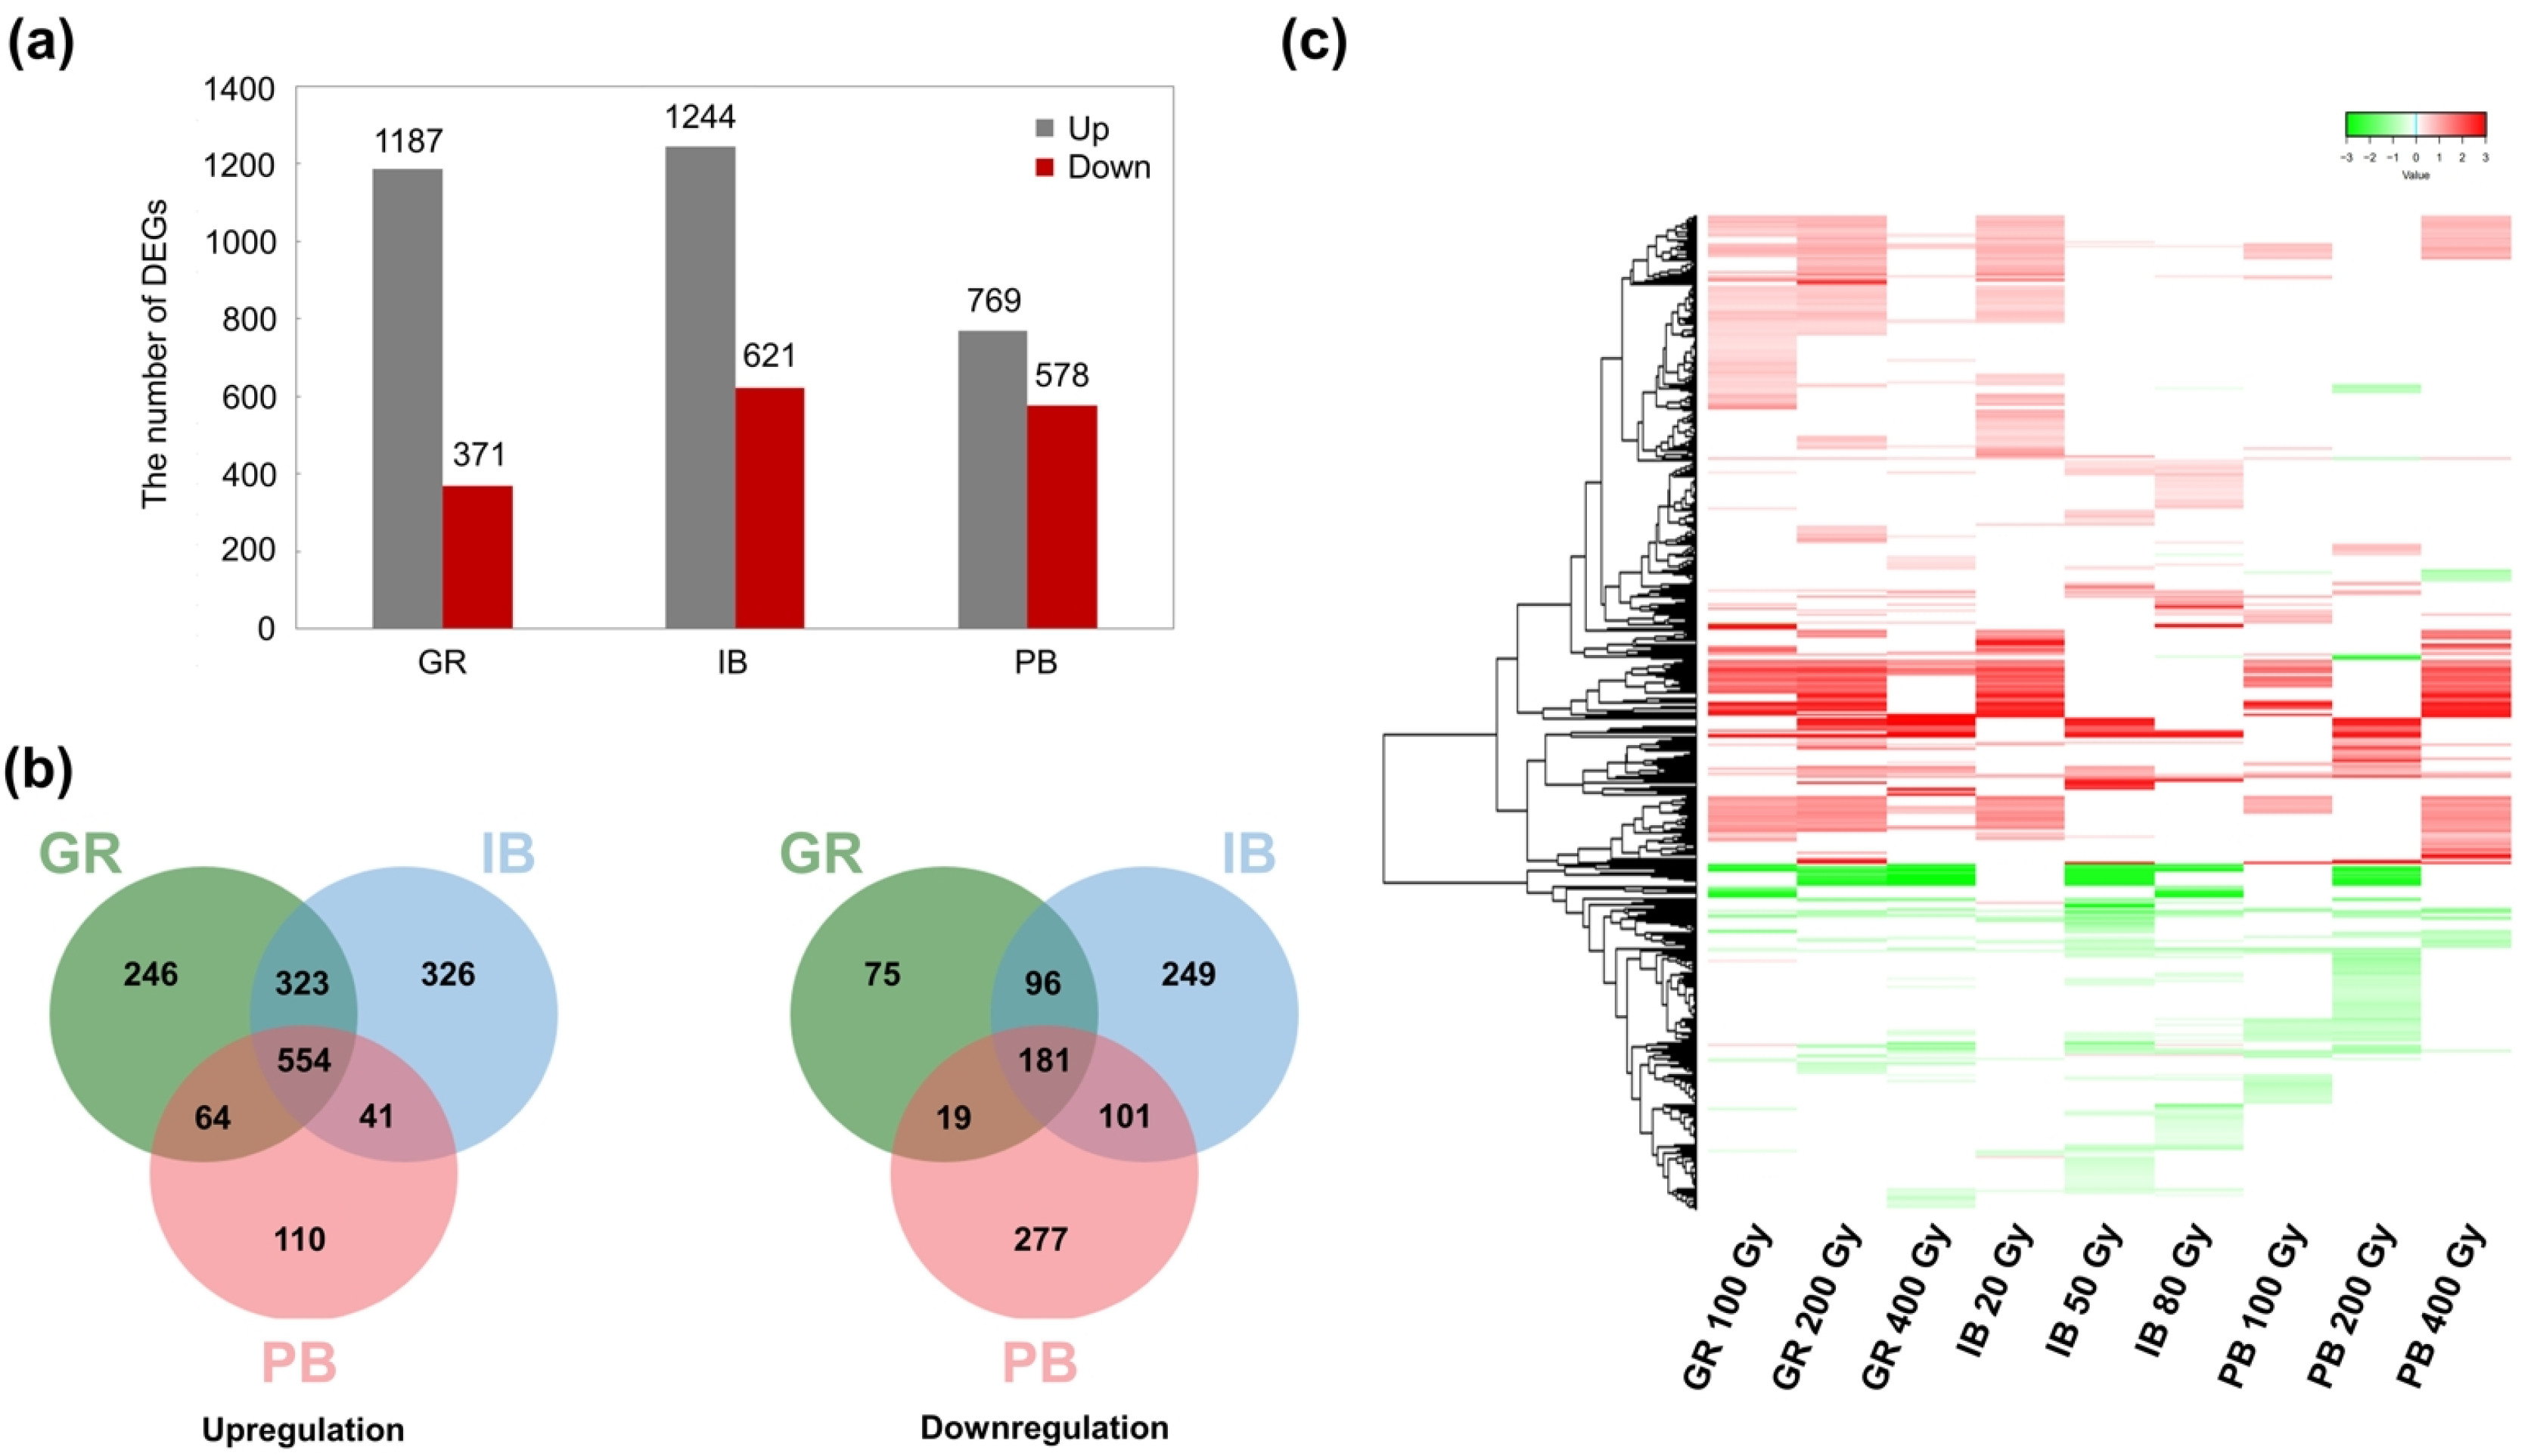
Fig. 2Distribution of differentially expressed genes (DEGs) induced by three different types of ionizing radiation (IR) with different doses on MapMan bins. The numbers in the light purple boxes represent the functional bins defined by MapMan from 1 to 36, and grid boxes in colors represent the Log2FC values of the DEGs (red, upregulated; blue, downregulated). The names of the 36 bins are as follows: 1, photosynthesis; 2, major carbohydrate metabolism; 3, minor carbohydrate metabolism; 4, glycolysis; 5, fermentation; 6, gluconeogenesis/glyoxylate cycle; 7, oxidative pentose phosphate; 8, TCA/org transformation; 9, mitochondrial electron transport/ATP synthesis; 10, cell wall; 11, lipid metabolism; 12, N-metabolism; 13, amino acid metabolism; 14, S-assimilation; 15, metal handling; 16, secondary metabolism; 17, hormone metabolism; 18, cofactor and vitamin metabolism; 19, tetrapyrrole synthesis; 20, stress; 21, redox; 22, polyamine metabolism; 23, nucleotide metabolism; 24, biodegradation of xenobiotics; 25, C1-metabolism; 26, miscellaneous; 27, RNA metabolism; 28, DNA metabolism; 29, protein; 30, signaling; 31, cell; 32, messenger RNA; 33, development; 34, transport; 35, not assigned; 36, mineral nutrition. GR: gamma ray, PB: proton beam, IB: ion beam.

Fig. 3Heatmap of transcription factor (TF) differentially expressed genes (DEGs) induced by three types of ionizing radiation (IR) at different doses. The 11 TF families with at least five DEGs are depicted. Each line represents the Log2 fold change (FC) value, while red and green indicate up- and downregulation, respectively. GR: gamma ray, PB: proton beam, IB: ion beam.

Table 1Significantly enriched gene ontology terms commonly observed in up- and downregulated differentially expressed gene (DEG) union sets for three types of ionizing radiation.
Table 1
|
GO ID |
GO categoryz)
|
GO term |
P-value |
|
Proportion of DEGs (%) |
|
GR |
IB |
PB |
GR |
IB |
PB |
Ref. |
|
Upregulatedd DEG union sets |
|
GO:0005975 |
BP |
Carbohydrate metabolic process |
3.80.E-33 |
4.40.E-22 |
2.30.E-14 |
|
14.12 |
11.49 |
11.50 |
3.46 |
|
GO:0006979 |
BP |
Response to oxidative stress |
3.10.E-13 |
2.80.E-08 |
1.10.E-08 |
|
4.02 |
3.00 |
3.90 |
0.72 |
|
GO:0005976 |
BP |
Polysaccharide metabolic process |
6.00.E-13 |
1.80.E-08 |
6.40.E-07 |
|
3.63 |
2.75 |
3.08 |
0.59 |
|
GO:0006950 |
BP |
Response to stress |
4.10.E-11 |
6.90.E-08 |
1.60.E-11 |
|
8.94 |
7.74 |
10.68 |
3.63 |
|
GO:0044042 |
BP |
Glucan metabolic process |
6.70.E-11 |
1.10.E-05 |
2.30.E-04 |
|
2.72 |
1.75 |
1.85 |
0.39 |
|
GO:0006073 |
BP |
Cellular glucan metabolic process |
6.70.E-11 |
1.10.E-05 |
2.30.E-04 |
|
2.72 |
1.75 |
1.85 |
0.39 |
|
GO:0050896 |
BP |
Response to stimulus |
1.60.E-10 |
3.70.E-07 |
6.00.E-11 |
|
9.72 |
8.36 |
11.50 |
4.26 |
|
GO:0044264 |
BP |
Cellular polysaccharide metabolic process |
2.40.E-10 |
2.50.E-05 |
4.00.E-04 |
|
2.72 |
1.75 |
1.85 |
0.43 |
|
GO:0042221 |
BP |
Response to chemical stimulus |
5.60.E-09 |
2.40.E-05 |
2.20.E-06 |
|
4.27 |
3.25 |
4.31 |
1.25 |
|
GO:0006629 |
BP |
Lipid metabolic process |
3.60.E-06 |
1.80.E-04 |
3.10.E-04 |
|
5.05 |
4.37 |
4.93 |
2.19 |
|
GO:0044092 |
BP |
Negative regulation of molecular function |
9.90.E-06 |
6.90.E-05 |
3.30.E-04 |
|
1.42 |
1.25 |
1.44 |
0.25 |
|
GO:0043086 |
BP |
Negative regulation of catalytic activity |
9.90.E-06 |
6.90.E-05 |
3.30.E-04 |
|
1.42 |
1.25 |
1.44 |
0.25 |
|
GO:0006952 |
BP |
Defense response |
1.10.E-05 |
2.20.E-05 |
1.40.E-06 |
|
4.40 |
4.24 |
5.54 |
1.88 |
|
GO:0019953 |
BP |
Sexual reproduction |
1.10.E-05 |
1.30.E-05 |
5.50.E-07 |
|
0.91 |
0.87 |
1.44 |
0.08 |
|
GO:0006468 |
BP |
Protein amino acid phosphorylation |
1.10.E-05 |
1.60.E-12 |
8.80.E-03 |
|
10.75 |
13.61 |
9.45 |
6.52 |
|
GO:0071554 |
BP |
Cell wall organization or biogenesis |
1.60.E-05 |
7.30.E-06 |
9.50.E-07 |
|
2.20 |
2.25 |
3.08 |
0.61 |
|
GO:0006869 |
BP |
Lipid transport |
6.60.E-05 |
1.40.E-06 |
8.60.E-08 |
|
1.68 |
2.00 |
2.87 |
0.43 |
|
GO:0010876 |
BP |
Lipid localization |
6.60.E-05 |
1.40.E-06 |
8.60.E-08 |
|
1.68 |
2.00 |
2.87 |
0.43 |
|
GO:0016265 |
BP |
Death |
1.60.E-04 |
7.30.E-05 |
1.10.E-03 |
|
4.53 |
4.62 |
4.72 |
2.26 |
|
GO:0008219 |
BP |
Cell death |
1.60.E-04 |
7.30.E-05 |
1.10.E-03 |
|
4.53 |
4.62 |
4.72 |
2.26 |
|
GO:0016052 |
BP |
Carbohydrate catabolic process |
1.80.E-04 |
7.70.E-05 |
6.60.E-03 |
|
1.81 |
1.87 |
1.64 |
0.54 |
|
GO:0012501 |
BP |
Programmed cell death |
2.20.E-04 |
2.10.E-04 |
7.90.E-04 |
|
4.40 |
4.37 |
4.72 |
2.21 |
|
GO:0006915 |
BP |
Apoptosis |
2.20.E-04 |
2.10.E-04 |
7.90.E-04 |
|
4.40 |
4.37 |
4.72 |
2.21 |
|
GO:0000272 |
BP |
Polysaccharide catabolic process |
3.80.E-04 |
8.40.E-05 |
1.90.E-04 |
|
0.91 |
1.00 |
1.23 |
0.15 |
|
GO:0006026 |
BP |
Aminoglycan catabolic process |
4.00.E-04 |
9.60.E-06 |
3.40.E-05 |
|
0.78 |
1.00 |
1.23 |
0.11 |
|
GO:0006030 |
BP |
Chitin metabolic process |
4.00.E-04 |
9.60.E-06 |
3.40.E-05 |
|
0.78 |
1.00 |
1.23 |
0.11 |
|
GO:0006032 |
BP |
Chitin catabolic process |
4.00.E-04 |
9.60.E-06 |
3.40.E-05 |
|
0.78 |
1.00 |
1.23 |
0.11 |
|
GO:0071555 |
BP |
Cell wall organization |
6.30.E-04 |
2.90.E-03 |
2.10.E-03 |
|
1.30 |
1.12 |
1.44 |
0.34 |
|
GO:0006022 |
BP |
Aminoglycan metabolic process |
6.60.E-04 |
1.90.E-05 |
5.90.E-05 |
|
0.78 |
1.00 |
1.23 |
0.12 |
|
GO:0016998 |
BP |
Cell wall macromolecule catabolic process |
7.50.E-04 |
3.20.E-05 |
5.80.E-06 |
|
0.91 |
1.12 |
1.64 |
0.17 |
|
GO:0050790 |
BP |
Regulation of catalytic activity |
8.60.E-04 |
3.50.E-03 |
4.10.E-03 |
|
1.55 |
1.37 |
1.64 |
0.50 |
|
GO:0065009 |
BP |
Regulation of molecular function |
9.20.E-04 |
3.70.E-03 |
4.30.E-03 |
|
1.55 |
1.37 |
1.64 |
0.50 |
|
GO:0044036 |
BP |
Cell wall macromolecule metabolic process |
1.10.E-03 |
5.20.E-05 |
9.10.E-06 |
|
0.91 |
1.12 |
1.64 |
0.19 |
|
GO:0033036 |
BP |
Macromolecule localization |
5.10.E-03 |
5.20.E-04 |
1.10.E-03 |
|
3.11 |
3.50 |
3.90 |
1.71 |
|
GO:0004553 |
MF |
Hydrolase activity, hydrolyzing O-glycosyl compounds |
1.90.E-29 |
1.80.E-20 |
4.30.E-19 |
|
9.59 |
7.74 |
9.45 |
1.76 |
|
GO:0016798 |
MF |
Hydrolase activity, acting on glycosyl bonds |
8.20.E-28 |
7.60.E-20 |
1.50.E-18 |
|
9.84 |
8.11 |
9.86 |
1.99 |
|
GO:0016684 |
MF |
Oxidoreductase activity, acting on peroxide as acceptor |
7.90.E-13 |
5.40.E-08 |
2.10.E-08 |
|
4.02 |
3.00 |
3.90 |
0.75 |
|
GO:0004601 |
MF |
Peroxidase activity |
7.90.E-13 |
5.40.E-08 |
2.10.E-08 |
|
4.02 |
3.00 |
3.90 |
0.75 |
|
GO:0016209 |
MF |
Antioxidant activity |
2.40.E-12 |
3.70.E-07 |
2.30.E-08 |
|
4.15 |
3.00 |
4.11 |
0.84 |
|
GO:0016491 |
MF |
Oxidoreductase activity |
1.10.E-09 |
1.00.E-06 |
1.00.E-09 |
|
13.21 |
11.74 |
14.99 |
6.94 |
|
GO:0005515 |
MF |
Protein binding |
1.20.E-09 |
6.70.E-09 |
2.60.E-03 |
|
17.49 |
16.98 |
14.37 |
10.22 |
|
GO:0032555 |
MF |
Purine ribonucleotide binding |
3.70.E-09 |
3.40.E-15 |
2.00.E-03 |
|
21.50 |
24.22 |
18.48 |
13.67 |
|
GO:0032553 |
MF |
Ribonucleotide binding |
3.70.E-09 |
3.40.E-15 |
2.00.E-03 |
|
21.50 |
24.22 |
18.48 |
13.67 |
|
GO:0017076 |
MF |
Purine nucleotide binding |
4.50.E-09 |
1.60.E-15 |
1.80.E-03 |
|
22.28 |
25.22 |
19.30 |
14.36 |
|
GO:0016762 |
MF |
Xyloglucan:xyloglucosyl transferase activity |
3.30.E-08 |
1.50.E-04 |
7.10.E-06 |
|
1.42 |
0.87 |
1.44 |
0.12 |
|
GO:0005507 |
MF |
Copper ion binding |
4.50.E-08 |
5.50.E-06 |
1.40.E-10 |
|
2.59 |
2.12 |
3.90 |
0.54 |
|
GO:0005524 |
MF |
ATP binding |
5.20.E-08 |
3.00.E-14 |
1.50.E-03 |
|
19.82 |
22.72 |
17.66 |
12.81 |
|
GO:0032559 |
MF |
Adenyl ribonucleotide binding |
5.40.E-08 |
3.20.E-14 |
1.50.E-03 |
|
19.82 |
22.72 |
17.66 |
12.82 |
|
GO:0030554 |
MF |
Adenyl nucleotide binding |
5.80.E-08 |
1.40.E-14 |
1.30.E-03 |
|
20.60 |
23.72 |
18.48 |
13.49 |
|
GO:0001883 |
MF |
Purine nucleoside binding |
5.80.E-08 |
1.40.E-14 |
1.30.E-03 |
|
20.60 |
23.72 |
18.48 |
13.49 |
|
GO:0001882 |
MF |
Nucleoside binding |
7.10.E-08 |
1.80.E-14 |
1.50.E-03 |
|
20.60 |
23.72 |
18.48 |
13.53 |
|
GO:0020037 |
MF |
Heme binding |
7.50.E-08 |
5.70.E-05 |
6.60.E-09 |
|
6.09 |
4.99 |
7.60 |
2.49 |
|
GO:0046906 |
MF |
Tetrapyrrole binding |
1.10.E-07 |
7.40.E-05 |
9.20.E-09 |
|
6.09 |
4.99 |
7.60 |
2.53 |
|
GO:0003824 |
MF |
Catalytic activity |
1.10.E-07 |
3.10.E-07 |
1.40.E-03 |
|
62.31 |
61.80 |
59.75 |
52.85 |
|
GO:0005506 |
MF |
Iron ion binding |
6.60.E-07 |
3.40.E-05 |
5.50.E-08 |
|
6.48 |
5.74 |
8.01 |
2.96 |
|
GO:0004672 |
MF |
Protein kinase activity |
1.20.E-05 |
1.90.E-12 |
9.30.E-03 |
|
10.75 |
13.61 |
9.45 |
6.54 |
|
GO:0042802 |
MF |
Identical protein binding |
2.80.E-05 |
1.80.E-04 |
6.60.E-04 |
|
1.42 |
1.25 |
1.44 |
0.28 |
|
GO:0004650 |
MF |
Polygalacturonase activity |
2.20.E-04 |
5.70.E-03 |
3.10.E-03 |
|
1.04 |
0.75 |
1.03 |
0.19 |
|
GO:0000287 |
MF |
Magnesium ion binding |
2.20.E-04 |
9.60.E-04 |
1.50.E-04 |
|
1.81 |
1.62 |
2.26 |
0.56 |
|
GO:0004568 |
MF |
Chitinase activity |
4.00.E-04 |
9.60.E-06 |
3.40.E-05 |
|
0.78 |
1.00 |
1.23 |
0.11 |
|
GO:0004867 |
MF |
Serine-type endopeptidase inhibitor activity |
1.20.E-03 |
1.50.E-03 |
1.70.E-08 |
|
1.04 |
1.00 |
2.46 |
0.25 |
|
GO:0003993 |
MF |
Acid phosphatase activity |
3.20.E-03 |
3.80.E-03 |
2.10.E-03 |
|
0.78 |
0.75 |
1.03 |
0.17 |
|
GO:0004866 |
MF |
Endopeptidase inhibitor activity |
3.40.E-03 |
4.20.E-03 |
1.00.E-07 |
|
1.04 |
1.00 |
2.46 |
0.30 |
|
GO:0030414 |
MF |
Peptidase inhibitor activity |
3.40.E-03 |
4.20.E-03 |
1.00.E-07 |
|
1.04 |
1.00 |
2.46 |
0.30 |
|
GO:0016829 |
MF |
Lyase activity |
7.30.E-03 |
2.50.E-03 |
2.20.E-03 |
|
2.46 |
2.62 |
3.08 |
1.28 |
|
GO:0005576 |
CC |
Extracellular region |
2.20.E-11 |
3.00.E-09 |
7.60.E-14 |
|
4.40 |
3.87 |
6.16 |
1.04 |
|
GO:0005618 |
CC |
Cell wall |
1.70.E-09 |
1.10.E-05 |
1.40.E-05 |
|
2.33 |
1.62 |
2.05 |
0.34 |
|
GO:0030312 |
CC |
External encapsulating structure |
6.40.E-08 |
1.30.E-04 |
1.20.E-04 |
|
2.33 |
1.62 |
2.05 |
0.44 |
|
GO:0048046 |
CC |
Apoplast |
3.40.E-07 |
4.50.E-05 |
8.50.E-06 |
|
2.07 |
1.62 |
2.26 |
0.39 |
|
Downregulated DEG union sets
|
|
GO:0043412 |
BP |
Macromolecule modification |
9.90.E-06 |
3.50.E-05 |
4.70.E-03 |
|
17.82 |
15.08 |
12.75 |
8.22 |
|
GO:0006464 |
BP |
Protein modification process |
1.40.E-05 |
3.70.E-05 |
8.80.E-03 |
|
17.33 |
14.77 |
12.09 |
8.01 |
|
GO:0006950 |
BP |
Response to stress |
7.60.E-03 |
2.00.E-04 |
4.40.E-04 |
|
7.43 |
8.00 |
7.84 |
3.63 |
|
GO:0005524 |
MF |
ATP binding |
1.60.E-08 |
6.40.E-10 |
1.60.E-03 |
|
27.72 |
25.54 |
18.95 |
12.81 |
|
GO:0032559 |
MF |
Adenyl ribonucleotide binding |
1.60.E-08 |
6.60.E-10 |
1.60.E-03 |
|
27.72 |
25.54 |
18.95 |
12.82 |
|
GO:0030554 |
MF |
Adenyl nucleotide binding |
3.60.E-08 |
1.40.E-09 |
1.90.E-03 |
|
28.22 |
26.15 |
19.61 |
13.49 |
|
GO:0001883 |
MF |
Purine nucleoside binding |
3.60.E-08 |
1.40.E-09 |
1.90.E-03 |
|
28.22 |
26.15 |
19.61 |
13.49 |
|
GO:0001882 |
MF |
Nucleoside binding |
4.00.E-08 |
1.60.E-09 |
2.10.E-03 |
|
28.22 |
26.15 |
19.61 |
13.53 |
|
GO:0032555 |
MF |
Purine ribonucleotide binding |
5.80.E-08 |
5.00.E-10 |
1.70.E-03 |
|
28.22 |
26.77 |
19.93 |
13.67 |
|
GO:0032553 |
MF |
Ribonucleotide binding |
5.80.E-08 |
5.00.E-10 |
1.70.E-03 |
|
28.22 |
26.77 |
19.93 |
13.67 |
|
GO:0000166 |
MF |
Nucleotide binding |
8.80.E-08 |
6.10.E-09 |
6.30.E-05 |
|
31.19 |
28.92 |
24.84 |
16.09 |
|
GO:0017076 |
MF |
Purine nucleotide binding |
1.20.E-07 |
1.10.E-09 |
2.00.E-03 |
|
28.71 |
27.38 |
20.59 |
14.36 |
Table 2Significantly enriched Kyoto Encyclopedia of Genes and Genomes (KEGG) pathways in up- and downregulated differentially expressed gene (DEG) union sets for three types of ionizing radiation.
Table 2
|
KEGG ID |
Pathway name |
Adjusted P-value |
|
Percent of DEGs |
|
GR |
IB |
PB |
GR |
IB |
PB |
Ref. |
|
Upregulated DEG union sets |
|
dosa00940 |
Phenylpropanoid biosynthesis |
1.73.E-10 |
5.73.E-06 |
2.18.E-08 |
|
18.67 |
14.91 |
21.36 |
4.62 |
|
dosa00073 |
Cutin, suberine and wax biosynthesis |
1.78.E-10 |
3.57.E-05 |
1.18.E-06 |
|
7.23 |
4.97 |
7.77 |
0.56 |
|
dosa01100 |
Metabolic pathways |
9.94.E-07 |
4.09.E-07 |
2.16.E-04 |
|
68.07 |
68.94 |
68.93 |
47.39 |
|
dosa01110 |
Biosynthesis of secondary metabolites |
2.81.E-06 |
2.09.E-05 |
4.66.E-07 |
|
43.37 |
42.24 |
50.49 |
24.96 |
|
dosa00520 |
Amino sugar and nucleotide sugar metabolism |
2.26.E-03 |
5.07.E-03 |
- |
|
10.24 |
9.94 |
- |
3.59 |
|
dosa00071 |
Fatty acid degradation |
4.27.E-03 |
- |
- |
|
5.42 |
- |
- |
1.22 |
|
dosa00460 |
Cyanoamino acid metabolism |
4.90.E-03 |
- |
- |
|
4.82 |
- |
- |
0.98 |
|
dosa00500 |
Starch and sucrose metabolism |
5.73.E-03 |
- |
- |
|
9.04 |
- |
- |
3.14 |
|
dosa04145 |
Phagosome |
3.78.E-02 |
- |
- |
|
6.02 |
- |
- |
1.93 |
|
dosa00062 |
Fatty acid elongation |
- |
1.05.E-02 |
- |
|
- |
3.73 |
- |
0.62 |
|
Downregulated DEG union sets
|
|
dosa00591 |
Linoleic acid metabolism |
2.39.E-04 |
- |
- |
|
10.81 |
|
- |
0.39 |
|
dosa00592 |
Alpha-Linolenic acid metabolism |
1.47.E-02 |
- |
- |
|
10.81 |
|
- |
1.04 |
|
dosa00073 |
Cutin, suberine and wax biosynthesis |
- |
- |
1.86.E-02 |
|
- |
- |
5.71 |
0.56 |
|
dosa00062 |
Fatty acid elongation |
- |
- |
2.78.E-02 |
|
- |
- |
5.71 |
0.62 |
Table 3Functional classification of differentially expressed genes in four commonly enriched Kyoto Encyclopedia of Genes and Genomes (KEGG) pathways for three types of ionizing radiation.
Table 3
|
KEGG pathway (ID) |
Enzyme name |
EC number |
Number of DEGs |
|
Phenylpropanoid biosynthesis (dosa00940) |
Peroxidase |
EC:1.11.1.7 |
16 |
|
Beta-glucosidase |
EC:3.2.1.21 |
2 |
|
Cutin, suberine and wax biosynthesis (dosa00073) |
Fatty acid omega-hydroxy dehydrogenase |
EC:1.1.-.- |
2 |
|
Fatty acid omega-hydroxylase |
EC:1.14.-.- |
2 |
|
Alcohol-forming fatty acyl-coa reductase |
EC:1.2.1.84 |
1 |
|
Long-chain fatty acid omega-monooxygenase |
EC:1.14.14.80 |
1 |
|
Metabolic pathways (dosa01100) |
Peroxidase |
EC:1.11.1.7 |
23 |
|
Long-chain acyl-coa synthetase |
EC:6.2.1.3 |
3 |
|
Aldehyde dehydrogenase (NAD+) |
EC:1.2.1.3 |
2 |
|
Basic endochitinase B |
EC:3.2.1.14 |
2 |
|
Beta-glucosidase |
EC:3.2.1.21 |
2 |
|
Fatty acid omega-hydroxylase |
EC:1.14.-.- |
2 |
|
Indole-3-glycerol-phosphate lyase |
EC:4.1.2.8 |
2 |
|
15-cis-phytoene synthase |
EC:2.5.1.32 |
1 |
|
3'(2'), 5'-bisphosphate nucleotidase |
EC:3.1.3.7 |
1 |
|
Acetate/butyrate---coa ligase |
EC:6.2.1.1 6.2.1.2 |
1 |
|
Alcohol dehydrogenase class-P |
EC:1.1.1.1 |
1 |
|
Anthocyanidin reductase |
EC:1.3.1.77 |
1 |
|
Asparagine synthase (glutamine-hydrolysing) |
EC:6.3.5.4 |
1 |
|
ATP citrate (pro-S)-lyase |
EC:2.3.3.8 |
1 |
|
Beta-carotene 3-hydroxylase |
EC:1.14.15.24 |
1 |
|
Beta-glucosidase |
EC:3.2.1.21 |
1 |
|
Cysteine synthase |
EC:2.5.1.47 |
1 |
|
L-3-cyanoalanine synthase/cysteine synthase |
EC:2.5.1.47 4.4.1.9 |
1 |
|
Malate dehydrogenase (oxaloacetate-ecarboxylating)(NADP+) |
EC:1.1.1.40 |
1 |
|
Sphingolipid 4-desaturase/C4-monooxygenase |
EC:1.14.19.17 |
1 |
|
Sterol 14alpha-demethylase |
EC:1.14.14.154 |
1 |
|
Tartrate-resistant acid phosphatase type 5 |
EC:3.1.3.2 |
1 |
|
UDP-apiose/xylose synthase |
|
1 |
|
V-type H+-transporting atpase subunit A |
EC:7.1.2.2 |
1 |
|
V-type H+-transporting atpase subunit E |
|
1 |
|
Pyruvate dehydrogenase E2 component (dihydrolipoamide acetyltransferase) |
EC:2.3.1.12 |
1 |
|
Biosynthesis of secondary metabolites (dosa01110) |
Peroxidase |
EC:1.11.1.7 |
16 |
|
Glycerol-3-phosphate acyltransferase |
EC:2.3.1.15 2.3.1.198 |
3 |
|
3-ketoacyl-coa synthase |
EC:2.3.1.199 |
2 |
|
(3S)-linalool synthase |
EC:4.2.3.25 |
1 |
|
9-cis-epoxycarotenoid dioxygenase |
EC:1.13.11.51 |
1 |
|
Aldehyde dehydrogenase (NAD+) |
EC:1.2.1.3 |
1 |
|
Aminocyclopropanecarboxylate oxidase |
EC:1.14.17.4 |
1 |
|
Anthocyanidin reductase |
EC:1.3.1.77 |
1 |
|
Asparagine synthase (glutamine-hydrolysing) |
EC:6.3.5.4 |
1 |
|
Beta-glucosidase |
EC:3.2.1.21 |
1 |
|
Beta-glucosidase |
EC:3.2.1.21 |
1 |
|
Biosynthesis of secondary metabolites (dosa01110) |
Cysteine synthase |
EC:2.5.1.47 |
1 |
|
Glucose-6-phosphate 1-epimerase |
EC:5.1.3.15 |
1 |
|
Hydroxymethylglutaryl-coa reductase (NADPH) |
EC:1.1.1.34 |
1 |
|
Isocitrate dehydrogenase |
EC:1.1.1.42 |
1 |
|
Jasmonate O-methyltransferase |
EC:2.1.1.141 |
1 |
|
Lipoxygenase |
EC:1.13.11.12 |
1 |
|
Malate dehydrogenase |
EC:1.1.1.37 |
1 |
|
Pyruvate dehydrogenase E2 component (dihydrolipoamide acetyltransferase) |
EC:2.3.1.12 |
1 |
|
Ribulose-bisphosphate carboxylase small chain |
EC:4.1.1.39 |
1 |
|
S-adenosylmethionine synthetase |
EC:2.5.1.6 |
1 |
References
- Anders S, Pyl PT, Huber W. 2015. HTSeq - a Python framework to work with high-throughput sequencing data. Bioinformatics.. 31: 166-169.
- Arora R, Agarwal P, Ray S, Singh AK, Singh VP, Tyagi AK, et al. 2007. MADS-box gene family in rice: Genome-wide identification, organization and expression profiling during reproductive development and stress. BMC Genomics. 8: 1-21.
- Caplin N, Willey N. 2018. Ionizing radiation, higher plants, and radioprotection: From acute high doses to chronic low doses. Front. Plant Sci.. 9: 847
- Chinnusamy V, Schumaker K, Zhu JK. 2004. Molecular genetic perspectives on cross-talk and specificity in abiotic stress signalling in plants. J. Exp. Bot.. 55: 225-236.
- Choi HI, Han SM, Jo YD, Hong MJ, Kim SH, Kim JB. 2021. Effects of acute and chronic gamma irradiation on the cell biology and physiology of rice plants. Plants. 10: 439
- Devireddy AR, Zandalinas SI, Fichman Y, Mittler R. 2021. Integration of reactive oxygen species and hormone signaling during abiotic stress. Plant J.. 105: 459-476.
- Dolferus R, Ji X, Richards RA. 2011. Abiotic stress and control of grain number in cereals. Plant Sci.. 181: 331-341.
- Du M, Ding G, Cai Q. 2018. The transcriptomic responses of Pinus massoniana to drought stress. Forests. 9: 326
- Duan S, Liu B, Zhang Y, Li G, Guo X. 2019. Genome-wide identification and abiotic stress-responsive pattern of heat shock transcription factor family in Triticum aestivum L. BMC Genomics. 20: 1-20.
- Esnault MA, Legue F, Chenal C. 2010. Ionizing radiation: Advances in plant response. Environ. Exp. Bot.. 68: 231-237.
- Goyal E, Amit SK, Singh RS, Mahato AK, Chand S, Kanika K. 2016. Transcriptome profiling of the salt-stress response in Triticum aestivum cv. Kharchia Local. Sci. Rep.. 6: 1-14.
- Gudkov SV, Grinberg MA, Sukhov V, Vodeneev V. 2019. Effect of ionizing radiation on physiological and molecular processes in plants. J. Environ. Radioact.. 202: 8-24.
- Halliwell B. 2006. Reactive species and antioxidants. Redox biology is a fundamental theme of aerobic life. Plant Physiol.. 141: 312-322.
- He M, He CQ, Ding NZ. 2018. Abiotic stresses: General defenses of land plants and chances for engineering multistress tolerance. Front. Plant Sci.. 9: 1771
- Hu W, Yang H, Yan Y, Wei Y, Tie W, Ding Z, et al. 2016. Genome-wide characterization and analysis of bZIP transcription factor gene family related to abiotic stress in cassava. Sci. Rep.. 6: 1-12.
- Huefner ND, Yoshiyama K, Friesner JD, Conklin PA, Britt AB. 2014. Genomic stability in response to high versus low linear energy transfer radiation in Arabidopsis thaliana. Front. Plant Sci.. 5: 206
- Hwang JE, Hwang SG, Kim SH, Lee KJ, Jang CS, Kim JB, et al. 2014. Transcriptome profiling in response to different types of ionizing radiation and identification of multiple radio marker genes in rice. Physiol. Plant.. 150: 604-619.
- Jo YD, Kim JB. 2019. Frequency and Spectrum of Radiation-Induced Mutations Revealed by Whole-Genome Sequencing Analyses of Plants. Quantum Beam Sci.. 3: 7
- Kanehisa M, Sato Y. 2020. KEGG Mapper for inferring cellular functions from protein sequences. Protein Sci.. 29: 28-35.
- Katiyar A, Smita S, Lenka SK, Rajwanshi R, Chinnusamy V, Bansal KC. 2012. Genome-wide classification and expression analysis of MYB transcription factor families in rice and Arabidopsis. BMC Genomics.. 13: 1-19.
- Khan MA, Alghamdi SS, Ammar MH, Sun Q, Teng F, Migdadi HM, et al. 2019. Transcriptome profiling of faba bean (Vicia faba L.) drought-tolerant variety hassawi-2 under drought stress using RNA sequencing. Electron. J. Biotechnol.. 39: 15-29.
- Kim JB, Kang JY, Soo YK. 2004. Over-expression of a transcription factor regulating ABA-responsive gene expression confers multiple stress tolerance. Plant Biotechnol. J.. 2: 459-466.
- Kim SH, Song M, Lee KJ, Hwang SG, Jang CS, Kim JB, et al. 2012. Genome-wide transcriptome profiling of ROS scavenging and signal transduction pathways in rice (Oryza sativa L.) in response to different types of ionizing radiation. Mol. Biol. Rep.. 39: 11231-11248.
- Kizis D, Lumbreras V, Pagès M. 2001. Role of AP2/EREBP transcription factors in gene regulation during abiotic stress. FEBS Lett.. 498: 187-189.
- Li H, Durbin R. 2009. Fast and accurate short read alignment with Burrows-Wheeler transform. Bioinformatics. 25: 1754-1760.
- Li W, Pang S, Lu Z, Jin B. 2020. Function and mechanism of WRKY transcription factors in abiotic stress responses of plants. Plants. 9: 1515
- Liu M, Yu H, Ouyang B, Shi C, Demidchik V, Hao Z, et al. 2020. NADPH oxidases and the evolution of plant salinity tolerance. Plant Cell Environ.. 43: 2957-2968.
- Love MI, Huber W, Anders S. 2014. Moderated estimation of fold change and dispersion for RNA-seq data with DESeq2. Genome Biol.. 15: 1-21.
- Lv DK, Bai X, Li Y, Ding XD, Ge Y, Cai H, et al. 2010. Profiling of cold-stress-responsive miRNAs in rice by microarrays. Gene. 459: 39-47.
- Mangrauthia SK, Agarwal S, Sailaja B, Sarla N, Voleti SR. 2016. Transcriptome Analysis of Oryza sativa (Rice) Seed Germination at High Temperature Shows Dynamics of Genome Expression Associated with Hormones Signalling and Abiotic Stress Pathways. Trop. Plant Biol.. 9: 215-228.
- Mittler R, Vanderauwera S, Gollery M, Van Breusegem F. 2004. Reactive oxygen gene network of plants. Trends Plant Sci.. 9: 490-498.
- Moumeni A, Satoh K, Kondoh H, Asano T, Hosaka A, Venuprasad R, et al. 2011. Comparative analysis of root transcriptome profiles of two pairs of drought-tolerant and susceptible rice near-isogenic lines under different drought stress. BMC Plant Biol.. 11: 1-17.
- Nakashima K, Takasaki H, Mizoi J, Shinozaki K, Yamaguchi-Shinozaki K. 2012. NAC transcription factors in plant abiotic stress responses. Biochim. Biophys. Acta Gene Regul. Mech.. 1819: 97-103.
- Pandian BA, Sathishraj R, Djanaguiraman M, Prasad PVV, Jugulam M. 2020. Role of cytochrome P450 enzymes in plant stress response. Antioxidants. 9: 454
- Patel RK, Jain M. 2012. NGS QC toolkit: A toolkit for quality control of next generation sequencing data. PLoS One.. 7: e30619
- Pérez-Rodríguez P, Riaño-Pachón DM, Corrêa LGG, Rensing SA, Kersten B, Mueller-Roeber B. 2010. PlnTFDB: Updated content and new features of the plant transcription factor database. Nucleic Acids Res.. 38: 822-827.
- Rastogi RP, Richa , Kumar A, Tyagi MB, Sinha RP. 2010. Molecular mechanisms of ultraviolet radiation-induced DNA damage and repair. J. Nucleic Acids. 2010: 592980
- Reimand J, Arak T, Adler P, Kolberg L, Reisberg S, Peterson H, et al. 2016. g:Profiler-a web server for functional interpretation of gene lists (2016 update). Nucleic Acids Res.. 44: W83-W89.
- Salleh FM, Mariotti L, Spadafora ND, Price AM, Picciarelli P, Wagstaff C, et al. 2016. Interaction of plant growth regulators and reactive oxygen species to regulate petal senescence in wallflowers (Erysimum linifolium). BMC Plant Biol.. 16: 1-14.
- Schaffer WM, Bronnikova TV. 2012. Peroxidase-ROS interactions. Nonlinear Dyn.. 68: 413-430.
- Sewelam N, Kazan K, Schenk PM. 2016. Global plant stress signaling: Reactive oxygen species at the cross-road. Front. Plant Sci.. 7: 187
- Shankar R, Bhattacharjee A, Jain M. 2016. Transcriptome analysis in different rice cultivars provides novel insights into desiccation and salinity stress responses. Sci. Rep.. 6: 1-15.
- Shu Y, Li W, Zhao J, Liu Y, Guo C. 2018. Transcriptome sequencing and expression profiling of genes involved in the response to abiotic stress in Medicago ruthenica. Genet. Mol. Biol.. 41: 638-648.
- Suzuki N, Rivero RM, Shulaev V, Blumwald E, Mittler R. 2014. Abiotic and biotic stress combinations. New Phytol.. 203: 32-43.
- Swindell WR. 2006. The association among gene expression responses to nine abiotic stress treatments in Arabidopsis thaliana. Genetics. 174: 1811-1824.
- Takatsuji T, Yoshikawa I, Sasaki MS. 1999. Generalized concept of the LET-RBE relationship of radiation-induced chromosome aberration and cell death. J. Radiat. Res.. 40: 59-69.
- Thimm O, Bläsing O, Gibon Y, Nagel A, Meyer S, Krüger P, et al. 2004. MAPMAN: A user-driven tool to display genomics data sets onto diagrams of metabolic pathways and other biological processes. Plant J.. 37: 914-939.
- Tian T, Liu Y, Yan H, You Q, Yi X, Du Z, et al. 2017. AgriGO v2.0: A GO analysis toolkit for the agricultural community, 2017 update. Nucleic Acids Res.. 45: W122-W129.
- Verma V, Ravindran P, Kumar PP. 2016. Plant hormone-mediated regulation of stress responses. BMC Plant Biol.. 16: 1-10.
- Wang J, Li B, Meng Y, Ma X, Lai Y, Si E, et al. 2015. Transcriptomic profiling of the salt-stress response in the halophyte Halogeton glomeratus. BMC Genomics. 16: 1-14.
- Wang L, Ma R, Yin Y, Jiao Z. 2018. Antioxidant response of Arabidopsis thaliana seedlings to oxidative stress induced by carbon ion beams irradiation. J. Environ. Radioact.. 195: 1-8.
- Wang L, Xiang L, Hong J, Xie Z, Li B. 2019. Genome-wide analysis of bHLH transcription factor family reveals their involvement in biotic and abiotic stress responses in wheat (Triticum aestivum L.). 3 Biotech. 9: 1-12.
- You J, Chan Z. 2015. ROS regulation during abiotic stress responses in crop plants. Front. Plant Sci.. 6: 1092
- Zhang W, Liu S, Li C, Zhang , Pengying , Zhang , et al. 2019. Transcriptome sequencing of Antarctic moss under salt stress emphasizes the important roles of the ROS-scavenging system. Gene. 696: 122-134.
- Zhang Y, Ali U, Zhang G, Yu L, Fang S, Iqbal S, et al. 2019. Transcriptome analysis reveals genes commonly respond-ing to multiple abiotic stresses in rapeseed. Mol. Breed.. 39: 1-19.
- Zhang Y, Lv Y, Jahan N, Chen G, Ren D, Guo L. 2018. Sensing of abiotic stress and ionic stress responses in plants. Int. J. Mol. Sci.. 19: 3298
- Zheng L, Meng Y, Ma J, Zhao X, Cheng T, Ji J, et al. 2015. Transcriptomic analysis reveals importance of ROS and phytohormones in response to short-term salinity stress in Populus tomentosa. Front. Plant Sci.. 6: 678